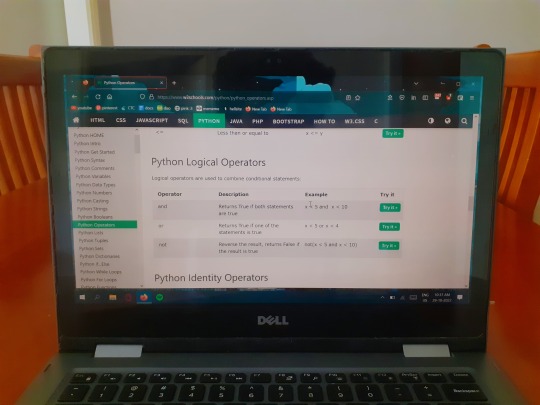
#python tips
Text
Using Cython to Optimize Python Code
Python is a popular and versatile programming language, but it can be slow compared to other languages like C or C++. This is where Cython comes in. Cython is a tool that allows you to write Python-like code, but compiles it to C, resulting in faster performance.
Cython is particularly useful for scientific and numerical computing, where performance is critical. It can be used to optimize existing Python code, or write new code in Cython for improved performance. In this article, we’ll take a look at how to use Cython and why it’s valuable for Python programmers to learn.
Getting started with Cython is easy. You can install it using pip, the Python package manager, by running the following command in your terminal:

Once you have Cython installed, you can start using it to optimize your Python code. The basic idea is to write your code in Cython, then compile it to C, which can then be imported and used in your Python code.
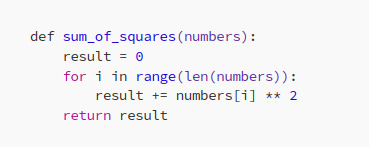
Here’s a simple example that demonstrates how to use Cython. Let’s say we have a Python function that calculates the sum of squares of numbers in a list:
We can optimize this function by writing it in Cython, then compiling it to C. Here’s the Cython version:
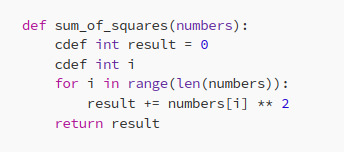
In this example, we’ve added a cdef statement to declare the variables as C data types, which results in faster performance. We can then compile this Cython code to C using the following command in our terminal:

This will generate a .c file that can be imported and used in your Python code.
Cython is a powerful tool that allows you to write Python-like code and optimize it for performance. Whether you’re working on scientific and numerical computing or just looking to improve the performance of your code, Cython is worth learning.
Some great resources for learning Cython include the official documentation, tutorials and example code on the Cython website, and the “Cython: A Guide for Python Programmers” book by Kurt Smith.
Here is the Cython Wiki:
As well as the ReadTheDocs for Cython:
There is also a great tutorial series on using Cython by Pythonist on Youtube
youtube
By using Cython, you can take your Python skills to the next level and achieve faster performance for your code. Give it a try and see the results for yourself!
#Cython#python#Cpython#python programming#python3#python code#python tips#python programmer#tips and tricks#tech tips#tech tutorial#programming tutorial#code optimization#better programmer#tips#programming#programmer#programmers#tech industry#tech#Youtube
7 notes
·
View notes
Text
How you can use python for data wrangling and analysis
Python is a powerful and versatile programming language that can be used for various purposes, such as web development, data science, machine learning, automation, and more. One of the most popular applications of Python is data analysis, which involves processing, cleaning, manipulating, and visualizing data to gain insights and make decisions.
In this article, we will introduce some of the basic concepts and techniques of data analysis using Python, focusing on the data wrangling and analysis process. Data wrangling is the process of transforming raw data into a more suitable format for analysis, while data analysis is the process of applying statistical methods and tools to explore, summarize, and interpret data.
To perform data wrangling and analysis with Python, we will use two of the most widely used libraries: Pandas and NumPy. Pandas is a library that provides high-performance data structures and operations for manipulating tabular data, such as Series and DataFrame. NumPy is a library that provides fast and efficient numerical computations on multidimensional arrays, such as ndarray.
We will also use some other libraries that are useful for data analysis, such as Matplotlib and Seaborn for data visualization, SciPy for scientific computing, and Scikit-learn for machine learning.
To follow along with this article, you will need to have Python 3.6 or higher installed on your computer, as well as the libraries mentioned above. You can install them using pip or conda commands. You will also need a code editor or an interactive environment, such as Jupyter Notebook or Google Colab.
Let’s get started with some examples of data wrangling and analysis with Python.
Example 1: Analyzing COVID-19 Data
In this example, we will use Python to analyze the COVID-19 data from the World Health Organization (WHO). The data contains the daily situation reports of confirmed cases and deaths by country from January 21, 2020 to October 23, 2023. You can download the data from here.
First, we need to import the libraries that we will use:import pandas as pd
import numpy as np
import matplotlib.pyplot as plt
import seaborn as sns
Next, we need to load the data into a Pandas DataFrame:df = pd.read_csv('WHO-COVID-19-global-data.csv')
We can use the head() method to see the first five rows of the DataFrame:df.head()
Date_reportedCountry_codeCountryWHO_regionNew_casesCumulative_casesNew_deathsCumulative_deaths2020–01–21AFAfghanistanEMRO00002020–01–22AFAfghanistanEMRO00002020–01–23AFAfghanistanEMRO00002020–01–24AFAfghanistanEMRO00002020–01–25AFAfghanistanEMRO0000
We can use the info() method to see some basic information about the DataFrame, such as the number of rows and columns, the data types of each column, and the memory usage:df.info()
Output:
RangeIndex: 163800 entries, 0 to 163799 Data columns (total 8 columns): # Column Non-Null Count Dtype — — — — — — — — — — — — — — — 0 Date_reported 163800 non-null object 1 Country_code 162900 non-null object 2 Country 163800 non-null object 3 WHO_region 163800 non-null object 4 New_cases 163800 non-null int64 5 Cumulative_cases 163800 non-null int64 6 New_deaths 163800 non-null int64 7 Cumulative_deaths 163800 non-null int64 dtypes: int64(4), object(4) memory usage: 10.0+ MB “><class 'pandas.core.frame.DataFrame'>
RangeIndex: 163800 entries, 0 to 163799
Data columns (total 8 columns):
# Column Non-Null Count Dtype
--- ------ -------------- -----
0 Date_reported 163800 non-null object
1 Country_code 162900 non-null object
2 Country 163800 non-null object
3 WHO_region 163800 non-null object
4 New_cases 163800 non-null int64
5 Cumulative_cases 163800 non-null int64
6 New_deaths 163800 non-null int64
7 Cumulative_deaths 163800 non-null int64
dtypes: int64(4), object(4)
memory usage: 10.0+ MB
We can see that there are some missing values in the Country_code column. We can use the isnull() method to check which rows have missing values:df[df.Country_code.isnull()]
Output:
Date_reportedCountry_codeCountryWHO_regionNew_casesCumulative_casesNew_deathsCumulative_deaths2020–01–21NaNInternational conveyance (Diamond Princess)WPRO00002020–01–22NaNInternational conveyance (Diamond Princess)WPRO0000……………………2023–10–22NaNInternational conveyance (Diamond Princess)WPRO07120132023–10–23NaNInternational conveyance (Diamond Princess)WPRO0712013
We can see that the missing values are from the rows that correspond to the International conveyance (Diamond Princess), which is a cruise ship that had a COVID-19 outbreak in early 2020. Since this is not a country, we can either drop these rows or assign them a unique code, such as ‘IC’. For simplicity, we will drop these rows using the dropna() method:df = df.dropna()
We can also check the data types of each column using the dtypes attribute:df.dtypes
Output:Date_reported object
Country_code object
Country object
WHO_region object
New_cases int64
Cumulative_cases int64
New_deaths int64
Cumulative_deaths int64
dtype: object
We can see that the Date_reported column is of type object, which means it is stored as a string. However, we want to work with dates as a datetime type, which allows us to perform date-related operations and calculations. We can use the to_datetime() function to convert the column to a datetime type:df.Date_reported = pd.to_datetime(df.Date_reported)
We can also use the describe() method to get some summary statistics of the numerical columns, such as the mean, standard deviation, minimum, maximum, and quartiles:df.describe()
Output:
New_casesCumulative_casesNew_deathsCumulative_deathscount162900.000000162900.000000162900.000000162900.000000mean1138.300062116955.14016023.4867892647.346237std6631.825489665728.383017137.25601215435.833525min-32952.000000–32952.000000–1918.000000–1918.00000025%-1.000000–1.000000–1.000000–1.00000050%-1.000000–1.000000–1.000000–1.00000075%-1.000000–1.000000–1.000000–1.000000max -1 -1 -1 -1
We can see that there are some negative values in the New_cases, Cumulative_cases, New_deaths, and Cumulative_deaths columns, which are likely due to data errors or corrections. We can use the replace() method to replace these values with zero:df = df.replace(-1,0)
Now that we have cleaned and prepared the data, we can start to analyze it and answer some questions, such as:
Which countries have the highest number of cumulative cases and deaths?
How has the pandemic evolved over time in different regions and countries?
What is the current situation of the pandemic in India?
To answer these questions, we will use some of the methods and attributes of Pandas DataFrame, such as:
groupby() : This method allows us to group the data by one or more columns and apply aggregation functions, such as sum, mean, count, etc., to each group.
sort_values() : This method allows us to sort the data by one or more
loc[] : This attribute allows us to select a subset of the data by labels or conditions.
plot() : This method allows us to create various types of plots from the data, such as line, bar, pie, scatter, etc.
If you want to learn Python from scratch must checkout e-Tuitions to learn Python online, They can teach you Python and other coding language also they have some of the best teachers for their students and most important thing you can also Book Free Demo for any class just goo and get your free demo.
#python#coding#programming#programming languages#python tips#python learning#python programming#python development
1 note
·
View note
Text
50 Comprehensive Python Tips and Tricks to Read Now
Here are 50 Python tips and answers based on the provided code:
Python Tips and Tricks
Use shebang #!/usr/bin/env python at the beginning of the script to specify the interpreter to use.
Import necessary modules using the import statement. For example, import pandas as pd imports the pandas module and assigns the alias pd.
Use regular expressions (regex) by importing the re module to perform…

View On WordPress
1 note
·
View note
Text
"Python vs. Other Programming Languages: Why Python is Overtaking the Tech Industry"
Python has grown in prominence in recent years, and for good cause. It's easy to see why it's become one of the world's most popular programming languages. In this post, we'll look at why Python is sweeping the computer world and how it compares to other programming languages.
Easy to Learn - Python is known for its straightforward and uncomplicated syntax, which makes it an excellent choice for newcomers. Python uses less code to complete fundamental tasks than other programming languages like Java or C++, which decreases development time and boosts productivity.
Versatility - Python differs from other programming languages in part due to its versatility. It is employed in a number of different industries, including web development, data analysis, artificial intelligence, machine learning, and more. Due to its adaptability, it is a great option for companies of all sizes, from small start-ups to huge corporations.
Vast Community and Support - The vast and active Python community makes it simpler for developers to get assistance and support. The development of open-source libraries and frameworks, which can reduce the time and effort required to create applications, is also supported by this community.
Integration with Other Languages - Python is a popular choice across many industries because it is simple to combine with other computer languages. Python, for instance, can be used to create web applications and to communicate with databases like MySQL and MongoDB.
High Demand in the Job Market - Python developers are in high demand as a result of the language's rising popularity. Python coders are in high demand across a range of sectors, including web development, data science, and machine learning, making it a rewarding career choice for many.
In conclusion, Python is a popular choice for developers and businesses alike due to its versatility, simplicity of learning, big community, support, integration with other languages, and high demand in the employment market. Python will probably continue to dominate and play a significant influence in determining the direction of technology as the tech sector expands and changes.
Are you prepared to increase your programming abilities? Join the CACMS Institute's Python course right away! To register and learn more, go here: http://cacms.in/python/
#CACMS Institute#python programming#python#python training in Amritsar#Python course in Amritsar#Python tips
0 notes
Text

it crismiss
mer critmiss
[id: Second Breakfast, the yellow and white ball python, with a Santa hat on, being cuddled by Star]
#Second Breakfast#the noodles#reptiblr#snake#ball python#holidays#Christmas#yes I used a picture I’d used before but I went to get pictures of her today and she hissed so :(#mean old lady hours#to be fair she’d tipped her bowl of water everywhere and was soggy and pissed
487 notes
·
View notes
Text
GUESS WHOS GETTING A SNAKE TOMORROW
BEEN PREPARING FOR THIS FOR YEARS
MY LIL SNEKY BABY
ITS GONNA BE SO AWESOME 😈
HE COMES HOME IN A BAG 😃
WILL POST ONSHOT OF HOW I GOT HIM IN MY MCU DR SOMTIME CUZ I SCRIPTED HIM IN LITERAL *YEARS* AGO
#ANY TIPS PLEASE SHARE#FOR WRITING AND SNAKE CARE#mcu dr#desired reality#shiftblr#Royal python#Snake care#reality shifter#shifting#my snek#snekblr#ball python
12 notes
·
View notes
Text
if I can learn how to mod a game coded in python by staring at the raw code instead of taking a python coding course I bet I could totally do that with html and themes too instead of properly learning
#196#coding#html#themes#tumblr themes#shitposting#?#I did actually do that thing w/ python btw. I ran around the clangen code and figured out how to mod a ton of stuff w/o ever taking a cours#it was really fun#honestly I just really wanna overcomplicate my theme by making a proper playlist for the music section and adding a million little buttons#and pop ups and anime girls and little hidden things and blinkies and just#a bunch of silly stuff#I wanna add MORE!!!#I've been half tempted to ask the creator of the theme for tips on the things I have in mind but I don't wanna be rude
16 notes
·
View notes
Text

Just caught Toast mid-shed! It's been a good day
#cinnamon toast toffee cake#he tore it off near the tail end tho#just flourished that thang in the air and ripped it off the tip like boy why#now i'll have to peel it off ya#oh well#my pets#ball python
23 notes
·
View notes
Text
Want to Support My Research and Get Some Cool Subscriber Only Content?
Hey everyone, so I know a lot of you really love my programming stuff. If you want step-by-step tutorials on how to make certain types of machine learning models, python projects, and other awesome subscriber only content, while supporting my research and helping me donate to a good cause (15% of earnings will be donated to the HDSA to improve Huntington's Disease patient's lives as well as fund life changing research being funded by them right now, I will include the donation receipt each time I donate!), you can now subscribe to my Post+ subscription!
It would mean a lot to me and I will ALWAYS provide proof of donation as well! I want to make a change, and you can help.
I will start posting stuff for my Post+ subscribers as soon as I get my first Subscriber (I want to make sure you're in this with me before I start creating a bunch of stuff!) I will be gone tomorrow because of my teeth issue but I will be home tomorrow night.
Anyways, it would mean a lot and I promise to give you an inside look at what I do and how to do everything I do!
Love you all, you are super amazing people!
#programming#programmer#technology#coding#huntingtons disease#machine learning#ai#artificial intelligence#aicommunity#python programming#python tutorial#python 3#python#programming tutorial#tech tips#programming tips#python tips#Post+#charity#fundraising#HDSA
0 notes
Text
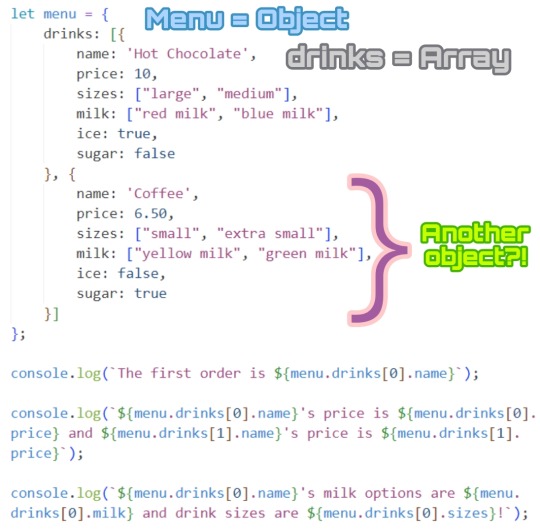
This was my JavaScript Nested Data homework was on that I mentioned in this post! As you can see they are all nested inside and at the bottom, I had to print out certain information from within the data collections.
I see it as like a tree and the nested data are the tree branches and to retrieve the data you want, you have to follow the connection from the tree trunk up to the branches. For example, I want to get "price: 10" printed out:
Menu > drinks > first item > price = 10
menu.drinks[0].price
It's a mess in my head but I'll get used to it! 🤷🏾♀️👍🏽💕
#programming#comp sci#coding#studyblr#100 days of code#studying#python#javascript#homework#tech#technology#computer science#software developer#projects#study tips#study space#study hard#xc: studies
121 notes
·
View notes
Text
Fic data from 2023
Happy new year! This was a big year for me because I got back into reading fanfiction, and boy howdy did I read a lot of it. Over the year I tracked what fics I read got that sweet, sweet data about how much of what I read and when. So now it's time for it to all come together! I put the major stats above the read more line, and below are some other little details about the tags and types of fics. Without further ado, let's get into it!
My goal this year was to read 1000 fics which I realized around June was NOT going to happen. I actually read about 651 fics including re-reads. Not too shabby!
The total words of all the fics I started was 5,196,016 and multiplying by the percent finished (could be >100 for re-reads, or <100 for dnf) I read about 6,214,399 words. So, HOLY BALLS 6.2 MILLION WORDS???? JFC. THATS LIKE 16K EVERY SINGLE DAY. ok i will never again tell myself i didn't read enough this year. Can you imagine if I had hit 1000 fics?
Something else fun about the word count is that the average length was about 1584 words/fic.
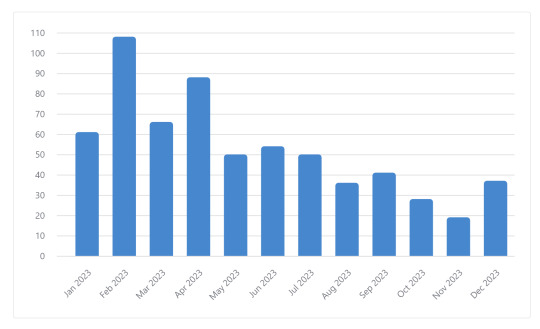
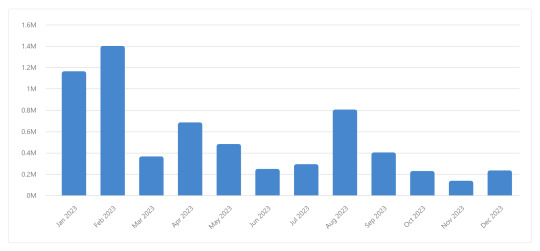
My top months by number of fics were February (108 fics), April (88 fics), and March (66 fics). In terms of word count, my top months were February (1.4 million words), January (1.16 million words) and August (804k words).
Keep reading for graphs and data about tags!
Before we get into tags, here's the graphs for the stuff I mentioned earlier. Keep in mind that the first two are about fics I started, not necessarily finished, so the count may vary a bit.
The top three longest fics I read were meet me where the light greets the dark at 115514 words, Subito Sempre at 107053 words, and This Game We Play at 101717 words. Those also happen to be some of my favorite fics of all time.
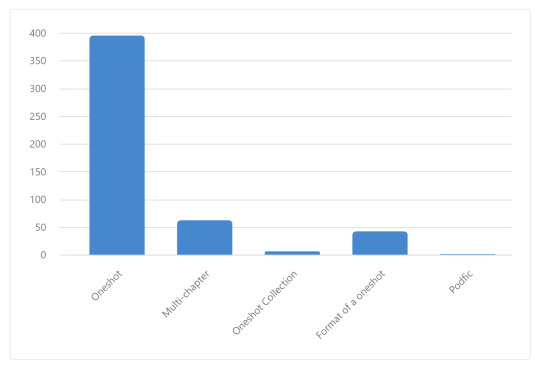
Here's a graph about the length of the fic I read. "Format of a oneshot" is something that may be multiple chapters but was short enough that it could've been one. Idk this database was built on vibes.
I know 54% of the authors! Speaking of, there were 208 distinct authors I read from this year. My top author was JynxedOracle at 33 fics!
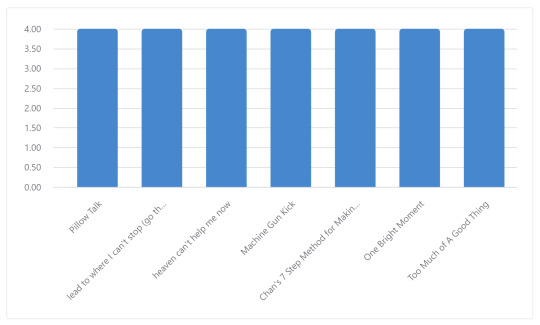
These are the fics I re-read most:
OK tag time! Let's start with relationship:
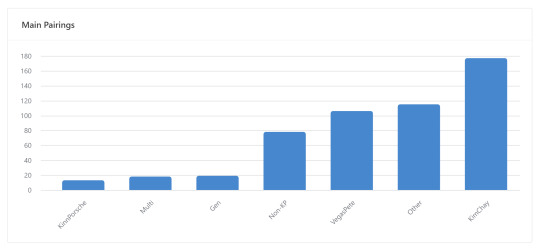
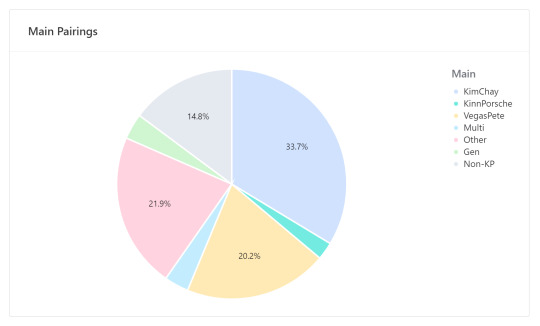
VegasPete almost had it for a while but KimChay will always be my ride or die. Also, if you can't tell, I basically read almost exclusively KinnPorsche The Series fics. For my top fandom outside of KPTS, that would be MCU, and my top non-KP relationship was SpideyPool. My highest rarepair within KPTS will go to my grave or the groupchat. :*)
My highest read additional tag by a WIDE margin (I'm sorry mother) was porn without plot. (Guess that explains why the average words is so low).
I was gonna post the graphs of all my tags but not only are they a mess, I simply refuse to out myself like that this publicly.
On to Warnings and Rating:
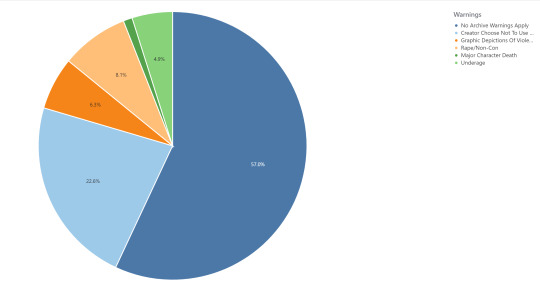
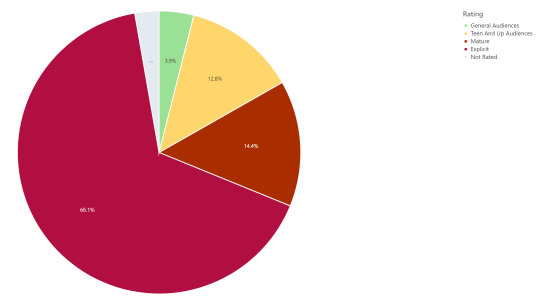
...Don't be ashamed of me, I'm ashamed enough of myself.
Final thing! I met my goodreads goal of 100 books by adding a random book every time I read up to 80k words! My goal for 2024 is to find god and maybe read something other than porn :)
Thanks for reading!

#ao3#ao3 wrapped#data#mm that sexy data#kinnporsche fic#kinnporche the series#kimchay#vegaspete#mcu#spideypool#personal post#fandom#fandom things#fanfiction#i cant express to yall how fun this was#if anyone has tips for how to use excel pls send#i like airtable but the record limit is a killer#im trying to use the ao3 api with python to auto populate excel#it works to an extent but i need help (T T)#fic#ok bye now#this took me way too long to make
13 notes
·
View notes
Text
18.03.2024
Today was a decently normal Monday. My teachers informed me today that I might be getting an essay I completed a while ago and getting my science test results back soon.
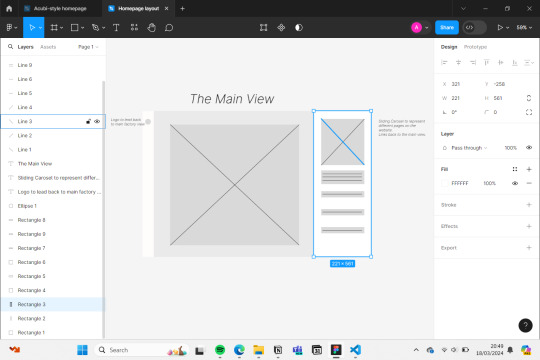
After school, I tried to start the home page of the website I'm currently building Project.Spider and I would like to say that thanks to the help of Bing AI, ChatGPT and Visual Studio Code, I could finish one part.

🎧- Shut up my mom's calling - Hotel Ugly
🌲- 3hrs
#aesthetic#studying#books#bookish#bookworm#book community#booknerd#currently reading#bookstagram#student life#coding#python#programming#engineering#developer#html#html css#css#figma#figmadesign#figma to html#studyblr community#productivity#productivity challenge#productivityboost#study#study motivation#study notes#study tips#study with me
6 notes
·
View notes
Text

27.10.2022
✧Everyone is obliged to appreciate my Weathering With You wallpaper. I got some Python done today ! ✧
🎧 Invisible String - Taylor Swift
#quinn notes#I love this wallpaper smmmm#Studyblr#Studygram#Studyspo#studying#study blog#Study motivation#Student Life#Productivity#Python#study aesthetic#Study tips#heydilli#Heycoral#Heyzainab#heypeachblossom
62 notes
·
View notes
Text
(looking up the category list of who's the Grand Moff and Moffs in swtor)
me: Shame, there aren't many Moffs who are women except for two.
muses: you know you could milfied up Kilran like you did with Marr and Jadus. Just look at Andor's Dedra for inspo. 👀
me: ...
muses: ...
me: absolutely not.
#seren ramble posts#tip: dont encourage my muses or i end up dropping the monthy python 'he has a wife you know' joke
5 notes
·
View notes
Text
It is time! My tutorial has been live since this morning but i have finally crawled out of bed for coffee and am now functioning.
once again i am just so proud and excited to show this tutorial to you. it is based off of just one function i have built in my personal tarot bot named grimalkin. if this tutorial is any fun to you, let me know and i’ll write more on the other commands grimalkin-bot has!
thanks for all of your support. i will see you soon with a new one!
#codeblr#studyblr#progblr#medium writers#pips tutorials#pips coding#learn to code#comp sci#python#python programming#python projects#discord#discord bot#discord stuff#coding tutorial#programming tutorial#coding tips#programming tips
14 notes
·
View notes
Last Seen Blogs


thesenseofwonder
The Sense of Wonder

instantsushii-blog
Trash-chan

silvagiovanni13
I can’t stop blaming myself

lailaverse
Laila