#ms excel
Text
Microsoft released copilot in Excel, and it is officially caught up with Google on the AI race. Fantastic to watch.
102 notes
·
View notes
Text
9 notes
·
View notes
Text
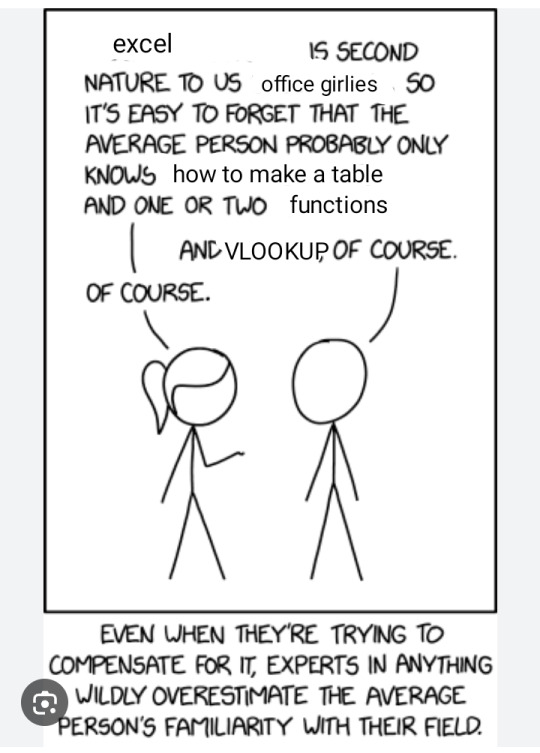
Reminder not to take this too serious. It’s a silly little tumblr poll, be kind to each other and have a good time.
#they have too many programs with blue and green icons so I used the yellow one for publisher ok#ms office#microsoft#ms word#ms powerpoint#ms excel#ms Publisher#ms Access#outlook#onenote#my stuff#my polls#was thinking about PowerPoint and ended up with this poll
22 notes
·
View notes
Text
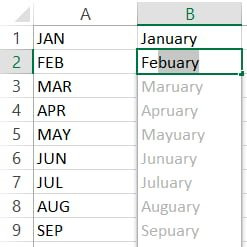
good job, Excel, that's exactly what I wanted <3

23 notes
·
View notes
Text
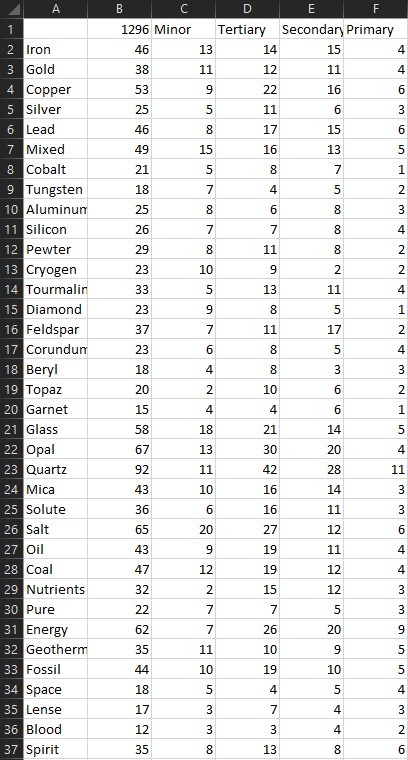
All 1296 individual mineral deposits for my conworld in a map and an itemized list :)
I'll be using both to reverse engineer the tectonics of my world, since if I know there is coal in an area, I know that at one point it was at or near the equator.
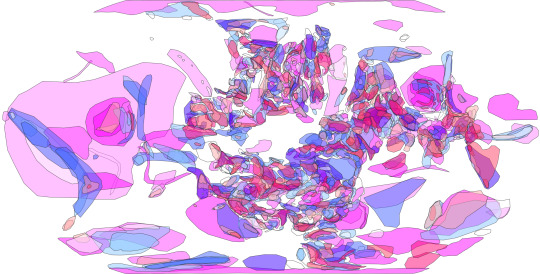
Also here is the basemap I am working off of, there are about 15 major regions, 51 regions, and 172 subregions, the subregions are labeled, and there are two maps below it showing the makeup of the major's and regions.
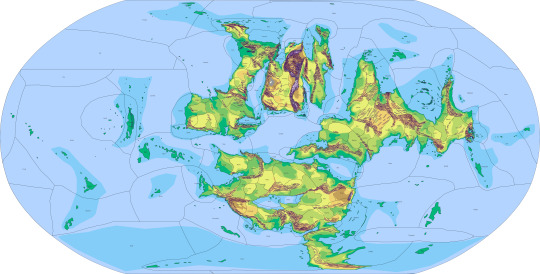
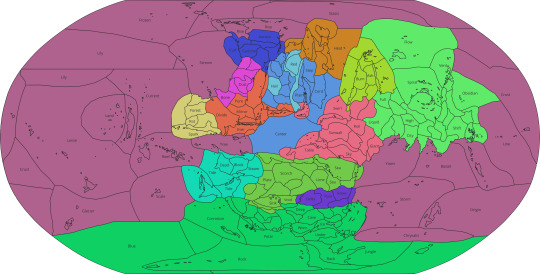

Feel free to ask for clarifications RE: Mineral definitions or Regional phenomena 😎👍
30 notes
·
View notes
Text
11 notes
·
View notes
Text
#microsoft#ms paint#ms word#powerpoint#ms excel#onenote#Personally I'm a huge MS paint fan.#If you couldn't tell by the pfp#and banner
3 notes
·
View notes
Text
youtube
MS Excel + ArtificiaI Intelligence | Learn formula without knowing formula | धासु ट्रिक
Watch video on TECH ALERT yt
https://youtu.be/3UsRTGTFMNk
#TechAlert #howto #shorts #technology #Youtube #shortstory #YouTubeshorts #instagram #reelsvideo #reelsinstagram #reelsfb #reels #reelsviral #viralreels #youtubers #Youtube #instadaily #likeforfollow #picoftheday #followers #smilechallenge #likeforlikes #msoffice #msexcelformulas #msexceltips #AI
#techalert#howto#technology#love#youtube#instagood#like#techalertr#technical#ms office#ms excel#ai#Youtube
2 notes
·
View notes
Text

*squints at Bill Gates*
#dank memes#fresh memes#funny memes#memes#lol#college#school#microsoft#ms excel#microsoft excel#spreadsheets
9 notes
·
View notes
Text

7 notes
·
View notes
Photo

How create universal dashboard with Data Charting in Excel for Business
https://exceltable.com/en/templates/financial-business-analytics-for-sales
Charts and graphs is a feature of Microsoft Excel that allows you to visually represent data in various types, such as bar graphs, line charts, pie charts, etc.Excel visualization is a useful way to present data in a clear and easy-to-understand format that can help you quickly identify trends, patterns, and relationships between different data sets.
2 notes
·
View notes
Text
Excel Shortcuts keys

1 note
·
View note
Text
If any of you have any secret, esoteric Excel knowledge that you want to share, I'd love to hear it.
I'm rebuilding the inventory document for our department and while I consider myself generally fairly competent with Excel, I certainly don't know everything.
Specifically, if you have any suggestions for:
- maintaining formatting and formulas when multiple users will be adding and removing rows in different sections of the worksheet (to add new shipments and remove items that have been depleted)
- tips for conditional formatting (I know the basics but haven't used it much)
- general input about using Excel as an inventory tracking sheet if anyone has specific experience with that
1 note
·
View note
Text
Totally unrelated to everything but I love the Dollarsigns in references to cells in excel.
It makes me feel like a magician or spy when writing and copying formulas.
I swear I just want to hug those sticky little $'s so hard and ruffle their hair and shout "Great Job Team" at them everytime I use them.
3 notes
·
View notes
Last Seen Blogs

never-land7
I'm the son of all I've done


ananabilaolshop
Ana Nabila Olshop

aceinspace
Hello there.

ryann-44
Ryan