#gantt chart
Text
Do YOU Love Gantt Charts?
I keep getting an add that starts with "Do you love Gantt charts?" Like. I'm sorry, who loves a type of data display? It almost feels like an AI wrote it from a combination of successful ads. You can ask shit like "Do you like kittens" because duh. Everyone likes kittens, but Gantt charts? It's a fucking chart, calm down.
If I seem to passionate about this it's because this is one of only three ads YouTube gives me and I think I'm losing my mind.
7 notes
·
View notes
Text
2nd year review is coming up.. you know what that means! Gantt chart time!
It's a good time to reflect on progress, and actually recognise that real progress had been made.
It's also a good reason to prioritise tasks, and change the pace of completing different tasks accordingly.
My 2nd year Gantt chart looks a lot different from my first year one, because I'm more knowledgeable about my project and roughly how my methods might work and feed in to eachother. Knowing more about my independent work speed has also changed how I predict my workload to go.
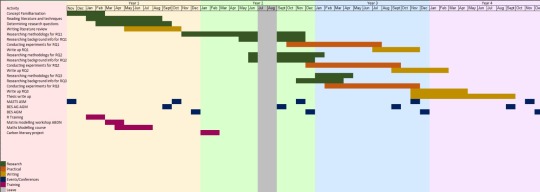
1st yr reviewer Gantt chart:
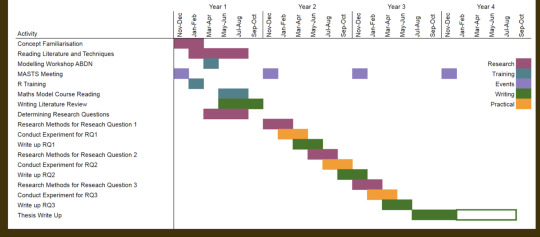
2nd yr review Gantt chart:
#phd life#phd research#phdblr#phd diary#phd student#phdjourney#phd review#gantt chart#phd planning#marine ecology#ecological modelling
5 notes
·
View notes
Text

DissertationWritingHelper is one of the focused agencies that is committed to quality. We specially value client concern about the project that they face in their PhD and Master’s degree. We also know the importance of ongoing job of the client have to maintain during their course program. Our teams of experts are focused on maintaining the confidentiality.
#thesis#motivation letter#literature review#ai#dissertation writing#data analysis#mixed methods analysis#synopsis#spss#handwritten assignments#modules#proposal writing#hand written assignments#grammar sentences#plagiarism#online google survey forms#gantt chart
0 notes
Text
How to Make Gantt Chart in Excel | Gantt Charts In Excel | Gantt Chart Excel | Gantt Chart
Gantt chart in Excel involves organizing your project data, setting up a table, and then using Excel's built-in features to create the Gantt chart.
Learn More - The Knowledge Academy
0 notes
Text
Generate Interactive SVG/Canvas Gantt Charts With JavaScript
An easy-to-use yet robust JavaScript library for generating interactive Gantt charts using SVG, Canvas and JSX.
Can be used to represent project schedules, dependencies, and progress in a graphical manner.
See Also:
10 Best Gantt Chart Plugins In JavaScript
How to use it:
1. Install and import the gantt chart component.
import {
SVGGantt, // SVG Chart
CanvasGantt, // Canvas Chart
StrGantt //…
View On WordPress
1 note
·
View note
Text
0 notes
Text
Fun Fact Friday
Henry Gantt comes from Scottish lineage. Thomas Gantt and his wife Mary Graham, a Scotswoman, emigrated to the colony of Maryland in 1660 and settled on a plantation known as ‘Myrtle Range’ in Prince George’s Country.
Henry Laurence Gantt, leader in industry, by L.P. Alford

1 note
·
View note
Text
Advantages Of Using The Gantt Chart
A Gantt scheduling software is a project management tool that illustrates the timeline of a project. It usually contains two sections: a list of tasks on the left and a timetable with schedule bars that represent work on the right.
0 notes
Text
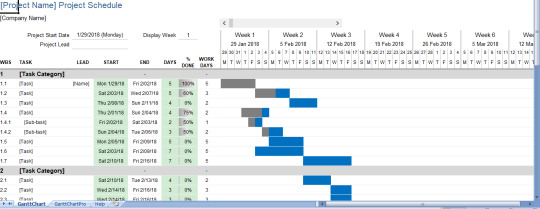
Major Study - Project Planning
Gantt Chart Improvement
The Gantt chart is a simple yet powerful project planning tool. It helps in visualizing project progress and determines the expected timelines and milestones. Basically, it’s a chart to track project progress over time. It’s usefulness is being able to see multiple deadlines and track the progress of your project.
I have redesigned my gantt chart since the gantt chart I created earlier for the major project was not very promising so I have improved it. This is the Gantt chart I have created for the upcoming weeks of production. It shows the time available to me to complete the project, starting from 1st June and ending on 17th August. It also features a list of all the tasks I have to complete, listed in as much detail as possible to make this more effective to visualize the different steps in production. I found it a useful way to plan what I’ll be doing each day, because Its a lengthy project that needs to be completed in 2 and half month so its really important to organize what I will be doing.
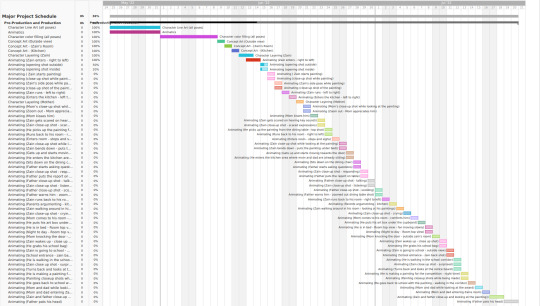

Each task is represented with a color coded box.
Boxes that are filled in are the tasks I have completed already and those that are empty needs to be done.
The time for the project is shown at the top with the dates, days and weeks.
Some tasks are completed in one day while some are spread out to several days, depending on the length of the task.
0 notes
Text
Simple Project Gantt Chart
Simple Project Gantt Chart
Download free Project Simple Gantt Chart template in Excel and Spreadsheet for business and client. Manage your project with simple charts and track timelines. This Simple Project Gantt Chart template contains the core functionality needed to create a simple Gantt chart easily. Each row of the worksheet represents a separate task. All you need to do is define the start date and duration of each…
View On WordPress
#excel#excel gantt#excel gantt chart#excel gantt chart template#excel gantt chart tutorial#Excel Template#Gantt Chart#gantt chart excel#gantt chart excel 2010#gantt chart excel 2013#gantt chart excel 2016#gantt chart excel template#gantt chart in excel#gantt chart template#gantt chart template in excel#gantt chart templates#gantt chart tutorial#how to make a gantt chart#how to make a gantt chart in excel#simple gantt chart excel#template
0 notes
Text
7 Ways to Build the Best Project Design
One of the project manager’s first responsibilities is to design the project. At this point, decisions are taken on how the project will be managed and governed. This article gives you knowledge on how to build the best project design.

In any program or ongoing process, the designing the project is the backbone element. Every project that moves from the development process is unique, with many different scenarios applying to it. However, they all have something in common, the Best Project Design.
Project design is so important that there is no structure for the project development process to stand on and make the project a success in the future. It is such a crucial stage in a project’s lifecycle that it identifies key elements and sets the overall tone of the project. To have a successful project, you need to understand the steps involved in project design and how to document them.
All You Need to Know to Build the Best Project DesignWhat is Project Design?
In online Project Management, Project design is the earliest step where the project and how it will run is planned. During the Project design, an outline of the project is created that includes; the organization responsible for completing it, the description of the project, goals and objectives of a project, when the project will be completed, major deliverables, success criteria, budget estimates and many more.
The project manager gives a detailed analysis of how the project will be managed. A Project design can come in various formats, such as sketches through a Project design paper, flowcharts, HTML screen designs, prototypes and more. The most common representation of Project design is presented in the form of a Gantt chart.
How to Build Best Project Design?
Regardless of your industry, there are some steps you follow during the Project design phase. These steps will help you create the best Project design document and allow all parties to work more effectively.
1. Prepare Project Vision
The most important text in your project design document is your project vision, as it defines the different entities that have to be worked on in the future. To create a project vision, you must envision the perfect environment where existing problems and needs are resolved. The information on it must be so explanatory and captivating enough for the stakeholders to understand the project’s seriousness.
2. Understand Project Goals and Objectives
The project goals highlight the problem the project is trying to solve, while the objectives show how the project will solve the problem. To have a successful project, your project design must ensure the right understanding of the stated vision and identify the problems that prevent the achievement of the vision.
3. Identify Risks
“No project plan is perfect, everything can go wrong.”
Once you know what you want to achieve with your project, you need to identify anything that can stand in the way of success. Write down any potential risk and constraints on budget, time, or resources that could impede your teams’ chances of achieving their goals, objectives and milestones.
4. Prepare Visual Aids
Now that you have documented the risks, you must consistently remind your team of your project vision, goals and objectives. You can prepare a visual aid for part or all parts of the project. Using visualization can be useful, especially when managing any project. It provides team members and stakeholders an easy, understandable snapshot of the project goals, outcomes, deliverables, products, services, and functionality.
5. Create and Ballpark Your Budget
Now, you need to include your budget in your Project design. It is important to know what budget is perfect for covering the expenses related to the elements included in the project development phase right from the start.
6. Determine Monitoring Process
You need to know what processes must be followed for the project and its element to be approved and who is responsible for the approval. Once the consent has been given, the project can successfully move on to the next stage.
7. Use Proper Design Documents or Software
It is best to use the proper documentation or software to capture all the information for your Project design. The output of your project design depends on your industry, and it can be as simple as a Gantt chart, flow chart, work chart that is carried to the Project Planning stage.
Conclusion
It is obvious that a good Project design will be a giant step towards achieving a successful project. Knowing how dependent the project’s success is on the Project design, the responsibility of project managers can be tough and demanding.
1 note
·
View note
Link
The construction project management ecosystem these days cannot thrive without a robust construction software solution. The huge amount of data that gets generated has to be analysed and churned into insights that will help stakeholders to make decisions faster. VisiLean helps the stakeholders to collect, collate and collaborate their workflows based on this data.
#construction#construction industry#construction Software#Construction Site#constructioncompanies#construction management software#cost management#construction solutions#construction project management#gantt chart#Construction Workflow#Infrastructure Management#lean construction#bim construction#resource management#construction design#building management systems#project scheduling#infrastructure development
0 notes
Text
Azula: Punctuality is the highest of virtues, this is why I pay such attention to the various schedules my staff create for me.
Sokka: Y'know, I once invented a chart for tracking the progress of complex projects. It was basically a dozen interconnected schedules stacked on top of each other.
Azula, accidentally speaking out loud: Oh no, he's hot!
#atla#azula#sokka#sokkla#azula/sokka#zuko+the gaang are just listening#going from super bored to horrified+mystified instantly#mai's rolling her eyes#and ty lee is laughing hysterically#sokka's schedule for the gaang pre invasion is basically a gantt chart
110 notes
·
View notes
Last Seen Blogs

unitestcalibration
Unitest Calibration

vanillagorillatortilla-blog
Untitled

thetempleofnyx
choso’s space buns

companiesform
CompaniesForm

inorganicrociel
Rociel's World