#datavizsociety
Text
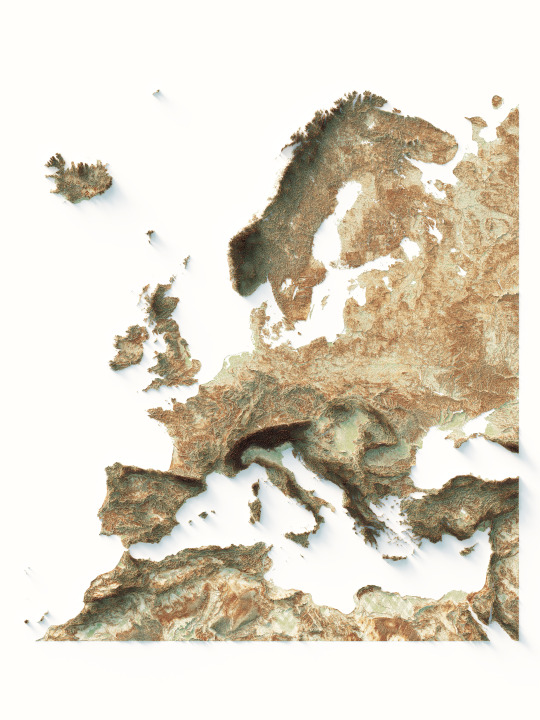

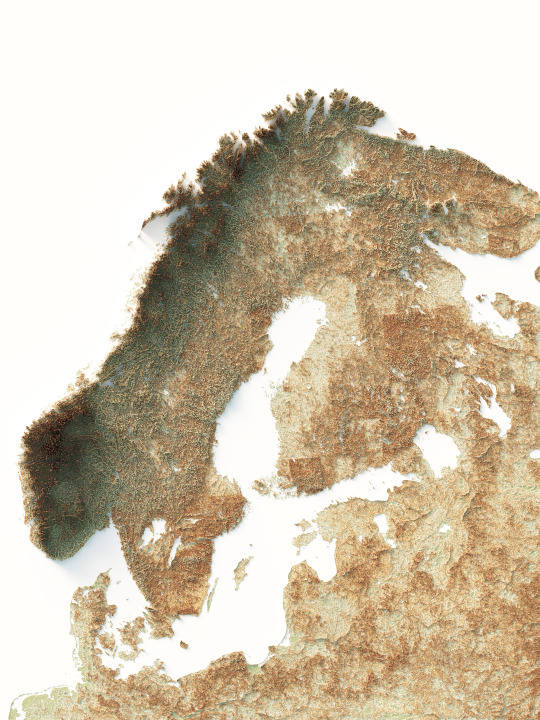
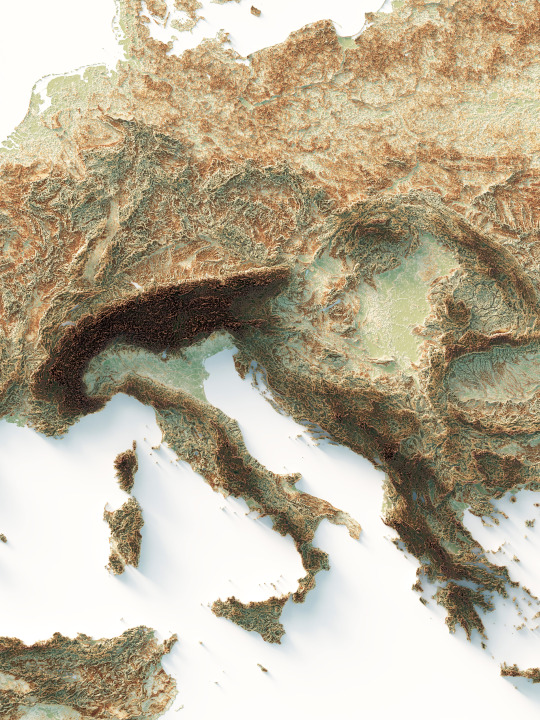
Shaded relief map of Europe.
We use geo palette with hypsometric coloration.
If you like our work, want to see our daily updates (or want to say hello to our studio), consider to follow our Instagram or Twitter account. Otherwise if are interested in our prints or have a custom request check our shop.
#elevationmap#elevationtint#europe#maps#mapstagram#topographicmaps#mapsarecool#europemap#green#traveler#cartography#europa#geography#geoart#european#datavizsociety#europe trip#geographic#geografia
2 notes
·
View notes
Photo
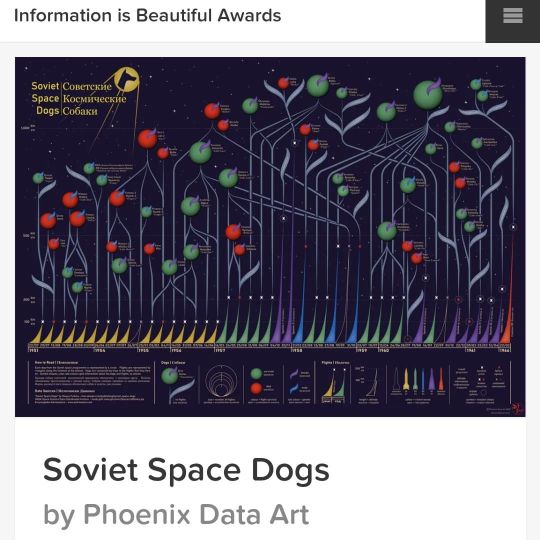
The Information Is Beautiful Awards longlist has been announced, and I'm really pleased to say that my #sovietspacedogs #datavisualisation is on it! 🔥 The IIB awards are organised by the #datavizsociety and the awards showcase contains a vast array of really fascinating data visualisations covering a wide range of topics, so it's well worth checking out at informationisbeautifulawards.com/showcase. Congrats to everyone whose work has been longlisted! You can find the Soviet Space Dogs at informationisbeautifulawards.com/showcase/5324-soviet-space-dogs The shortlist will be announced by the end of October, and winners will be announced at the end of November. Best of luck to everyone! https://www.instagram.com/p/CjSXQwBjGPC/?igshid=NGJjMDIxMWI=
0 notes
Text

According to the U.S. Census Bureau, Hispanic Heritage Month encompasses 21 Latin American nations. Among these flags, the primary colors of red, white, and blue collectively account for 80% of the color composition.
Notably, 66% of Argentina, El Salvador, Guatemala, Honduras, and Nicaragua's flags are predominantly blue, while 66% of Peru's flag is characterized by the color red.
Treemap inspired by flagstories.co, a project by Ferdio.
#treemap #tableau #python #colors #color #hues #hue #hispanic #latin #latinamerican #hispanicheritagemonth #flag #flags #latino #latina #southamerica #centralamerica #carribean #datavisualization #dataviz #visualization #graphicdesign #datavizsociety #data #viz #dataanalytics #charts #graphs #infographic #datavisualisation #peru #bolivia #spain #mexico #puertorico #colombia #venezuela #elsalvador #chile #argentina #panama #guatemala #honduras #dominicanrepublic #cuba #costarica #ecuador #equatorialguinea #nicaragua #paraguay #uruguay #tableau #pandas #inforgraphics #analytics #pythonprogramming #pythoncode
0 notes
Photo

#BlackHistoryMonth - Stats Sunday Special Edition ✊🏾: Black Banks As the average level of educational attainment increases for Black Americans so should Black wealth, right? Not exactly. There is a lot of talk about the “power of the Black dollar” and the “increase in Black buying power”, however, what’s not discussed as often: the massive “leakage” of the Black dollar outside the Black community. Studies show that a dollar circulates in the Black community for only 6 hours approximately and roughly 2 cents of every dollar a Black American spends in this country goes to black owned businesses. One way to reinvest in the Black community is through black banking, so we looked at a few Black MDI’s (minority depository institutions) federally insured with 51 percent or more of the voting stock owned by Black Americans. We mapped total assets and did a quick comparison to how they stack up against other banking institutions. Do you bank Black? 👀 #statssunday #BlackFacts #BlackByTheNumbers #202creates #acreativedc #datavizsociety #blackexcellence #blackwealth #blackcommunity #blackwallstreet #blackhistorymonth #blackwealthrenaissance #blackbanksmatter #blackbankchallenge #blackownedbanks #bankblack https://www.instagram.com/p/B86HLbqB_CN/?igshid=a2tkersn7ci4
#blackhistorymonth#statssunday#blackfacts#blackbythenumbers#202creates#acreativedc#datavizsociety#blackexcellence#blackwealth#blackcommunity#blackwallstreet#blackwealthrenaissance#blackbanksmatter#blackbankchallenge#blackownedbanks#bankblack
0 notes
Text
instagram
I made this video a couple of days ago for the UK, a lot of people have contacted me to make this video for the United States. Which country do you want to see next?
Have you ever wondered what the influence of a crisis is on the government debt of a country? In this video we explore how #WWI, #WWII, and the #coronaviruspandemic influenced the government debt of the USA as a percentage of GDP from 1900 to 2021.
In the history there have been plenty of crises. However not all of them had a similar influence on government debt. For instance, the Asian and Latin American debt crisis didn’t have any influence on government debt.
#USA #covid19 #datavizsociety #data #datavisualization #datavisualizations #dataviz #infographic #graphicdesign #editorial #visualdesign #design #infographie #datajournalism #digitaldesign #datavis #diagram #datajournalism #datavisualization #charts #graphs #stats #statistics
Tools: python, pandas, tkinter
Data source: IMF until 2015 (https://data.imf.org/?sk=806ED027-520D-497F-9052-63EC199F5E63) and trading economics for more recent years (https://tradingeconomics.com/united-states/government-debt-to-gdp)
1 note
·
View note
Text
Stock Market Chart – Landscapes
Aktienkurse von Börsenunternehmen als Vorlage für Zeichnungen von Landschaften. Stoxart bietet auf Insta jede Menge davon.
22.08.2020
Ok, ein paar mehr könnten es schon sein, aber der Account hat durchaus potenzial. Auf jeden fall volle Geek-Punktzahl für die Idee. 😺
Sieh dir diesen Beitrag auf Instagram an
SPY // 1 MONTH SNAPSHOT #stockmarket #stocks #robinhood #wallstreet #datavisualization #art #design #stoxart #stockarts #spystock #infographic #charts #dataisbeautiful #datavizsociety
Ein Beitrag geteilt von Gladys (@stoxart) am Jul 31, 2020 um 1:12 PDT
Sieh dir diesen Beitrag auf Instagram an
PRPL// JAN 3 – JULY 3 2020 #stockmarket #stocks #robinhood #wallstreet #datavisualization #art #design #stoxart #stockarts #xom #purpleMattress #stockcharts #stockmarket #design #prpl
Ein Beitrag geteilt von Gladys (@stoxart) am Aug 4, 2020 um 2:28 PDT
Sieh dir diesen Beitrag auf Instagram an
AAPL// 1 DAY SNAPSHOT @apple #stockmarket #stocks #robinhood #wallstreet #datavisualization #art #design #stoxart #stockarts #spystock #mac #apple #robinhood #stevejobs #infographic #charts #dataisbeautiful
Ein Beitrag geteilt von Gladys (@stoxart) am Jul 31, 2020 um 5:06 PDT
(via ls)
*** Belong to the cool Kids! It’s Easy: Follow this Blog on Social Media like Twitter, Snapchat or Instagram for more Content of from Zwentner.com & about my Life ***
The post Stock Market Chart - Landscapes first appeared on ZWENTNER.com.
from ZWENTNER.com https://ift.tt/3hmiUh4
via IFTTT
0 notes
Photo

I will be a copy paste and data entry assistant Your Satisfaction is my pleasure. Hi, welcome to my gig, I can help you with my task are givien below: * Website’s to word document (example: I will copy-paste articles from website's to word document, Product image and descriptions from website to word document, etc.) Data extraction from website to Excel, Word, (#Let's discuss more about your tasks, please message me #WHY YOU HAVE CHOSEN ME? * Your order will deliver within 24 hours * 100% Satisfaction Guaranteed * 100% Money Back * 100% Quality Guaranteed #dataentry #dataentryjobs #dataextraction #webresearch #webdataresearch #the #fiverr #data #datascience @datavizsociety @webresearchexpert @the.house.of.designers @iqrarulhassan @usa_taekwondo #free #billgates @upword_ @virtualself @virtual_assistant78 #excel #exceldata #datamining #dataanalytics #datacollection #emailextractor #emailscraping #datascraping #parsehub #webscraping #service #homejobs (at San Francisco, California, U.S.A) https://www.instagram.com/p/B-3200tFXTg/?igshid=qrc573kk8r6g
#let#why#dataentry#dataentryjobs#dataextraction#webresearch#webdataresearch#the#fiverr#data#datascience#free#billgates#excel#exceldata#datamining#dataanalytics#datacollection#emailextractor#emailscraping#datascraping#parsehub#webscraping#service#homejobs
0 notes
Photo

#paranormal #distribution @drpriyapsych @datavizsociety https://www.instagram.com/p/B7NWKuoicjW/?igshid=9wudqhy5z931
0 notes
Photo
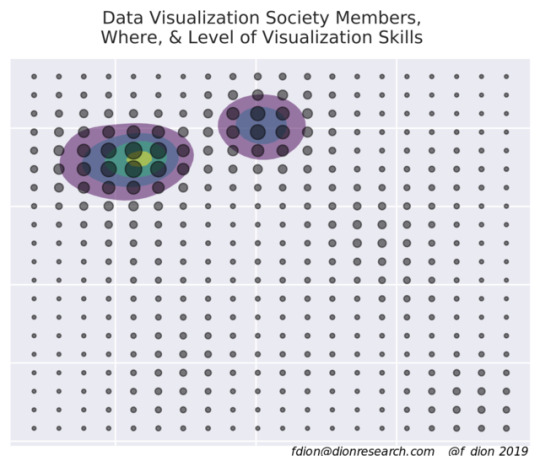
Map without a basemap: #datavizsociety @DataVizSociety members. Density gives us North America and Europe, with visual cues to South America, Africa, Asia & Oceania (mostly Australia). High visualization skills (viridis scale) concentrated on US east coast, mostly due to NYC.
0 notes
Text
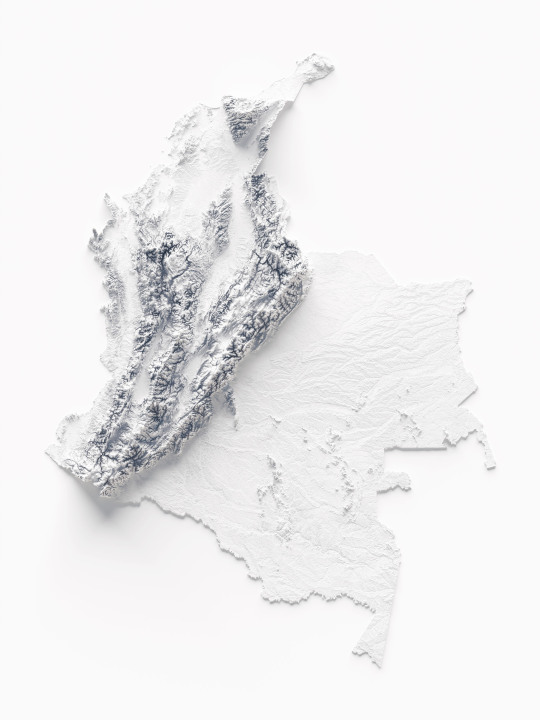

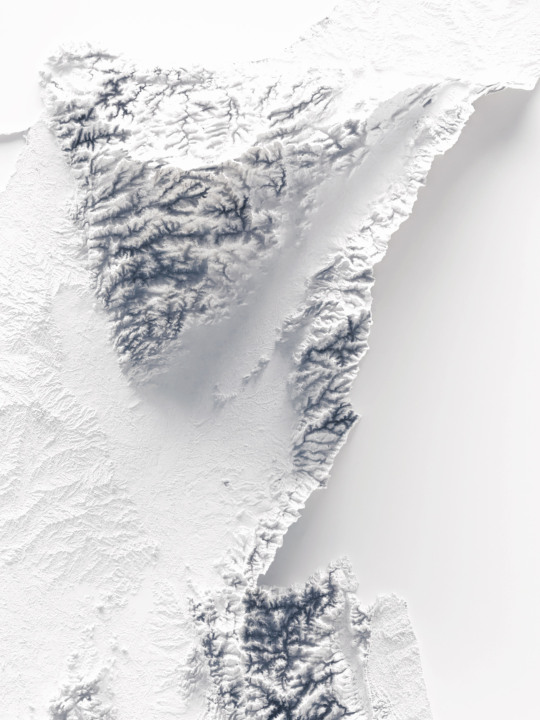
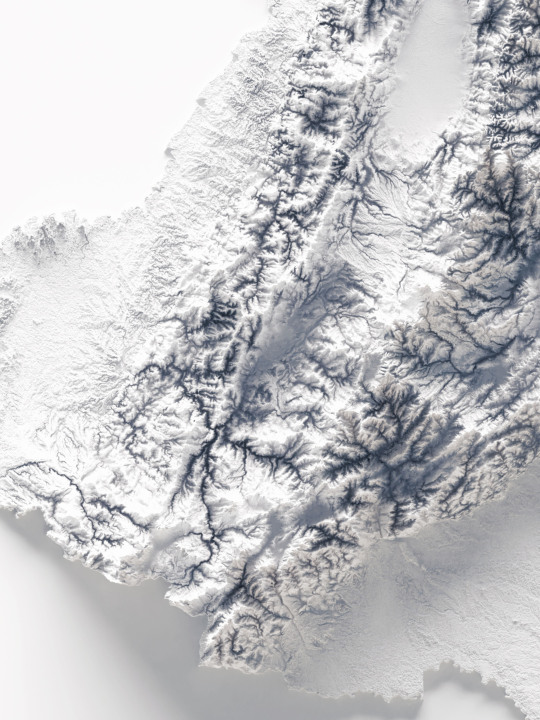
Not a really hypso, but a shaded relief of course!
This elevation map shows the soil of Colombia on minimal white tint.
If you like our work, want to see our daily updates (or want to say hello to our studio), consider to follow our Instagram or Twitter account. Otherwise if are interested in our prints or have a custom request check our shop.
#colombia#colombia🇨🇴#southamerica#southamericatravel#maps#mapstagram#geography#naturegeography#wildgeography#datavizsociety#datavizualization#datavizart#cartographyart#cartography#shadedreliefmap#blender3d#blenderart#blendercycles#QGIS#qgisitalia#vizart
2 notes
·
View notes
Photo

I'm excited to have had an article published today in Nightingale, the @datavizsociety online magazine... "It was by accident and during a crossroads in @Phoenix's life, when she found dataviz. A practical person, good at DIY, with creative problem-solving skills, read about how data visualization scratched an itch for more artistic expressions for that creativity" https://nightingaledvs.com/discovering-data-visualisation-how-i-discovered-and-fell-in-love-with-data-visualisation-art/ #datavizualisation #datavisualisation #datavis #dataviz #informationisbeautiful https://www.instagram.com/p/CkbZNhkD9K7/?igshid=NGJjMDIxMWI=
0 notes
Text
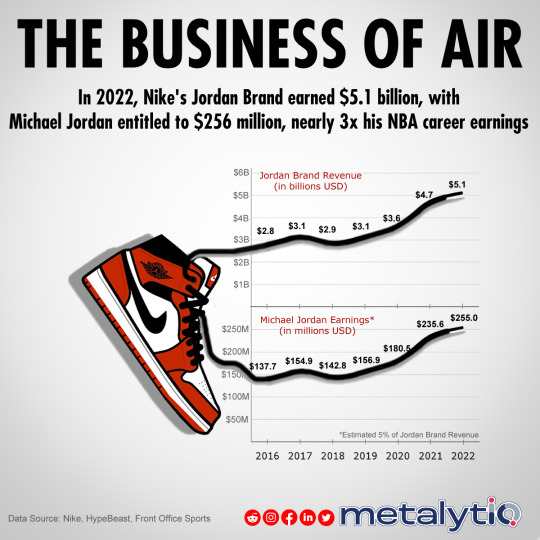
The Jordan Brand is a global phenomenon that shows no signs of slowing down, reaching $5.1 billion in 2022. Michael Jordan reportedly earns 5% of the brand's revenue, which means he earned $256 million in 2022 alone. This is nearly three times what he earned during his 15-year NBA career.
The Jordan Brand was created in 1984 when Nike signed Michael Jordan to a shoe deal. Jordan was a rookie star in the NBA, and Nike saw the potential to create a successful brand around him. The first Air Jordan shoes were released in 1985, and they were an instant success. The success of the Jordan Brand is due in part to Michael Jordan's iconic career as one of the greatest, if not the greatest player of all time.
The story of how Nike signed Michael Jordan and started the iconic brand is now a feature film, directed by Ben Affleck, who also plays Nike co-founder Phil Knight. The film, titled "AIR," also stars Matt Damon as Nike representative Sonny Vaccaro. It will premiere globally in theaters today, April 5.
Follow us for more @metalytiq
#JordanBrand #AirJordan #AirJordan1 #AirJordanShoes #Nike #Air #MichaelJordan #jordanchicago #jordan #philknight #sonnyvaccaro #benaffleck #mattdamon #airmovie #amazonstudios #sportsbusiness #jordanshoes #sneakernews #sneakers #kicks #datavisualization #infographic #dataviz #visualization #datavizsociety #visualdesign #analytics #data #chart #graph #charts #graphs #sportsbiz #sportsdata #visualisation #basketball #sports #NBA #basketballshoes #nikeshoes #ChicagoBulls #Lakers #violadavis #stockx #jordanresale #sportsmarketing #brand #dataanalytics #dataart #datajournalism #datagraphic #dataviz #viz #statistics #finance #stats #signatureshoe #sportsfinance #marketing #branding #graphicdesign #datascience #revenue #sportsrevenue #jumpman #infographics
1 note
·
View note
Photo

Food waste not only exacerbates food insecurity but also burdens waste management systems. If food waste was a country, it would be third biggest source of greenhouse emissions after USA and China. By @the.infographia In today’s visualisation we compare per capita food waste across some countries. An interesting aspect pointed out in the report is that there is no real correlation between income level and food waste of a given country. Share your thoughts on the trends below! Source: Food Waste Index 2021, UNEP (Link in Bio) #foodwaste #wasteoffood #percapita #throwawayfood #foodinsecurity #wastemanagement #foodwastemanagement #greenhouseemissions #foodemissions #foodstagram #food #thoughtforfood #instafoodgram #foodwasteindex #unep #greece🇬🇷#russia #india #kenya🇰🇪 #datavisualization #dataviz #datavizsociety #dataisbeautiful #infographia . Love #DataViz share your work by adding #DataVizSociety to your post. Looking forward to seeing your work! .⠀ .⠀ #datavisualization⠀ #data https://www.instagram.com/p/CROo_9ZDDHM/?utm_medium=tumblr
#foodwaste#wasteoffood#percapita#throwawayfood#foodinsecurity#wastemanagement#foodwastemanagement#greenhouseemissions#foodemissions#foodstagram#food#thoughtforfood#instafoodgram#foodwasteindex#unep#greece🇬🇷#russia#india#kenya🇰🇪#datavisualization#dataviz#datavizsociety#dataisbeautiful#infographia#data
0 notes
Text
The latest The Public speaking Daily! https://t.co/zajtePlxkj Thanks to @DataVizSociety @wandaology @DailyEvergreen #datavisualization
The latest The Public speaking Daily! https://t.co/zajtePlxkj Thanks to @DataVizSociety @wandaology @DailyEvergreen #datavisualization
— World Speech Day (@Worldspeechday) August 25, 2020
via Twitter https://twitter.com/Worldspeechday
August 25, 2020 at 06:20PM
0 notes
Text
RT @LaughlinPaul: Steal like a Data Visualiser - fun with autonomous agents, recreating a particle orbit in Clojure & improving animation skills in the process - another fun Data Viz story shared on Nightingale @DataVizSociety: https://t.co/RvBYbN8Mp1 #DataViz #Desifn #Animation #Agents #Clojure https://t.co/higr13TuMe
Steal like a Data Visualiser - fun with autonomous agents, recreating a particle orbit in Clojure & improving animation skills in the process - another fun Data Viz story shared on Nightingale @DataVizSociety: https://t.co/RvBYbN8Mp1 #DataViz #Desifn #Animation #Agents #Clojure pic.twitter.com/higr13TuMe
— Paul Laughlin (@LaughlinPaul) July 6, 2020
from Twitter https://twitter.com/ivanpierre
July 06, 2020 at 07:10PM
via IFTTT
0 notes
Text
Tweeted
Want to learn how to use data viz to “see” disaster & climate risk, all while helping people make better decisions?Join @GFDRR labs, @Mapbox & @DataVizSociety in a disaster data & map design challenge, with the purpose of helping people understand & communicate disaster risk. pic.twitter.com/sbLP8j1DHt
— Sunayana Sen (@sunayanasen) May 20, 2019
0 notes
Last Seen Blogs

witchesbrewzine
Stir the Pot . . .

greenie-lib-blog
Greenie's Library

gumsnail682
Certified Simp

amepelalua-blog
Wanderlust

targetssb-blog
SSB Institute in Chandigarh