#datavisualization
Text
I finally had some free time due to ✨carnival✨ and deployed the Miss Fisher visualization site that I had only posted screenshots of so you guys can play around with them. I really enjoy seeing them in motion and I hope that you do too! 😊
Some tips of how to use the site:
On the left, select the category of visualizations that you would like to see (the home page is pretty useless as of now hehe)
The legend of each visualization also serves as a filter, so if you click on the box that shows the color of each item you can deselect it from the visualization so that it's easier to see other information inside the graph.
Please open on desktop for a better experience!
There are some new visualizations there that I never posted before, so please check it out! I would love your feedback!
#mfmm#phryne fisher#jack robinson#phrack#miss fisher's murder mysteries#miss fishers murder mysteries#dot williams#hugh collins#datavisualization#data visualization#graphs#angular#typescript
47 notes
·
View notes
Video
after a few hours of coding a many hours of rendering I got something cool in kerbal space program.
ksp has an rpc mod (krpc) which lets you connect to a craft to build your own autopilot and other things. I found a way to give unique id’s to engines, letting me build an array and display images.
First bad apple visualization i’ve made. Suprised I haven’t made one earlier. There’s a good change I make a new one again soon if I can figure out another unique visualizer.
175 notes
·
View notes
Text

Döntőbe jutott a világ legfontosabb információdizájn-versenyén, az Information is Beautiful Awardson az "És megremeg a Föld" című interaktív munkánk a "Humanitarian" kategóriában. A döntőben többek között a Reuters, az USA Today, a Texty.org, a Világbank, a Voilá és a Graphicacy dizájnstúdió munkáival versenyzünk az arany, az ezüst és bronz elismerésért.
https://atlo.team/wp-content/uploads/2023/02/foldrengesatlasz.html
https://www.informationisbeautifulawards.com/showcase?acategory=humanitarian&action=index&award=2023&controller=showcase&page=1&pcategory=short-list&type=awards
53 notes
·
View notes
Text

#datamosh#glitch#glitchart#database#databending#glitchartistscollective#digitalart#art#rb#pixelsorting#glitchartist#datamoshing#abstractart#dataanalytics#databasepromo#databasesupplier#databasetrusted#databases#databaseasli#databasemurah#glitchaesthetic#data#dataviz#datacenter#datascientist#datamining#datavisualization#datascience#datarecovery#glitched
10 notes
·
View notes
Text
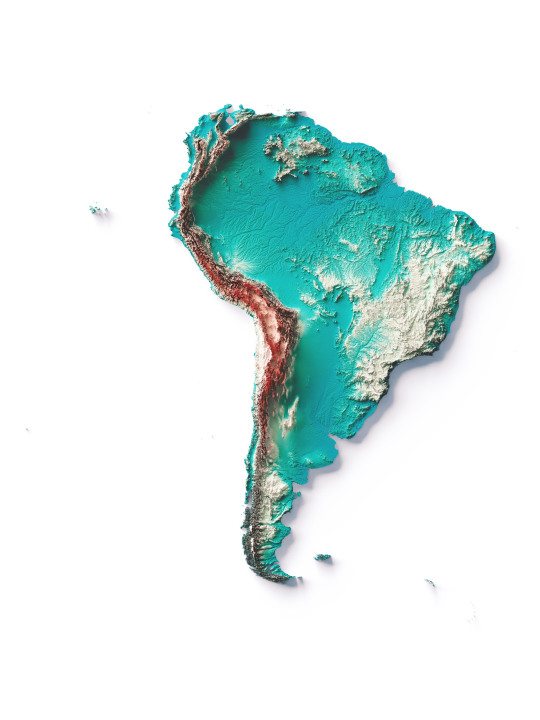
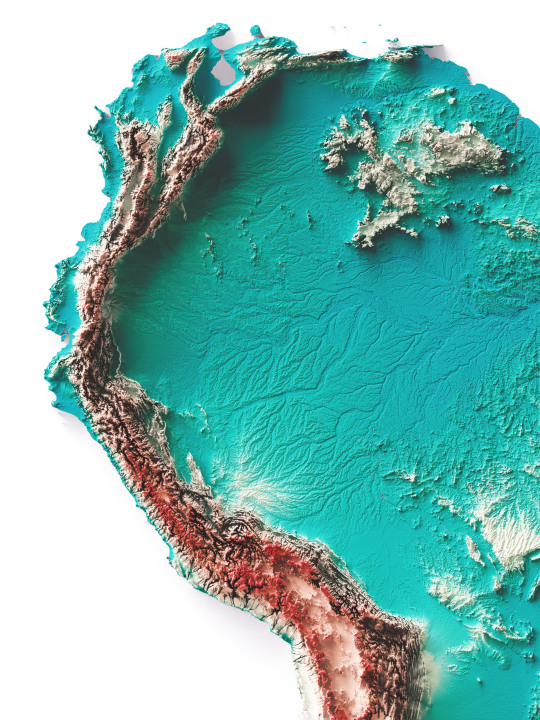

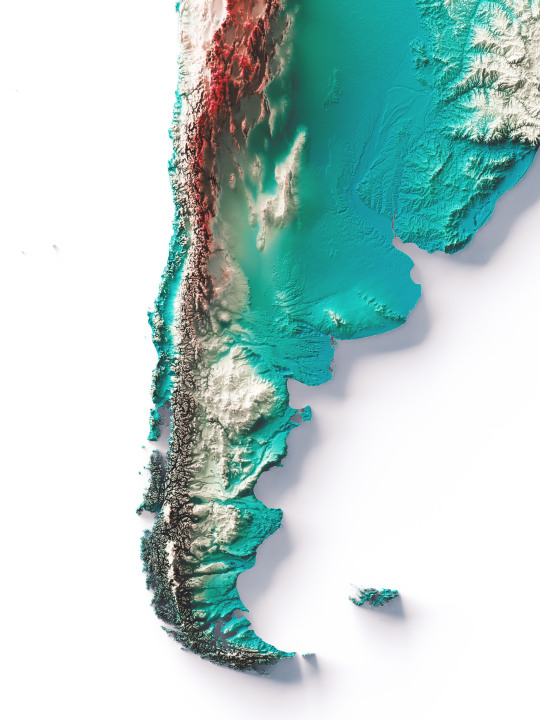
South America, elevation map on Spectral tint.
We have created four colour variants for this continent and would like this combination to become standard.
The red area shows the highest mountains, the Cordillera de los Andes, while the plains are indicated with the colour petrol blue.
If you like our work, want to see our daily updates (or want to say hello to our studio), consider to follow our Instagram or Twitter account. Otherwise if are interested in our prints or have a custom request check our shop.
#mapporn#dataviz#datavisualization#mapart#b3d#blender#qgis#cartography#maps#geography#reliefmaps#reliefmap#3dmapping#mapping#mapartwork#southamerica#southamericatrip#southamericatravel#brazil#braziltravel#argentina#argentinatravel#braziltrip#chile#chiletravel#chiletrip#argentinacampeon#perutrvel#uruguay🇺🇾
97 notes
·
View notes
Photo


...sorry
#yes#the last one DOES involve two different people#kh sora#kh roxas#kh xion#kh vanitas#datavisualization#kh recoded
90 notes
·
View notes
Text
Best Data Analysis Tools for 2024

If you’re aspiring to become a skilled data analyst, these tools offer excellent support and guidance. Before diving into the list, let’s understand what a data analyst does.
A data analyst specializes in examining, interpreting, and deriving valuable insights from data. They use statistical and analytical techniques to scrutinize large datasets, identifying patterns and trends.
Let’s explore some of the best Data Analysis Tools that are essential for data analysts in 2024. These tools empower professionals to extract valuable insights from data, enhance decision-making, and drive business success.
#online courses#kochivacourses#technology#study#analytics#software#dataanalysis#data#datavisualization#datascientist
3 notes
·
View notes
Text
Unleashing the Power of Data Analytics & Reporting: A Guide to Enhanced Decision-Making
In today's fast-paced business landscape, data reigns supreme. Every click, purchase, and interaction generate a wealth of valuable information waiting to be analysed and utilized. The ability to harness this data effectively through analytics and reporting can make all the difference between thriving and merely surviving in the competitive marketplace.
The Role of Data Analytics & Reporting
Data analytics involves examining raw data to draw conclusions and insights, while reporting involves presenting these findings in a structured format to facilitate decision-making. Together, they provide businesses with the necessary tools to understand customer behaviour, optimize processes, and drive strategic initiatives.
Importance of Data Analytics:
1. Informed Decision-Making: By analysing past trends and patterns, businesses can make data-driven decisions rather than relying on intuition or guesswork.
2. Competitive Advantage: Companies that leverage data analytics gain a competitive edge by identifying opportunities for growth, improving efficiency, and mitigating risks.
3. Enhanced Customer Experience: Understanding customer preferences and behavior enables personalized marketing efforts, leading to higher customer satisfaction and loyalty.
Significance of Reporting:
1. Communication of Insights: Reports serve as a means to communicate key findings, trends, and metrics to stakeholders, facilitating understanding and alignment across the organization.
2. Performance Tracking: Regular reporting allows businesses to monitor performance against goals and objectives, enabling timely adjustments and course corrections.
3. Compliance and Accountability: Reporting plays a crucial role in meeting regulatory requirements, ensuring transparency, and holding individuals and departments accountable for their actions.
Leveraging Outsourcingwise Consulting's Training for Data Analytics & Reporting
In the realm of data analytics and reporting, staying abreast of the latest tools, techniques, and best practices is essential for success. This is where Outsourcingwise Consulting's training programs come into play, offering comprehensive courses designed to equip professionals with the skills needed to excel in this field.
Cutting-Edge Curriculum:
Outsourcingwise Consulting's training curriculum covers a wide range of topics, including:
- Data Collection and Preparation: Understanding data sources, cleaning, and transforming raw data into usable formats.
- Statistical Analysis: Applying statistical methods to uncover patterns, correlations, and trends within the data.
- Data Visualization: Communicating insights effectively through charts, graphs, and dashboards.
- Reporting Tools: Utilizing industry-leading reporting tools such as Tableau, Power BI, and Google Data Studio to create compelling reports.
- Advanced Analytics Techniques: Delving into predictive analytics, machine learning, and AI for more sophisticated analysis and forecasting.
Hands-On Learning:
One of the key features of Outsourcingwise Consulting's training programs is their emphasis on practical, hands-on learning. Participants could work on real-world projects, applying their newly acquired skills to solve actual business problems. This experiential learning approach ensures that participants are not just theory-smart but also equipped with the practical know-how to tackle challenges in the workplace.
Expert Guidance:
The trainers at Outsourcingwise Consulting are seasoned professionals with extensive experience in the field of data analytics and reporting. They bring their wealth of knowledge and expertise to the training sessions, providing valuable insights, tips, and guidance to participants. Whether you're a beginner looking to build a solid foundation or an experienced professional seeking to deepen your skills, the trainers at Outsourcingwise Consulting are committed to helping you achieve your goals.
Career Advancement Opportunities:
In today's job market, proficiency in data analytics and reporting is in high demand across industries. By completing Outsourcingwise Consulting's training programs, participants not only enhance their skill set but also position themselves for career advancement opportunities. Whether it's securing a promotion within their current organization or transitioning to a new role in a different industry, the skills acquired through Outsourcingwise Consulting's training can open doors to exciting career prospects.
Conclusion
In conclusion, data analytics and reporting play a pivotal role in driving informed decision-making, enhancing organizational performance, and gaining a competitive edge in the marketplace. By leveraging Outsourcingwise Consulting's training programs, professionals can acquire the skills and knowledge needed to excel in this dynamic and rapidly evolving field. Whether you're a business leader seeking to unlock the full potential of your data or an aspiring data analyst looking to kick-start your career, Outsourcingwise Consulting offers the expertise and resources to help you succeed. Embrace the power of data analytics and reporting today, and chart a course towards a brighter, more data-driven future.
#DataAnalyticsTraining#AnalyticsEducation#DataTraining#DataScienceEducation#AnalyticsWorkshops#DataLearning#DataSkills#AnalyticsCertification#DataProfessionals#DataDrivenDecisions#AnalyticsConsulting#DataInsights#DataStrategy#BigDataTraining#DataAnalyticsBootcamp#DataVisualization#MachineLearningTraining#BusinessAnalytics#DataProficiency#AnalyticsTutorials
2 notes
·
View notes
Text
Best Graph Making Tools

Follow @everythingaboutbiotech for informative and useful stuff ✨
#DataViz#DataVisualization#Graphs#Charts#DataGraphs#GraphDesign#Infographics#DataAnalytics#ChartTypes#BarChart#PieChart#LineGraph#GraphSoftware#ExcelCharts#TableauViz#DataStorytelling#FlowChart#OrgChart#Data#Analytics#Numbers#Statistics#DataScience#BigData#Dashboard
6 notes
·
View notes
Text
Certified Data Scientist: Mastering the Journey with IABAC
By becoming a certified data scientist, you open yourself up to a world of possibilities in the ever-changing world of technology. The International Association of Business Analytics Certifications (IABAC) plays a crucial role in this field by providing a recognized platform for professionals to validate their skills.
At the heart of data science is extracting valuable insights from huge amounts of data. Being certified by IABAC not only showcases your proficiency in handling complex data but also demonstrates your dedication to excellence. The certification process involves rigorous training and evaluation, ensuring that you are well-prepared to tackle practical challenges.
The Certified Business Analytics credential is a recognized achievement that covers the complexities of both data science and business analytics. This certification indicates that the holder has a solid grasp of how to use data to drive business growth. It signifies not only technical expertise but also the capability to match data strategies with overall business goals.
The IABAC's Business Analytics Certification is an impressive achievement that highlights the importance of using analytics strategically to guide business choices. Individuals who possess this certification have a unique blend of technical skills and business knowledge, making them extremely valuable to organizations seeking data-oriented solutions.
The journey towards certification starts by building a strong foundation in data science principles. Aspiring candidates explore various topics like statistical analysis, machine learning, and data visualization. What makes IABAC stand out is its focus on practical application. The certification process includes hands-on projects, allowing individuals to apply their knowledge in real-world scenarios.
Certified data scientists who complete their training gain a prestigious credential and become valued members of a global community of experts. At IABAC.org, we offer networking opportunities that allow professionals to connect, collaborate, and stay updated on the latest industry trends.
#DataScience#IABACCertification#AnalyticsCertification#DataInsights#MachineLearning#CertifiedDataScientist#TechCertifications#DataAnalytics#BigDataSkills#IABAC.org#DigitalSkills#TechProfessionals#DataVisualization#BusinessAnalytics#DataMastery#DataDrivenDecisions#ProfessionalDevelopment#TechCommunity#CareerGrowth#IABACCommunity#DataProfessionals#LearnDataScience#BusinessAnalyticsCertifications#CertifiedBusinessAnalytics
3 notes
·
View notes
Link
The TechGeecs Power BI Training course in Chandigarh is planned to do is provide students with the skills and knowledge required to successfully use the Power BI toolset. From data visualisation and analysis to information security and management, the course covers a wide range of topics. Participants will discover how to use Power BI to generate amazing visualisations, conduct complex data analysis, and manage and defend their data.
#data#dataanalytics#dataanalyst#datacleaning#dataanalystjobs#businessanalytics#businessanalyst#powerbi#powerbideveloper#powerbidesktop#ai#machinelearning#datavisualization#pythonprogramming#python#business#visualization#techgeecs#chandigarh#panchkula#mohali
9 notes
·
View notes
Text
instagram
#coding#code#machinelearning#programming#datascience#python#programmer#artificialintelligence#deeplearning#ai#codinglife#data#tech#dl#ml#technology#pythoncode#learning#elearning#datavisualization#Instagram
10 notes
·
View notes
Text
What is business intelligence all about?

The article discusses the importance of business intelligence (BI) solutions in helping companies transform data into actionable insights. It highlights the challenges faced by companies in managing scattered data and the need for a BI solution to answer key questions about the current state of the business and make informed decisions. The article emphasizes the role of BI in tracking financial and operational metrics, gaining critical business insights, and monitoring employee performance. It also mentions that BI can use structured and unstructured data for strategic and operational decision-making. The article mentions some popular self-service BI tools available in the market and introduces Assisted BI Solutions like BICXO, which offer techno-functional expertise to implement a robust BI solution without the need for additional hiring. to learn more visit: https://bicxo.co/blog/what-is-business-intelligence-all-about/
#businessReportingSoftware#businessintelligence#bisolution#bestbitool#datavisualization#dataanalysis#bestbi
2 notes
·
View notes
Text

Budapest Open Data Atlasza
31 notes
·
View notes
Text

I think that showing process is an important element of art and design. It’s how we learn that things are made. This is a progressive image of how I created a painting of Hall of Famer Ernie Banks, with his home run totals in the “bullseye” figure compared to other notables of his era. It’s the biggest canvas that I’ve painted. (Acrylic on canvas).
7 notes
·
View notes
Text


Hydrological map of India. The original map was published in 1973 and with a deep restoration it gains the color and lost some of his years.
If you like our work, want to see our daily updates (or want to say hello to our studio), consider to follow our Instagram or Twitter account. Otherwise if are interested in our prints or have a custom request check our shop.
#datavisualization#reliefmap#geography#mapporn#cartography#mapping#gis#blender3d#dataviz#india#indiamap#nepal#Bangladesh#physicalmap#physicalmapofindia#Everest#VintageMap#vintagemaps#vizart
2 notes
·
View notes
Last Seen Blogs

acesprayfoaminsulations
Home Service News

domarbag
The Bag's is my life!


gena-gena
Gena

george-muro
Jorge Muro