#ocean drainage basins
Text
Hey All,
I've been away for some time, as we've been working really hard on something quite exciting:
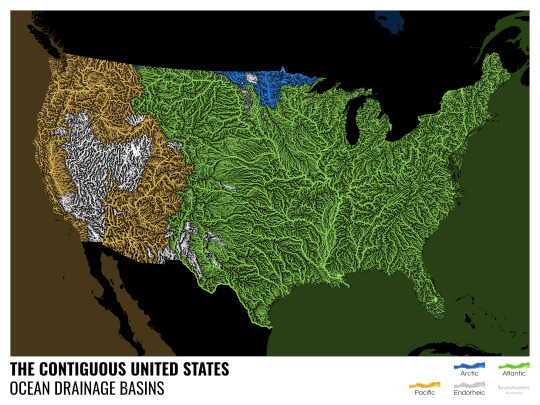
let me present to you the world's first ever global ocean drainage basin map that shows all permanent and temporary water flows on the planet.

This is quite big news, as far as I know this has never been done before. There are hundreds of hours of work in it (with the data + manual work as well) and it's quite a relief that they are all finished now.
But what is an ocean drainage basin map, I hear most of you asking? A couple of years ago I tried to find a map that shows which ocean does each of the world's rivers end up in. I was a bit surprised to see there is no map like that, so I just decided I'll make it myself - as usual :) Well, after realizing all the technical difficulties, I wasn't so surprised any more that it didn't exist. So yeah, it was quite a challenge but I am very happy with the result.
In addition to the global map I've created a set of 43 maps for different countries, states and continents, four versions for each: maps with white and black background, and a version for both with coloured oceans (aka polygons). Here's the global map with polygons:
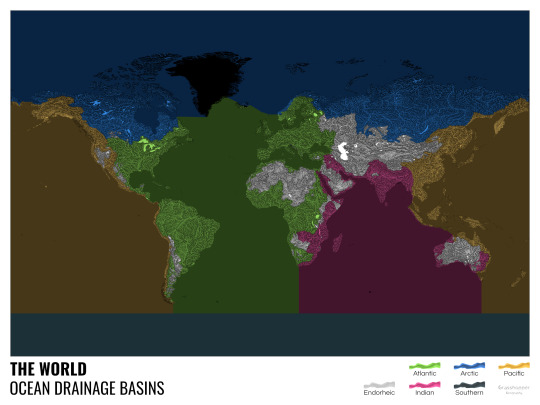
I know from experience that maps can be great conversation starters, and I aim to make maps that are visually striking and can effectively deliver a message. With these ocean drainage basin maps the most important part was to make them easily understandable, so after you have seen one, the others all become effortless to interpret as well. Let me know how I did, I really appreciate any and all kinds of feedback.
Here are a few more from the set, I hope you too learn something new from them. I certainly did, and I am a geographer.
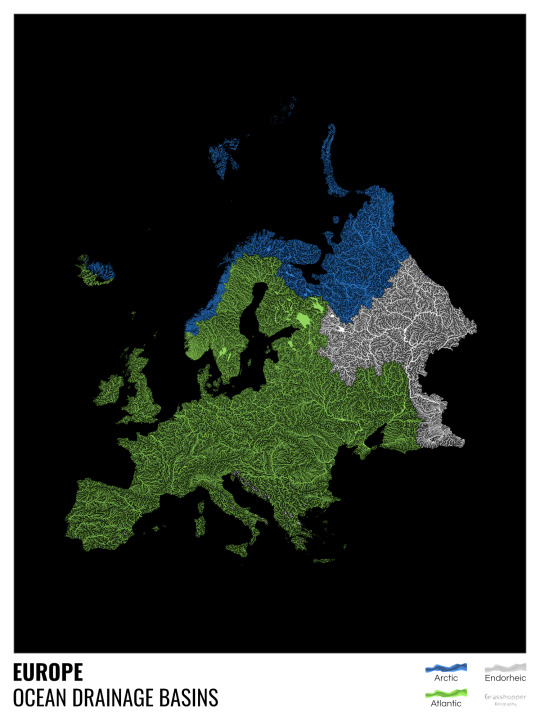
The greatest surprise with Europe is that its biggest river is all grey, as the Volga flows into the Caspian sea, therefore its basin counts as endorheic.
An endorheic basin is one which never reaches the ocean, mostly because it dries out in desert areas or ends up in lakes with no outflow. The biggest endorheic basin is the Caspian’s, but the area of the Great Basin in the US is also a good example of endorheic basins.
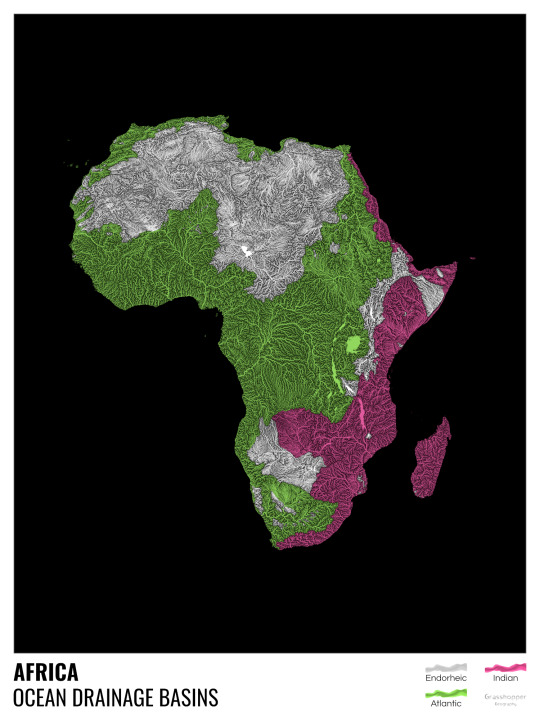
I love how the green of the Atlantic Ocean tangles together in the middle.
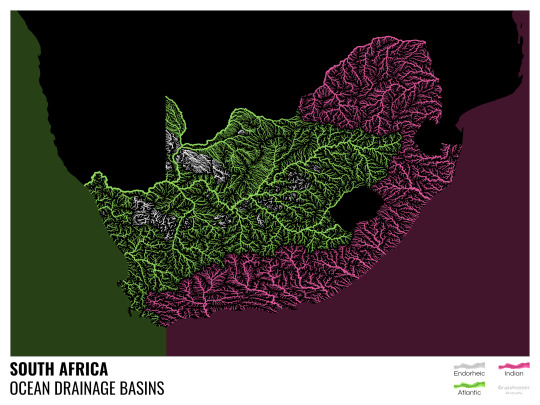
No, the dividing line is not at Cape Town, unfortunately.
I know these two colours weren’t the best choice for colourblind people and I sincerely apologize for that. I’ve been planning to make colourblind-friendly versions of my maps for ages now – still not sure when I get there, but I want you to know that it’s just moved up on my todo-list. A lot further up.
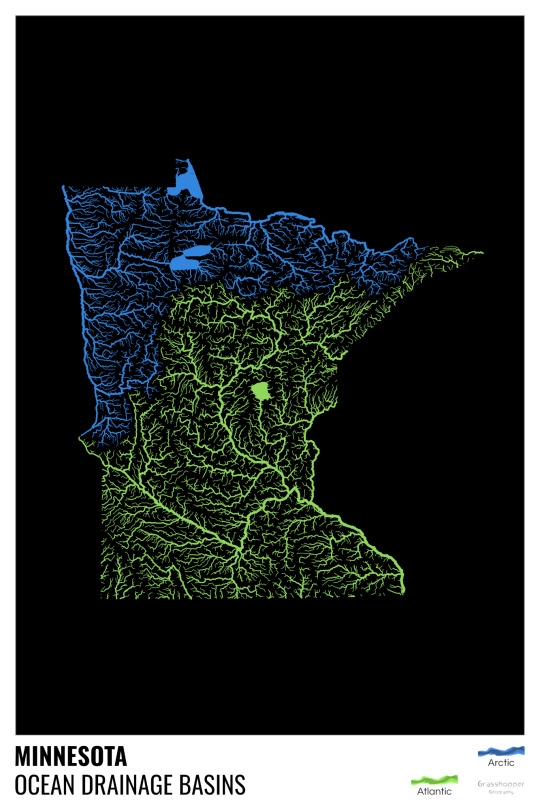
Minnesota is quite crazy with all that blue, right? Some other US states that are equally mind-blowing: North Dakota, New Mexico, Colorado, Wyoming. You can check them all out here.
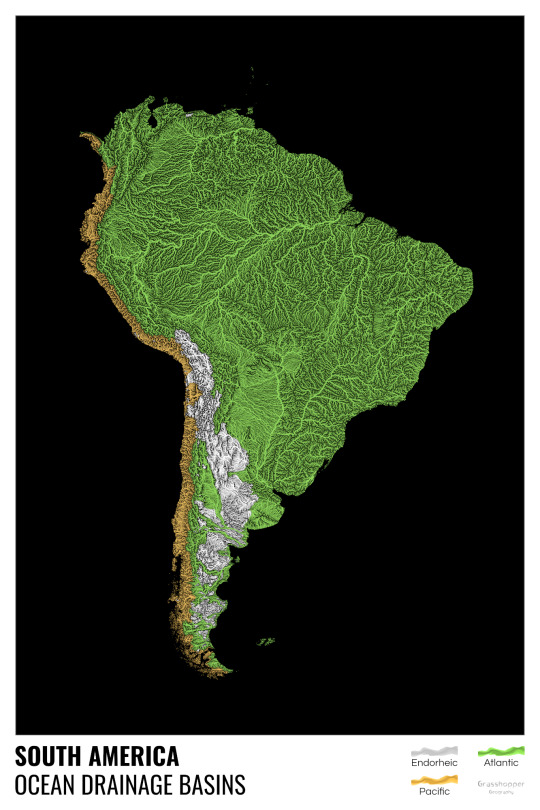
Yes, most of the Peruvian waters drain into the Atlantic Ocean. Here are the maps of Peru, if you want to take a closer look.
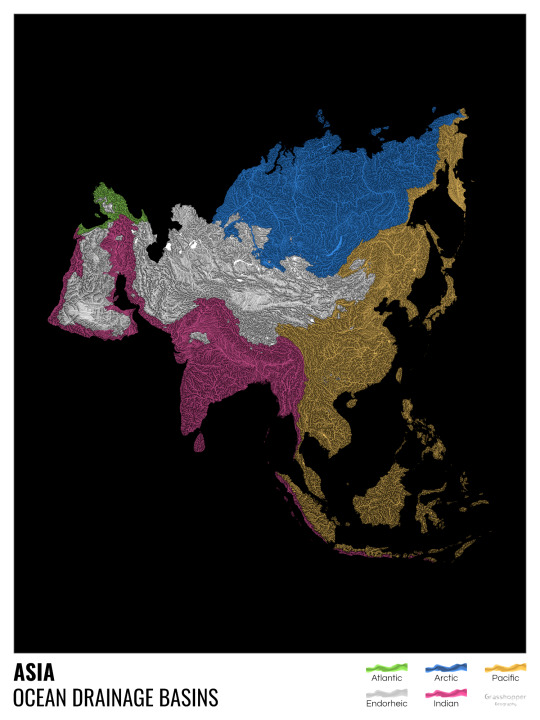
Asia is amazingly colourful with lots of endorheic basins in the middle areas: deserts, the Himalayas and the Caspian sea are to blame. Also note how the Indonesian islands of Java and Sumatra are divided.
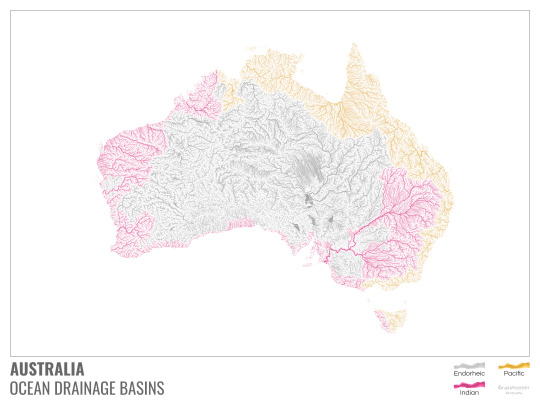
I mentioned earlier that I also made white versions of all maps. Here’s Australia with its vast deserts. If you're wondering about the weird lines in the middle: that’s the Simpson desert with its famous parallel sand dunes.
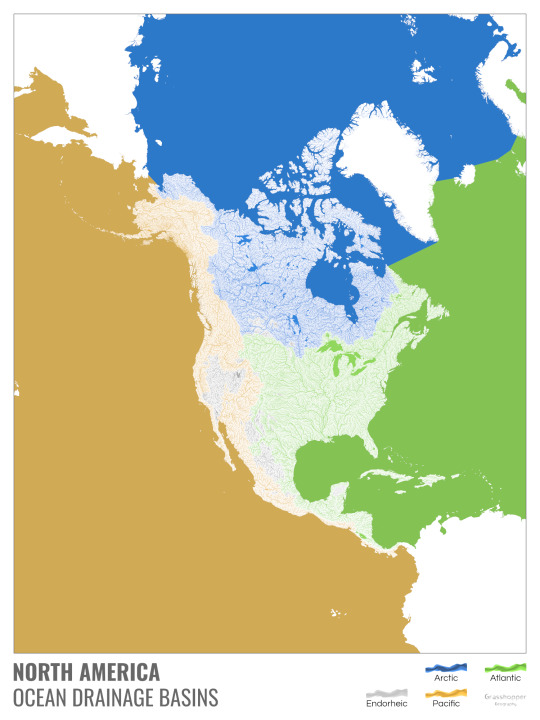
North America with white background and colourful oceans looks pretty neat, I think.

Finally, I made the drainage basin maps of the individual oceans: The Atlantic, the Arctic, the Indian and the Pacific. The Arctic is my favourite one.
I really hope you like my new maps, and that they will become as popular as my river basin maps. Those have already helped dozens of environmental NGOs to illustrate their important messages all around the world. It would be nice if these maps too could find their purpose.
#maps reimagined#geography#cartography#maps#my art#rivers of the world#ocean drainage basins#ocean maps#river maps
16K notes
·
View notes
Photo

Ocean drainage basin map of the United States
by u/Fejetlenfej
279 notes
·
View notes
Text
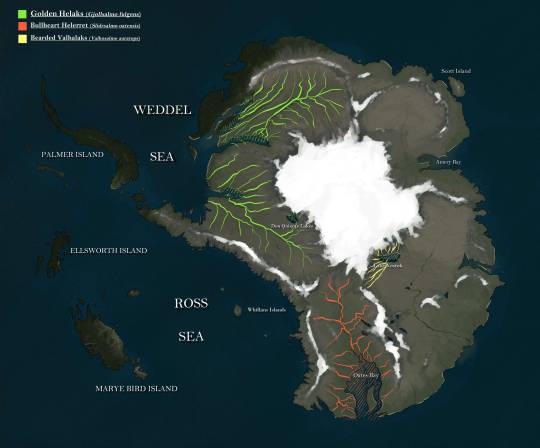
Salmonids of Artechocene Antarctica:
While thawing, the glaciers of Antarctica created an abundance of meltwater streams that now feed countless kilometres of freshwater ecosystems. At first nothing more than insect larvae and some crustaceans called these new environments home, but eventually fish entered the equation and quickly dominated.
One group of these fish were salmonids coming from South American coasts, descendants of invasive species such as the brown trout. They weren't the first, but they were much better at filling a lot of niches than the native Nothotenioids, which lacked hemoglobin and swim bladders.
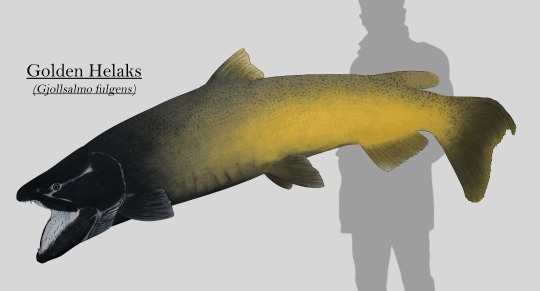
And so they almost outcompeted these to extinction, and diversified into several genera classified roughly in three distinct groups: Helaks, Helerrets, and Valhallaks.

Most of the Helaks species are amongst the largest predators of the continent, and the Golden Helaks (Gjollsalmo fulgens) is the largest of them all, measuring up to 2 meters (7ft) long and more than 100kg (250lb) in weight. They're apex predators, using their size to block scape routes for prey fish of any size and swallowing them whole, preventing them from scaping thanks to its huge backwards facing teeth. They're also known to eat crustaceans and even birds that venture too deep into the water. They live in every waterway across Antarctica, with the adults being confined to the deeper canals and lakes.
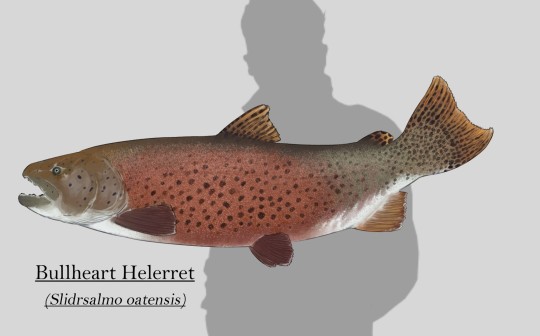
Helerrets are the most common salmonids that can be found in the rivers, lakes and wetlands of the continent. These medium sized predators mainly feed on the abundance of mollusks and other hard shelled invertebrates, as well as smaller vertebrates occasionally. This diet is enabled by their strong jaws, combined with blunt teeth that can crack open the shells of most freshwater invertebrates in their habitats. They're also the only Antarctic salmonids that retain the anadromous habits of its ancestors, living in freshwater but migrating to coastal waters to reproduce and release their young into the rich waters of the Southern Ocean.
The Bullheart Helerret (Slidrsalmo oatensis) in particular is native to the drainage basins that flow into Oates bay, where members of this species comes to spawn.
Valhallaks are a group of salmonids with remarkable sexual dimorphism compared to their close relatives. They are typically found in shallow rivers all across the continent, where they feed on invertebrates and vegetation.
Although not as common as Helerrets, they are abundant, specially in alpine streams and lakes during the end of the summer, where they come to spawn, away from predators so their eggs are protected by ice during the winter.
The Bearded Valhallaks (Valholsalmo auratops) specifically is endemic to the Vostok river drainage basin, which originates in Vostok Lake where they reproduce.
Range of the species featured:

67 notes
·
View notes
Text
Yesterday, the federal Environment Minister Steven Guilbeault announced that his government is developing regulations that would allow for “treated” tailings wastewater to be drained into the Athabasca River as early as 2025, when the current ponds will run out of capacity.
Alberta's toxic tailings ponds — which cover an area over twice the size of the city of Vancouver and are growing daily — contain dangerous levels of mercury, arsenic, and naphthenic acids. Even after treatment, tailings remain high in salinity and naphthenic acids.
While the Minister also stated that this was not the only option being explored, it is the only option that is fast-tracking significant changes to the federal Fisheries Act. Releasing tailings effluent will not only have a detrimental effect on life within the Arctic Ocean Drainage Basin but will also significantly impact what little environmental protections are left for life-giving water across the settler state of Canada.
Our position remains unchanged, and we vehemently oppose the release of “treated” tailings. This is nothing more than another handout to oil companies that will allow them to continue to avoid their responsibility of reclamation and the high cost of cleaning up their own mess. Releasing tailings into the watershed is not a safe or just option for solving Alberta’s ever-growing tailings crisis.
This is a decision that accepts northern Indigenous communities and lands will remain a sacrifice zone for the profit of settler governments, southern populations, and some of the world’s richest mining corporations. Indigenous peoples have already been saddled with the burden of the negative impacts of oil sands extraction on their traditional homelands. This decision will impact Indigenous communities across this country already facing accessible clean water issues. Keepers of the Water demand Free, Prior, and Informed Consent before Canada enacts Fisheries Act regulation changes.
There are many harmful impacts from the oil sands production and leaking toxic tailings ponds, such as low water levels and loss or contamination of critical species, which have effectively forced Indigenous people off their own land. These impacts are exacerbated by increasing impacts from climate change and other expanding industrial activity that changes landscapes forever.
“There is no proven way to turn treated tailings into safe drinking water, but the government process is pushing for tailings release and nothing else,” said Jesse Cardinal, executive director of Keepers of the Water. “It is no coincidence that the oil industry, which is banking record profits, continues to push for ineffective half measures that hurt the communities.”
If Canada is serious about implementing the UN Declaration on the Rights of Indigenous Peoples then they need our Free, Prior and Informed Consent before releasing tailings into the water.
You can Take Action Today!
Send a letter to the Minister for Environment Climate Change Canada, Steven Guilbeault, and the Deputy Minister for Environmental Protection, John Moffet, that says NO to the release of “treated” tar sands tailings effluent into the Athabasca River. Link: https://www.keepersofthewater.ca/call-to-action
- 30 -
For more information contact:
Jesse Cardinal - cell: 780-520-7108, email: [email protected]
Daniel T’seleie - cell: 867-444-0509, email: [email protected]
483 notes
·
View notes
Text
Southern Ocean
In 2000, the Southern Ocean is the newest ocean recognized by the International Hydrographic Organization.
It borders Antarctica in its entirety.
In terms of size, it’s the fourth-largest at 20,327,000 square kilometers. It extends out to 60 degrees South latitude.
It’s an extreme environment and is the least understood of the 5 oceans. This is because it is unexplored, far from populated areas, and has a severe climate. Despite the Southern Ocean being unexplored, about 80% of all oceans in the world are unexplored. There’s still a lot of work to do for ocean exploration.
Includes: Amundsen Sea, Bellingshausen Sea, part of the Drake Passage, Ross Sea, a small part of the Scotia Sea, Weddell Sea, and other tributary water bodies
Area
Total Area: 21.96 million sq km
Area - Comparative: Slightly more than twice the size of the US
Coastline: 17,968 km
Climate: Sea temperatures vary from about 10 degrees Celsius to -2 degrees Celsius; cyclonic storms travel eastward around the continent and frequently are intense because of the temperature contrast between ice and open ocean; the ocean area from about latitude 40 south to the Antarctic Circle has the strongest average winds found anywhere on Earth; in winter the ocean freezes outward to 65 degrees south latitude in the Pacific sector and 55 degrees south latitude in the Atlantic sector, lowering surface temperatures well below 0 degrees Celsius; at some coastal points intense persistent drainage winds from the interior keep the shoreline ice-free throughout the winter
Ocean Volume: 71.8 million cu km
Percent of World Ocean Total Volume: 5.4%
--------------------------------------------------------------------------
Bathymetry
Continental Shelf: A rather flat area of the sea floor adjacent to the coast that gradually slopes down from the shore to water depths of about 200 m (660 ft). Dimensions can vary: they may be narrow or nearly nonexistent in some places or extend for hundreds of miles in others. The waters along the continental shelf are usually productive in both plant and animal life, both from sunlight and nutrients from ocean upwelling and terrestrial runoff. Compared to the continental shelf found in other oceans, in Antarctica the continental shelf is narrower and much deeper. In addition, the continental shelf has been deeply scoured by glacial action.
Astrid Ridge
Belgrano Bank
Gunnerus Ridge
Hayes Bank
Iselin Bank
Continental Slope: Where the ocean bottom drops off more rapidly until it meets the deep-sea floor (abyssal plain) at about 3,200 m (10,500 ft) water depth. The deep waters of the continental slope are characterized by cold temperatures, low light conditions, and very high pressures. Sunlight does not penetrate to these depths, having been absorbed or reflected in the water above. The continental slope can be indented by submarine canyons, often associated with the outflow of major rivers. In the case of Antarctica, the continental slope has been scoured by glacial action cutting troughs and canyons down the slope. Another feature of the continental slope are alluvial fans or cones of sediments carried downstream to the ocean by major rivers and deposited down the slope.
Southern Ocean
Amery Basin
Filchner Trough
Hillary Canyon
Pobeda Canyon
Abyssal Plains: At depths of over 3,000 m (10,000 ft) and covering 70% of the ocean floor, are the largest habitat on earth. Sunlight does not penetrate to the sea floor, making these deep, dark ecosystems less productive than those along the continental shelf. Despite their name, these “plains” are not uniformly flat; they are interrupted by features like hills, valleys, and seamounts.
Amundsen (Abyssal) Plain
Enderby (Abyssal) Plain
South Indian/Australian-Antarctic Basin
Southeast Pacific/Bellinghausen Basin
Weddell (Abyssal) Plain
Mid-Ocean Ridge: Rising up from the abyssal plain, is an underwater mountain range, over 64,000 km (40,000 mi) long, rising to an average depth of 2,400 m (8,000 ft). Mid-ocean ridges form at divergent plate boundaries where two tectonic plates are moving apart and new crust is created by magma pushing up from the mantle. Tracing their way around the global ocean, this system of underwater volcanoes forms the longest mountain range on Earth. Fracture Zones are linear transform faults that develop perpendicular to the line of the mid-ocean ridge which can offset the ridge line and divide it into segments.
Pacific-Antarctic Ridge
Undersea Terrain Features: The Abyssal Plain is commonly interrupted by a variety of commonly named undersea terrain features including seamounts, guyots, ridges, and plateaus. Seamounts are submarine mountains at least 1,000 m (3,300 ft) high formed from individual volcanoes on the ocean floor. They are distinct from the plate-boundary volcanic system of the mid-ocean ridges, because seamounts tend to be circular or conical. A circular collapse caldera is often centered at the summit, evidence of a magma chamber within the volcano. Flat topped seamounts are known as guyots. Long chains of seamounts are often fed by "hot spots" in the deep mantle. These hot spots are associated with stationary plumes of molten rock rising from deep within the Earth's mantle. These hot spot plumes melt through the overlying tectonic plate as it moves and supplies magma to the active volcanic island at the end of the chain of volcanic islands and seamounts. An undersea ridge is an elongated elevation of varying complexity and size, generally having steep sides. An undersea plateau is a large, relatively flat elevation that is higher than the surrounding relief with one or more relatively steep sides. Although submerged, these features can reach close to sea level.
Akopov Seamounts
De Gerlache Seamounts
Endurance Ridge
Marie Byrd Seamount
Maud Rise
Scott Seamounts
Ocean Trenches: The deepest parts of the ocean floor and are created by the process of subduction. Trenches form along convergent boundaries where tectonic plates are moving toward each other, and one plate sinks (is subducted) under another. The location where the sinking of a plate occurs is called a subduction zone. Subduction can occur when oceanic crust collides with and sinks under (subducts) continental crust resulting in volcanic, seismic, and mountain-building processes. Subduction can also occur in the convergence of two oceanic plates where one will sink under the other and in the process create a deep ocean trench. Subduction processes in oceanic-oceanic plate convergence also result in the formation of volcanoes. Over millions of years, the erupted lava and volcanic debris pile up on the ocean floor until a submarine volcano rises above sea level to form a volcanic island. Such volcanoes are typically strung out in chains called island arcs. As the name implies, volcanic island arcs, which closely parallel the trenches, are generally curved.
South Sandwich Trench; the deepest location in the Southern Ocean
Atolls: Due to the extremely cold water there are no atolls in the Southern Ocean
--------------------------------------------------------------------------
Highest Point: Sea Level
Lowest Point: Southern end of the South Sandwich Trench -7,434 m unnamed deep
Mean Depth: -3,270 m
Ocean Zones: Composed of water and in a fluid state, the ocean is delimited differently than the solid continents. The ocean is divided into three zones based on depth and light level. Although some sea creatures depend on light to live, others can do without it. Sunlight entering the water may travel about 1,000 m into the oceans under the right conditions, but there is rarely any significant light beyond 200 m.
The upper 200 m (656 ft) of the ocean is called the euphotic, or "sunlight," zone. This zone contains the vast majority of commercial fisheries and is home to many protected marine mammals and sea turtles. Only a small amount of light penetrates beyond this depth.
The zone between 200 m (656 ft) and 1,000 m (3,280 ft) is usually referred to as the "twilight" zone, but is officially the dysphotic zone. In this zone, the intensity of light rapidly dissipates as depth increases. Such a minuscule amount of light penetrates beyond a depth of 200 m that photosynthesis is no longer possible.
The aphotic, or "midnight," zone exists in depths below 1,000 m (3,280 ft). Sunlight does not penetrate to these depths and the zone is bathed in darkness.
--------------------------------------------------------------------------
Natural Resources: Probable large oil and gas fields on the continental margin; manganese nodules, possible placer deposits, sand and gravel, fresh water as icebergs; squid, whales, and seals - none exploited; krill, fish
Natural Hazards: Huge icebergs with drafts up to several hundred meters; smaller bergs and iceberg fragments; sea ice (generally 0.5 to 1 m thick) with sometimes dynamic short-term variations and with large annual and interannual variations; deep continental shelf floored by glacial deposits varying widely over short distances; high winds and large waves much of the year; ship icing, especially May-October; most of region is remote from sources of search and rescue
Geography - Note: The major chokepoint is the Drake Passage between South America and Antarctica; the Polar Front (Antarctic Convergence) is the best natural definition of the northern extent of the Southern Ocean; it is a distinct region at the middle of the Antarctic Circumpolar Current that separates the cold polar surface waters to the south from the warmer waters to the north; the Front and the Current extend entirely around Antarctica, reaching south of 60 degrees south near New Zealand and near 48 degrees south in the far South Atlantic coinciding with the path of the maximum westerly winds
--------------------------------------------------------------------------
Enviornment
Enviornment - Current Issues: Changes to the ocean's physical, chemical, and biological systems have taken place because of climate change, ocean acidification, and commercial exploitation
Enviornment - International Agreements: The Southern Ocean is subject to all international agreements regarding the world's oceans; in addition, it is subject to these agreements specific to the Antarctic region: International Whaling Commission (prohibits commercial whaling south of 40 degrees south [south of 60 degrees south between 50 degrees and 130 degrees west]); Convention on the Conservation of Antarctic Seals (limits sealing); Convention on the Conservation of Antarctic Marine Living Resources (regulates fishing) note: mineral exploitation except for scientific research is banned by the Environmental Protocol to the Antarctic Treaty; additionally, many nations (including the US) prohibit mineral resource exploration and exploitation south of the fluctuating Polar Front (Antarctic Convergence), which is in the middle of the Antarctic Circumpolar Current and serves as the dividing line between the cold polar surface waters to the south and the warmer waters to the north
Climate: Sea temperatures vary from about 10 degrees Celsius to -2 degrees Celsius; cyclonic storms travel eastward around the continent and frequently are intense because of the temperature contrast between ice and open ocean; the ocean area from about latitude 40 south to the Antarctic Circle has the strongest average winds found anywhere on Earth; in winter the ocean freezes outward to 65 degrees south latitude in the Pacific sector and 55 degrees south latitude in the Atlantic sector, lowering surface temperatures well below 0 degrees Celsius; at some coastal points intense persistent drainage winds from the interior keep the shoreline ice-free throughout the winter
--------------------------------------------------------------------------
Ports and Terminals
Major Seaport(s): McMurdo, Palmer, and offshore anchorages in Antarctica
Note: Few ports or harbors exist on the southern side of the Southern Ocean; ice conditions limit use of most to short periods in midsummer; even then some cannot be entered without icebreaker escort; most Antarctic ports are operated by government research stations and, except in an emergency, are not open to commercial or private vessels
5 notes
·
View notes
Text
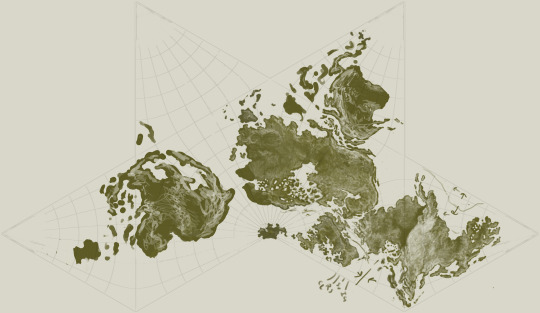
I've been in a creative frenzy these past few days and I went from just having a vague idea of just a regional map for my dnd campaign, to suddenly having a rough topological world map almost finished. It's in the cahill butterfly projection because it's easier to ideate in and I cannot be asked to account for much distortion so I just decided to make the world fit easily onto the projection. I'm not gonna be too anal about the tectonic realism but my goal is for someone with like a bachelor's in geology to be able to take a look at this and think it at least feels truthy (and you can see some of my sketching of what the tectonic activity is)
next step: atmospheric circulation
next next step: oceanic circulation
next next next step: climate zoning
next next next next step: drainage basins, rivers, and hydrology
next next next next next step: major eco-zones
next next next next next next step: major cultural zoning and fitting in the other cultures I've thought of but haven't mapped yet onto the map
I desperately need sleep
#mine#personal#I also spent way too long getting a decent implementation of this projection working in blender#so now I'm able to export the map and actually view it on a globe when I want to make sure everything fits together right#so I have krita open on one monitor and blender open on the other#players don't look if you do somehow manage to see this no you didn't#there's certain parts of the map I don't love but overall I'm pretty happy with it#the layout was hard though#I got way less ocean than the real earth but I choose to be okay with that#it's still like... more than half ocean I think#so that should be fine#worldbuilding
8 notes
·
View notes
Text
6 notes
·
View notes
Note
Do you have any Montana headcanons?
Montana Headcanons
Montana’s State Spirit form is a gold vein in the shape of the Triple Divide Peak. When his emotions become more intense, the gold vein spreads further and can even start tracing his blood vessels.
This is a reference to Montana’s nickname as the Treasure State and its mining industry.
Triple Divide Peak is a rare point on Earth where three drainage basins meet that allows for water to flow into the Atlantic Ocean, Hudson Bay, and Pacific Ocean.
The location of the gold vein is on his chest, with the summit point being directly over his heart. This means it’s usually covered by his shirt. States like Nevada and Louisiana have a harder time gauging Montana’s emotions because they can’t see his Spirit well.
He’s pretty withdrawn and much prefers the company of animals to other people. Montana would rather sleep in a cave with a grizzly bear and her cubs (and he has) than attend a raging house party thrown by Florida or any of the states that like to party.
Although, he moved to the Statehouse in the first place to practice becoming more sociable. Montana prefers taking it one step at a time.
Montana’s into geology, but he’s especially focused on petrology (rocks) and mineralogy (minerals).
He likes to collect shiny gems and rocks with that magpie thought process. (Credit to @s-e-v-e-n-24)
But, he also likes to collect rocks and minerals with interesting structures and compositions to study.
Montana actually prefers looking at raw gemstones than cut ones. He thinks that cutting them takes away the long and storied history of the natural processes that made the gem unique and just turns them into another dime-a-dozen normal jewel.
He also likes biology, more specifically mammalogy (mammals), ornithology (birds), and studying animal behavior.
This makes him very knowledgeable in livestock farming and caring for animals as well.
Montana is one of the best states when it comes to starting a farm, its low land cost and low property taxes contribute to that.
Montana cares a lot about honoring and supporting his Native population. He donates money, buys from Native artists and craftspeople, and does volunteer work.
#replies!#welcome to the table#welcome to the statehouse#ben brainard#wttt#wttsh#wttt montana#headcanons
31 notes
·
View notes
Photo

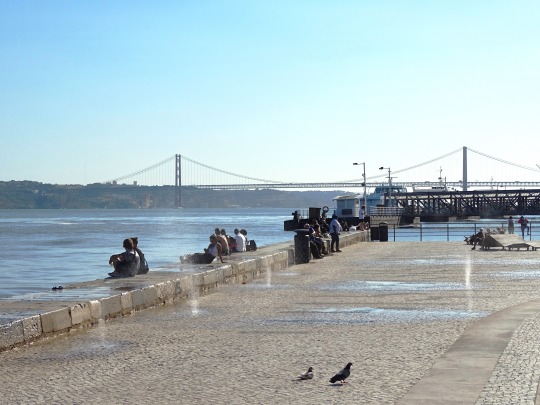
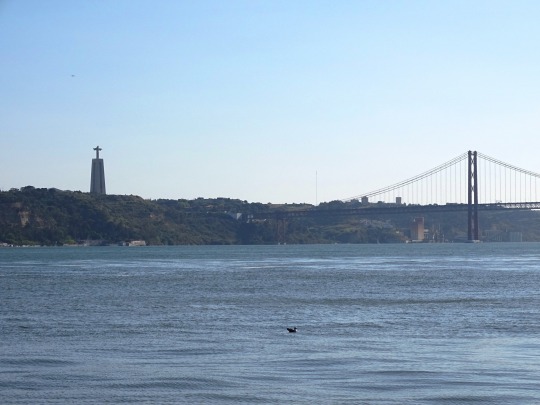
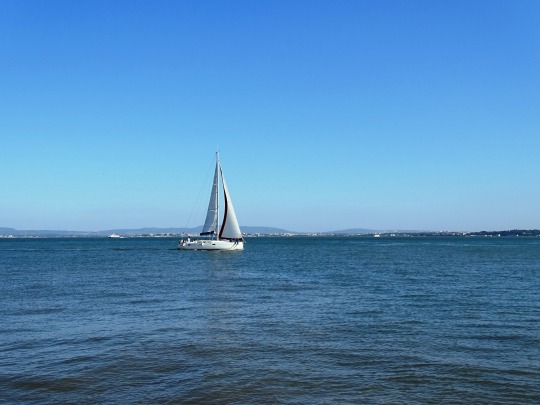


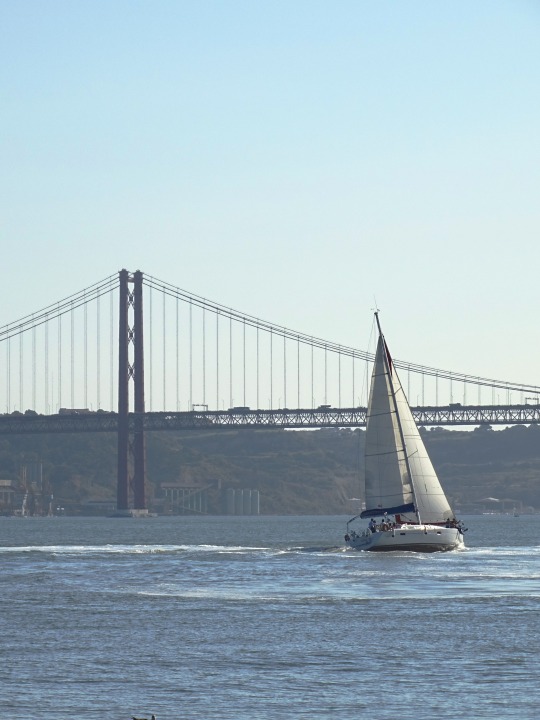


Riverfront, Lisbon (No. 1)
The Tagus is the longest river in the Iberian Peninsula. The river rises in the Montes Universales near Teruel, in mid-eastern Spain, flows 1,007 km (626 mi), generally west with two main south-westward sections, to empty into the Atlantic Ocean in Lisbon. Its drainage basin covers 80,100 km2 (30,927 sq mi) – exceeded in the peninsula only by the Douro. The river is highly used. Several dams and diversions supply drinking water to key population centres of central Spain and Portugal; dozens of hydroelectric stations create power. Between dams it follows a very constricted course, but after Almourol, Portugal it has a wide alluvial valley, prone to flooding. Its mouth is a large estuary culminating at the major port, and Portuguese capital, Lisbon.
The source is specifically: in political geography, at the Fuente de García in the Frías de Albarracín municipality; in physical geography, within the notably high range, the Sistema Ibérico (Iberian System), of the Sierra de Albarracín Comarca. All the major tributaries are right bank, which is locally to the north. The river flows 716 km (445 mi) in Spain, 47 km (29 mi) along the two countries' border and 275 km (171 mi) in Portugal.
The main cities the rivers passes through consecutively are Aranjuez, Toledo and Talavera de la Reina in Spain, and Abrantes, Santarém, Almada and Lisbon in Portugal. The Spanish capital, Madrid, lies in the upper drainage basin.
Source: Wikipedia
#Cais das Pombas#25 de Abril Bridge#Tagus River#Tajo#Tejo#cityscape#riverfront#architecture#tourist attraction#landmark#ship#boat#travel#summer 2021#original photography#vacation#Lisbon#Lisboa#Portugal#Southern Europe#river bank#engineering#water#afternoon stroll
2 notes
·
View notes
Text
MJ: Research
Part 2
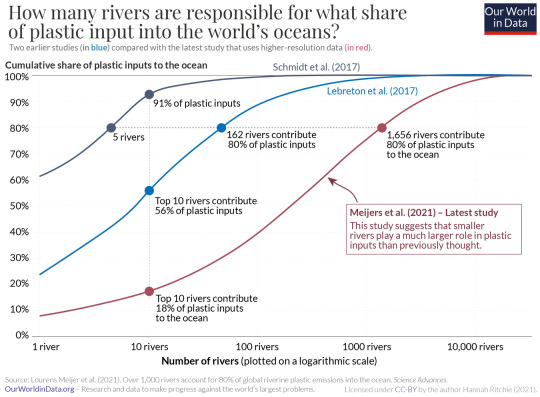
The shift in understanding regarding the major contributors to plastic pollution in rivers is primarily due to the utilization of higher-resolution data and more sophisticated modelling techniques in the latest analysis.
1. Higher Resolution Data: The latest analysis used much finer-grained data, allowing for a more detailed understanding of the dynamics of plastic pollution in rivers. This finer-resolution data likely provided a more accurate depiction of factors such as wind and precipitation patterns, river discharge, population distribution, land use, and proximity to the ocean.
2. Sophisticated Modeling Techniques: The new analysis employed advanced modelling techniques that take into account deterministic drivers of plastic transportation, such as wind and precipitation patterns, as well as factors affecting the probability of plastic entering rivers and eventually reaching the ocean. These factors include population density near rivers, distance to the ocean, terrain slope, and land use types. By incorporating these factors into the models, researchers were able to gain a more nuanced understanding of how plastic pollution behaves within river systems.
3. Calibration and Validation: The models used in the latest analysis were calibrated and validated using several years of research across multiple rivers in different countries. This rigorous process ensures that the models accurately represent real-world conditions and behaviours, increasing confidence in the results.
4. Reevaluation of Factors: The new analysis revealed that factors influencing the probability of plastics entering rivers and subsequently reaching the ocean are more significant contributors to plastic pollution than the sheer size of river basins. This suggests that smaller rivers, which may have been overlooked in earlier studies, play a more substantial role in the transport of plastic waste.
Overall, the adoption of higher-resolution data and advanced modelling techniques allowed for a more comprehensive understanding of the drivers behind plastic pollution in rivers, leading to a reevaluation of the relative importance of different factors and a recognition of the significant role played by smaller rivers in the global plastic pollution problem.
Which rivers emit the most plastic into the ocean?
Understanding the origins and reasons behind plastic pollution in rivers is crucial for effective mitigation strategies. Predominantly, the major contributors to plastic pollution are found in Asia, with additional significant sources located in East Africa and the Caribbean. The chart highlights the top ten emitters, illustrating each river's proportion of the global plastic pollution burden. Further exploration of data for the top 50 rivers is possible by utilizing the +Add river button on the chart.
Remarkably, seven out of the top ten polluting rivers are situated in the Philippines, while two are located in India and one in Malaysia. Notably, the Pasig River in the Philippines alone is responsible for 6.4% of global river plastic pollution. This contrasts sharply with previous studies, where larger Asian rivers such as the Yangtze, Xi, and Huangpu rivers in China, and the Ganges in India, were identified as primary contributors.

The factors contributing to plastic pollution in rivers are multifaceted and underscore the importance of various environmental and geographical considerations. Firstly, regions with inadequate waste management practices tend to exhibit higher levels of plastic pollution, as a significant amount of mismanaged plastic waste finds its way into water bodies. Therefore, improving waste management infrastructure is paramount in combating plastic pollution.
Secondly, proximity to urban centres plays a crucial role, as cities often feature extensive paved surfaces that facilitate the drainage of both water and plastic debris into river systems. For instance, cities like Jakarta and Manila, despite being drained by relatively small rivers, contribute significantly to plastic emissions.
Thirdly, high precipitation rates in river basins enhance the transport of plastic waste into rivers and subsequently towards the ocean.
Lastly, distance from urban areas to coastal regions also influences plastic emission levels, with rivers near densely populated coastal cities exhibiting higher emissions.
An illustrative example provided by the study highlights these factors. Despite being significantly smaller in size compared to the Rhine River basin in Europe, the Ciliwung River basin in Java emits a considerably larger amount of plastic into the ocean annually. This discrepancy is attributed to the basin's proximity to plastic waste generation sources, its proximity to the ocean, and the region's high precipitation rates, which facilitate the transport of plastic waste within the river network.
Overall, the study underscores the intricate interplay of climate, terrain, and proximity factors in driving plastic pollution in rivers, emphasizing the need for targeted interventions to address this pressing environmental issue.
Which countries emit the most plastic to the ocean?
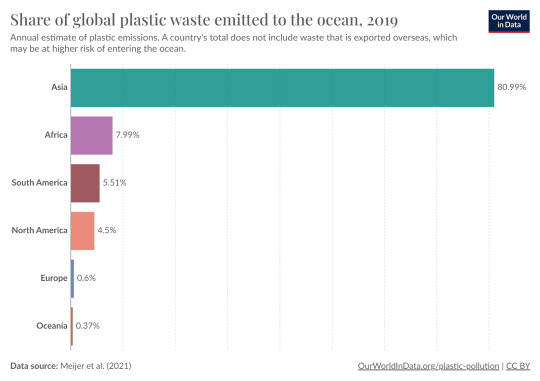
Asia accounts for 81% of global plastic inputs to the ocean
When examining plastic pollution on a regional and country-level scale, it becomes apparent that Asia is the largest contributor to plastic emissions into the ocean. According to the chart, a staggering 81% of ocean plastics originate from Asia. This finding aligns with previous research, which estimated Asia's share of ocean plastic pollution to be 86% in 2010.
Several factors contribute to Asia's disproportionate contribution to ocean plastic pollution. Firstly, Asia is the most populous region globally, accounting for 60% of the world's population. This high population density increases the likelihood of plastic waste generation and mismanagement.
Secondly, all of the top ten emitting rivers, including those in the Philippines, India, and Malaysia, are located in Asia, with a significant portion of the top 50 rivers also situated in the region. The prevalence of these rivers underscores their substantial impact on plastic pollution.
In contrast, other regions contribute comparatively less to ocean plastic pollution. Africa accounts for 8%, South America for 5.5%, North America for 4.5%, and Europe and Oceania combined contribute less than 1% to global ocean plastic inputs.
Overall, the dominance of Asia in ocean plastic pollution underscores the urgent need for targeted interventions and coordinated efforts to address plastic waste management practices in the region. Additionally, efforts to mitigate plastic pollution should also extend to other regions to collectively combat this global environmental challenge.
More than one-third of ocean plastic inputs come from the Philippines
The distribution of plastic inputs on the world map reflects each country's share of global plastic emissions. The Philippines stands out with more than one-third (36%) of plastic inputs, a significant portion attributed to the presence of seven of the top ten rivers in the country. This concentration is not surprising, considering the Philippines' geography, consisting of numerous small islands where a large proportion of the population resides near coastal areas.
This update challenges previous assumptions regarding the dominance of China and India in global plastic emissions. India now accounts for 13%, while China contributes 7%. These figures highlight the importance of understanding the dynamics of plastic pollution beyond just the major players, shedding light on significant contributors like the Philippines.
0 notes
Text
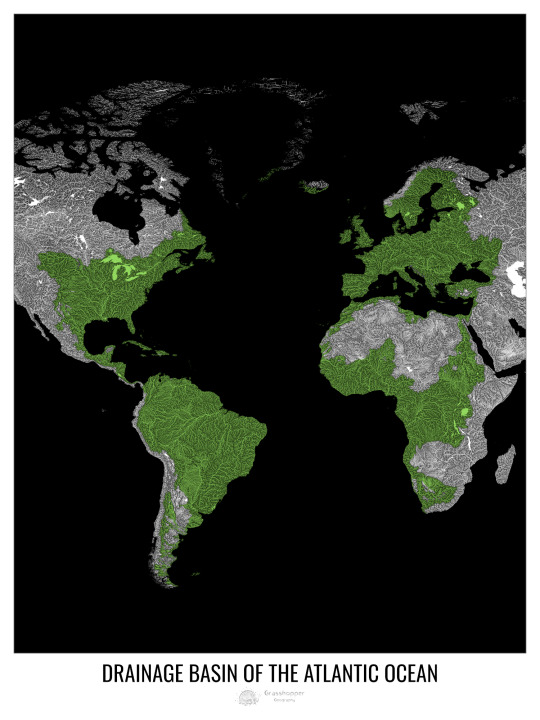
Drainage basin map of the Atlantic Ocean showing all permanent and temporary water flows.
Read more and buy prints here.
Ko-fi | RedBubble | Etsy (digital prints)
#geography#cartography#maps#my art#artists on tumblr#digital art#river map#map making#independent artist#wall art#ocean drainage basins#ocean#Atlantic Ocean#maps reimagined
9 notes
·
View notes
Photo

Ocean drainage basin map of the world
by u/Fejetlenfej
188 notes
·
View notes
Text
Newfoundland and Labrador–Quebec border - Wikipedia
The border between the province of Newfoundland and Labrador and the province of Quebec is the longest interprovincial border in Canada. It stretches for more than 3,500 kilometres (2,200 mi) on land, and, according to both provincial governments, also contains a maritime part.[a] Starting from the north, the border follows the Laurentian Divide (the divide between the drainage basin of the Atlantic Ocean and of the Arctic Ocean) on the Labrador Peninsula for the majority of the border's length, then follows the divide between the Côte-Nord-Gaspé and Newfoundland-Labrador drainage basins[1] as far as Brûlé Lake, after which it goes along the Romaine River downstream to the 52nd parallel,[2] which it follows east to its southeastern terminus at Blanc-Sablon.
#BOARDERPLAYS
DELËVOIX
0 notes
Text
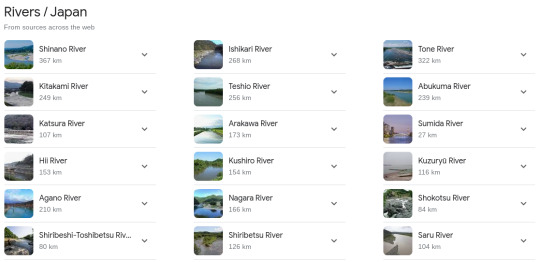
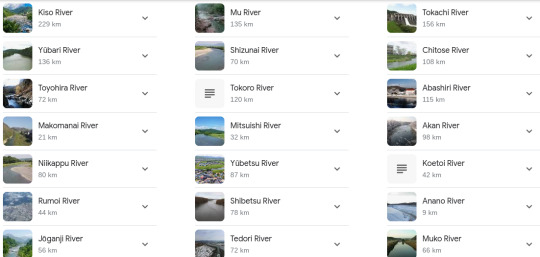
Japan's Rivers:
youtube
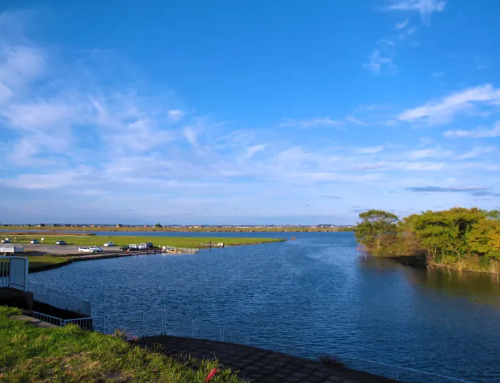
Japan is an archipelagic country made up of four big islands: Hokkaido, Honshu, Shikoku, and Kyushu, as well as around 6,800 smaller islands. Mountains and valleys dominate the topography, accounting for more than three-quarters of the total land area. Ice and snow from these mountains have formed several rivers, which are vital to the country's transportation, agriculture, and energy generation. Japan's rivers are often short, steep, and fast-flowing. This makes them great hydropower generators, but it also increases the chance of floods. Despite the hazards of flooding, Japanese communities have built near rivers since ancient times. Many of these rivers have been altered, some dramatically, to compensate for this. Under the River Law of 1967, Japan's streams and rivers are classed as Class A or Class B systems. The majority of Japan's most well-known rivers are classified as Class A, indicating that they are economically or ecologically important to the country.
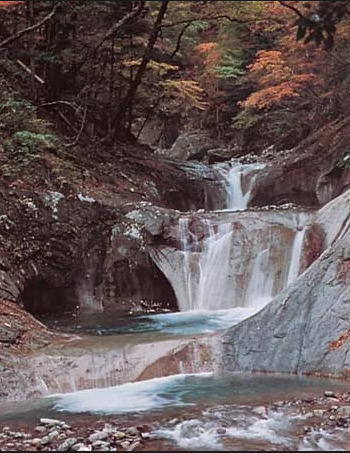
-Waterfall in Yamanashi prefecture, east-central Honshu, Japan.
The growing need for freshwater for paddy (wet-rice) production, industry, and home consumption poses a severe concern. The scarcity of natural water reservoirs, the rapid flow of rivers, and the engineering difficulties of building large-scale dams in the rocky highlands all contribute to supply challenges.

-Ishikari River, western Hokkaido, Japan
Ishikari River in western Hokkaido, Japan. Japan's rivers are usually short and rapid, fed by tiny drainage basins. The major rivers are the Teshio and Ishikari rivers in Hokkaido, the Kitakami, Tone, Shinano, Kiso, and Tenryū rivers on Honshu, and the Chikugo River in Kyushu. Honshu rivers include Tone, Shinano, Kiso, and Tenryū, as well as Kyushu's Chikugo River. Some rivers from northern Honshu's volcanic zones are acidic, rendering them worthless for irrigation and other reasons.
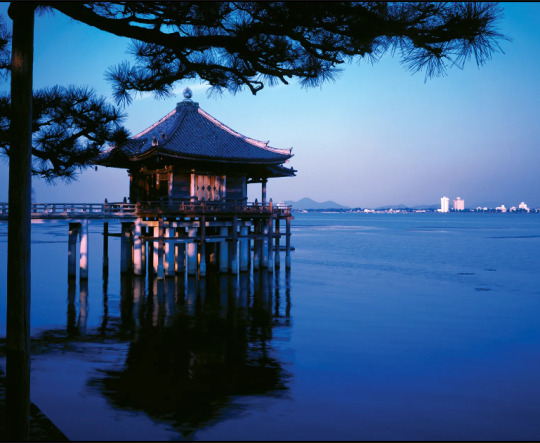
-Ukimi Temple, Lake Biwa, Shiga prefecture, central Honshu, Japan.
Lake Biwa, Japan's biggest, measures 259 square miles (670 square kilometres) in central Honshu. All other large lakes are to the northeast. The majority of coastal lakes, including Honshu's Lakes Kasumi and Hamana, are drowned former valleys with sandbars damming the bay entrances. Honshu's inland lakes, including Biwa, Suwa, and Inawashiro, are located in tectonic depressions formed by geologically recent faults. Volcanic lakes (such as Kutcharo in Hokkaido and Towada and Ashi in Honshu) dominate all others.
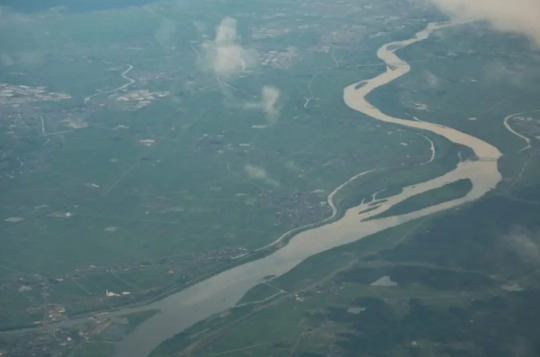
The Shinano River, also known as "Shinanogawa" on the island of Honshu, is the longest river in Japan. The river travels north for about 228 miles, from its source at Mount Kobushi in the Japanese Alps to its mouth in the Sea of Japan. The Shinano River flows through some of the country's most populous areas and major cities, including Matsumoto, Nagano, and Niigata. The Shinano River has played an essential role in Japanese life for millennia. It has functioned as a source of drinking water, a transit route, and a recreational and leisure area. Perhaps its most well-known application is to generate hydroelectric power. Actually, the country's first such power plant, the Miyashiro No. 1 power plant, was built along the river in 1904 and is still operational today. The river supports a rich range of plant and animal species, as well as fish, including Cherry Salmon. The Shinano River is a popular swimming and fishing area in the summer, and an ice skating and fishing destination in the winter. There are also several popular Onsen, or hot springs, along the river.
The Tone, or "Tonegawa" River, is one of Japan's most important rivers. This is partly because to its position, running across the densely populated Kanto Plain. The river originates in the mountains of central Japan and flows for approximately 200 miles to the Pacific Ocean. The river's basin, which is the biggest in Japan at 6,540 square miles, is home to nearly 40 million people. This is not just in the country's heart, but also on its greatest plain, which is home to the capital, Tokyo. Tonegawa was formerly a wild and untamed watercourse, but it is now widely regarded as the most intentionally changed of all Japanese rivers. The contemporary path has little similarity to the historic one. Tonegawa now features multiple dams, which serve as reservoirs for the Kanto region's residential and agricultural water needs. The largest of these is the Yagisawa Dam. The river is also utilised for transportation and pleasure, and it is surrounded by Japan's longest car-free cycling trail.

The Teshio, also known as "Teshigahara" in Hokkaido, is Japan's northernmost significant river. It runs for around 159 miles and has a basin area of about 2,160 square miles. The river has an average discharge of around 9,000 cubic feet per second. The Teshio River has been a major commerce and transit waterway since ancient times, and the indigenous Ainu people still utilise it now. The river is an important source of irrigation and hydroelectric power generation.
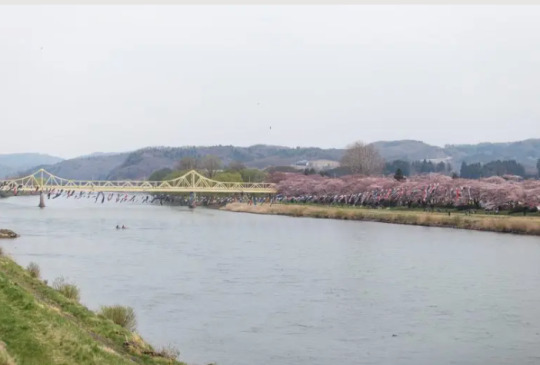
The Kitakami River, which was an important transit route during the Edo era, is the longest river in the Tohoku area, measuring around 155 miles. It is regarded as one of Japan's most picturesque rivers, with an abundance of cherry blossoms in the spring. The Kitakami is also home to a diverse range of fish and is a popular fishing destination.

Located on the island of Shikoku in Kōchi Prefecture, the Niyodo River is famed for its extraordinary turquoise waters. Its source is Mount Ishizuchi and it flows for just 77 miles.
Japan's Rivers:

Havard references:
The Editors of Encyclopaedia Britannica. (1998). Japan's Rivers [Online]. britannica. Last Updated: 27 October 2023.. Available at: https://www.britannica.com/place/Japan/Soils [Accessed 19 February 2024].
discovery uk. (2023). The Best Known Rivers in Japan. [Online]. discovery uk. Last Updated: 12 January 2023. Available at: https://www.discoveryuk.com/travel-and-exploration/the-best-known-rivers-in-japan/ [Accessed 19 February 2024].
0 notes
Text

Andes Snowpack Hangs On
Snowy mountains serve as natural “water towers” in some parts of the world, storing vital fresh water in frozen form during cool, wet times and releasing it in warmer, drier seasons. In central Chile, however, a megadrought, ongoing since 2010, has disrupted this dynamic. The prolonged dry period has often left seasonal mountain snowpack thin, straining water supplies, exacerbating wildfires, and parching crops. Winter 2023 brought some relief.
The respite is due in part to two atmospheric rivers that delivered abundant rain and snow to the region. A relatively cold spring followed and left the Andes’ water towers much fuller heading into the dry season than in recent years.
The difference in snow cover is apparent in this image pair. On December 18, 2023 (right), at the start of summer in the southern hemisphere, seasonal snow still blanketed the Andes, straddling Chile to the west and Argentina to the east. On the same date in 2021 (left), much less snow and ice remained following a very dry winter. Both images were acquired by the VIIRS (Visible Infrared Imaging Radiometer Suite) on the NOAA-20 satellite.
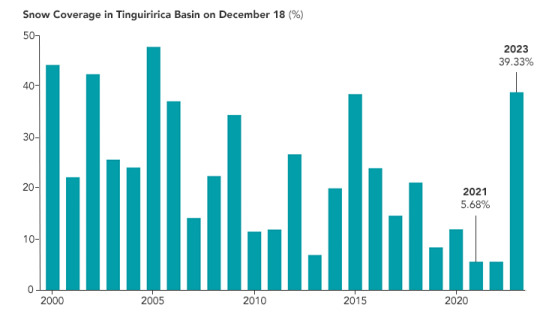
Data from the Observatorio de Nieve en los Andes de Argentina y Chile (above) show that mid-December snow coverage in the Tinguiririca Basin in 2023 stood well above levels seen in the past several years. The observatory supports a digital platform using data from NASA’s MODIS (Moderate Resolution Imaging Spectroradiometer) sensors to track snow cover in Andean drainage basins over time.
“The seasonal snowpack—often depleted by this time of year—is hanging in there,” said atmospheric scientist René Garreaud of Universidad de Chile, “and that is pretty good for the rivers draining the Andean basins on both sides of the Chile–Argentina border.”
The Tinguiririca Basin, south of Santiago, feeds one of the major rivers flowing from the subtropical Andes to the Pacific Ocean. It provides water to the O’Higgins Region, an important agricultural area in Chile’s Central Valley known for its fruit orchards and wine production.
Amid the brighter signs of a healthier snowpack and water sources refilling, Garreaud cautions this wet year may represent not so much an end but a mere interruption to the megadrought. “Climate change is pushing central Chile toward a drier climate,” he said. Regional models project a 35-45 percent decrease in Andes snowpack by mid-century, even in a low greenhouse gas emission scenario, a recent study found.
NASA Earth Observatory images by Wanmei Liang, using VIIRS data from NASA EOSDIS LANCE, GIBS/Worldview, and the Joint Polar Satellite System (JPSS). Snow coverage data from MODIS, processed by the Observatorio de Nieve en los Andes de Argentina y Chile, IANIGLA-CONICET and (CR)2. Basin boundary data from Camels-CL Explorer. Story by Lindsey Doermann.
0 notes
Last Seen Blogs

anjanahalo
General Journey

todos-podemos-cocinar-blog
Todos podemos cocinar

bscube2
untitled

tgon
The Ghost of Nostalgia
goldeaglefire1
Golden