#data management
Note
Hi, very random question - would you have advice for naming and organizing files? I saw your reblog of how to turn off the Windows 11 internet search thing and had my eyes bug out at the amount of files you have. I struggle to keep things organized after like....twenty...
Sure thing! Before I got into 3D, I didn't pay much mind to my file names or where I saved things. After getting into 3D, where those things have an impact on your ability to work on your projects, I was forced to tighten up!
1. Folders are your friend. However you want to organize things is up to you; depending on what I'm working on, I group things by project or subject first. So, for example, on my computer I might have a folder titled "DND". Inside that folder, I have a sub-folder for each campaign, and inside that folder I have a sub-folder for things like maps & documents, and then another for character art with sub-folders divided by character.
2. Decide a naming convention for your stuff. This could be something like "projectShortName_pg#_MMDDYY", or "characterName_portrait_MMDDYY". Having an identifier that makes it clear it's different from other files with similar names is really helpful, and keeping it in the name itself (instead of relying on "last modified" can be a good move.
3. Keep it short, but keep it useful. This is something you might not want to implement-- I use it all the time because it's part of the 3D pipeline, but shortnames are big for knowing what files are "at a glance". Like instead of something like, "Legend of Zelda Link Fanart 112123", I'd go with something like "TLOZ_LFA_112123". This is most useful when the folder structures are in place; if you have a Legend_of_Zelda folder, TLOZ will likely click as "The Legend of Zelda".
4. Don't be afraid to clear it out. Every few months, I gather everything I'm finished with into a folder titled "DSKT_CLEAR_MMDDYY". All of my folders are moved into the core folder, that folder gets moved to my external(s), and I move on.
Doing this when you've never done it before is a hard habit to establish (again, I was only able to do it because it was required while I was in school and now that I'm teaching the same subject), and going back to organize old stuff can be really intimidating. For that reason, I'd suggest gathering everything you currently have, moving it into a "Folder_Holder" folder, and then trying to implement these tips in future file management.
Let me know if you have any questions!
160 notes
·
View notes
Text
Research Data Management. Or, How I made multiple backups and still almost lost my honours thesis.
This is a story I used to tell while teaching fieldworkers and other researchers about how to manage their data. It’s a moderately improbable story, but it happened to me and others have benefited from my misadventures. I haven't had reason to tell it much lately, and I thought it might be useful to put into writing. This is a story from before cloud storage was common - back when you could, and often would, run out of online email storage space.
Content note: this story includes some unpleasant things that happened to me, including multiple stories of theft (cf. moderately improbable). Also, because it's stressful for most of the story, I want to reassure you that it does have a happy conclusion. It explains a lot of my enthusiasm for good research data management.
In Australia, 'honours' is an optional fourth year for a three year degree. It's a chance to do some more advanced coursework and try your hand at research, with a small thesis project. Of course, it doesn't feel small when it's the first time you've done a project that takes a whole year and is five times bigger than anything you’ve ever written.
I've written briefly about my honours story (here, and here in a longer post about my late honours supervisor Barb Kelly) . While I did finish my project, it all ended a bit weirdly when my supervisor Barb got ill and left during the analysis/writing crunch. The year after finishing honours I got an office job. I hoped to maybe do something more with my honours work, but I wasn't sure what, and figured I would wait until Barb was better.
During that year, my sharehouse flat was broken into and the thief walked out with the laptop I'd used to do my honours project. The computer had all my university files on it, including my data and the Word version of my thesis. I lost interview video files, transcriptions, drafts, notes and everything except the PDF version I had uploaded to the University's online portal. Uploading was optional at the time, if I didn't do that I probably would have just been left with a single printed copy. I also lost all my jewellery and my brother’s base guitar, but I was most sad about the data (sorry bro).
Thankfully, I made a backup of my data and files on a USB drive that I kept in my handbag. This was back when a 4GB thumb drive was an investment.
That Friday, feeling sorry for myself after losing so many things I couldn't replace, I decided to go dancing to cheer myself up. While out with a group of friends, my bag was stolen. It was the first time I had a nice handbag, and I still miss it.
Thankfully, I knew to make more than one back up. I had an older USB that I'd tucked down the back of the books on my shelf (a vintage 256MB drive my dad kindly got for me in undergrad after a very bad week when I lost an essay to a corrupted floppy disk).
When I went to retrieve the files, the drive was (also) corrupted. This happens with hard drives sometimes. My three different copies in three different locations were now lost to me.
Thankfully, my computer had a CD/DVD burner. This was a very cool feature in the mid-tens, and I used to make a lot of mixed CDs for my friends. During my honours project I had burned backed up files on some discs and left them at my parents house.
It was this third backup, kept off site, which became the only copy of my project. I very quickly made more copies.
When Barb was back at work, and I rejoined her as a PhD student, it meant we could return to the data and all my notes. The thesis went through a complete rewrite and many years later was published as a journal article (Gawne & Kelly 2014). It would have probably never happened if I didn’t have those project files. I continued with the same cautious approach to my research data ever since, including sending home SD cards while on field trips, making use of online storage, and archiving data with institutional repositories while a project is ongoing.
I’m glad that I made enough copies that I learnt a good lesson from a terrible series of events. Hopefully this will prompt you, too, to think about how many copies you have, where they’re located, and what would happen if you lost access to your online storage.
70 notes
·
View notes
Note
what's the most important piece of advice you could give someone who's getting into downloading media (piracy, archiving, whatever)?
For the love of God, MAKE BACKUPS. I had to learn this lesson the hard way as a teenager when my external hard drive crashed and I couldn't pay the data recovery fee (which would have been a few hundred dollars, if it even worked).
Have backups. Have backups of your backups. To give you an idea of what my data and backup setup is:
My laptop: two backups (physical backup via external hard drive and automatic cloud backup via BackBlaze)
My media collection: three sources/backups (two external hard drives and a NAS [network attached storage system] with a failsafe measure because it has two hard drives; I will most likely look into cloud-based backup as well).
If you've noticed, I not only have a backup of all my data, I also have backups of backups. When it comes to your precious data, you seriously can't be too careful. I would recommend at least investing in one physical backup option as well as a cloud-based one (like BackBlaze).
#like seriously I've heard so many horror stories of people losing so much precious data because they never made a backup#IF SOMETHING IS IMPORTANT TO YOU MAKE SURE YOU HAVE MULTIPLE COPIES OF IT!!!#data management#media preservation#advice#technology
296 notes
·
View notes
Text
In the subject of data analytics, this is the most important concept that everyone needs to understand. The capacity to draw insightful conclusions from data is a highly sought-after talent in today's data-driven environment. In this process, data analytics is essential because it gives businesses the competitive edge by enabling them to find hidden patterns, make informed decisions, and acquire insight. This thorough guide will take you step-by-step through the fundamentals of data analytics, whether you're a business professional trying to improve your decision-making or a data enthusiast eager to explore the world of analytics.
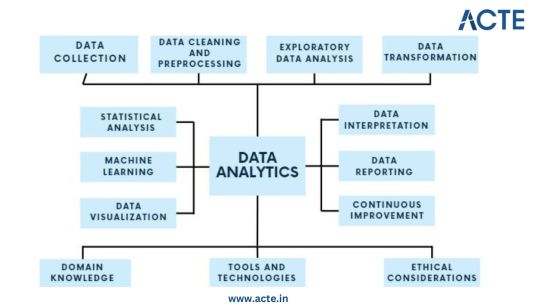
Step 1: Data Collection - Building the Foundation
Identify Data Sources: Begin by pinpointing the relevant sources of data, which could include databases, surveys, web scraping, or IoT devices, aligning them with your analysis objectives.
Define Clear Objectives: Clearly articulate the goals and objectives of your analysis to ensure that the collected data serves a specific purpose.
Include Structured and Unstructured Data: Collect both structured data, such as databases and spreadsheets, and unstructured data like text documents or images to gain a comprehensive view.
Establish Data Collection Protocols: Develop protocols and procedures for data collection to maintain consistency and reliability.
Ensure Data Quality and Integrity: Implement measures to ensure the quality and integrity of your data throughout the collection process.
Step 2: Data Cleaning and Preprocessing - Purifying the Raw Material
Handle Missing Values: Address missing data through techniques like imputation to ensure your dataset is complete.
Remove Duplicates: Identify and eliminate duplicate entries to maintain data accuracy.
Address Outliers: Detect and manage outliers using statistical methods to prevent them from skewing your analysis.
Standardize and Normalize Data: Bring data to a common scale, making it easier to compare and analyze.
Ensure Data Integrity: Ensure that data remains accurate and consistent during the cleaning and preprocessing phase.
Step 3: Exploratory Data Analysis (EDA) - Understanding the Data
Visualize Data with Histograms, Scatter Plots, etc.: Use visualization tools like histograms, scatter plots, and box plots to gain insights into data distributions and patterns.
Calculate Summary Statistics: Compute summary statistics such as means, medians, and standard deviations to understand central tendencies.
Identify Patterns and Trends: Uncover underlying patterns, trends, or anomalies that can inform subsequent analysis.
Explore Relationships Between Variables: Investigate correlations and dependencies between variables to inform hypothesis testing.
Guide Subsequent Analysis Steps: The insights gained from EDA serve as a foundation for guiding the remainder of your analytical journey.
Step 4: Data Transformation - Shaping the Data for Analysis
Aggregate Data (e.g., Averages, Sums): Aggregate data points to create higher-level summaries, such as calculating averages or sums.
Create New Features: Generate new features or variables that provide additional context or insights.
Encode Categorical Variables: Convert categorical variables into numerical representations to make them compatible with analytical techniques.
Maintain Data Relevance: Ensure that data transformations align with your analysis objectives and domain knowledge.
Step 5: Statistical Analysis - Quantifying Relationships
Hypothesis Testing: Conduct hypothesis tests to determine the significance of relationships or differences within the data.
Correlation Analysis: Measure correlations between variables to identify how they are related.
Regression Analysis: Apply regression techniques to model and predict relationships between variables.
Descriptive Statistics: Employ descriptive statistics to summarize data and provide context for your analysis.
Inferential Statistics: Make inferences about populations based on sample data to draw meaningful conclusions.
Step 6: Machine Learning - Predictive Analytics
Algorithm Selection: Choose suitable machine learning algorithms based on your analysis goals and data characteristics.
Model Training: Train machine learning models using historical data to learn patterns.
Validation and Testing: Evaluate model performance using validation and testing datasets to ensure reliability.
Prediction and Classification: Apply trained models to make predictions or classify new data.
Model Interpretation: Understand and interpret machine learning model outputs to extract insights.
Step 7: Data Visualization - Communicating Insights
Chart and Graph Creation: Create various types of charts, graphs, and visualizations to represent data effectively.
Dashboard Development: Build interactive dashboards to provide stakeholders with dynamic views of insights.
Visual Storytelling: Use data visualization to tell a compelling and coherent story that communicates findings clearly.
Audience Consideration: Tailor visualizations to suit the needs of both technical and non-technical stakeholders.
Enhance Decision-Making: Visualization aids decision-makers in understanding complex data and making informed choices.
Step 8: Data Interpretation - Drawing Conclusions and Recommendations
Recommendations: Provide actionable recommendations based on your conclusions and their implications.
Stakeholder Communication: Communicate analysis results effectively to decision-makers and stakeholders.
Domain Expertise: Apply domain knowledge to ensure that conclusions align with the context of the problem.
Step 9: Continuous Improvement - The Iterative Process
Monitoring Outcomes: Continuously monitor the real-world outcomes of your decisions and predictions.
Model Refinement: Adapt and refine models based on new data and changing circumstances.
Iterative Analysis: Embrace an iterative approach to data analysis to maintain relevance and effectiveness.
Feedback Loop: Incorporate feedback from stakeholders and users to improve analytical processes and models.
Step 10: Ethical Considerations - Data Integrity and Responsibility
Data Privacy: Ensure that data handling respects individuals' privacy rights and complies with data protection regulations.
Bias Detection and Mitigation: Identify and mitigate bias in data and algorithms to ensure fairness.
Fairness: Strive for fairness and equitable outcomes in decision-making processes influenced by data.
Ethical Guidelines: Adhere to ethical and legal guidelines in all aspects of data analytics to maintain trust and credibility.
Data analytics is an exciting and profitable field that enables people and companies to use data to make wise decisions. You'll be prepared to start your data analytics journey by understanding the fundamentals described in this guide. To become a skilled data analyst, keep in mind that practice and ongoing learning are essential. If you need help implementing data analytics in your organization or if you want to learn more, you should consult professionals or sign up for specialized courses. The ACTE Institute offers comprehensive data analytics training courses that can provide you the knowledge and skills necessary to excel in this field, along with job placement and certification. So put on your work boots, investigate the resources, and begin transforming.
21 notes
·
View notes
Text
Uuuugh the backup service I tried uses AI so I cancelled that, and the external HDD I have is from like 2015 so that's not gonna work.
How the fuck do people back up their data these days???
3 notes
·
View notes
Text

Thursday, January 18, 2024
I had a super duper fun day updating two years of contacts and linking them to accession records in the PastPerfect database. I got to help our curatorial assistant install a popup exhibit too but that didn't take nearly as long as expected.
3 notes
·
View notes
Text
THE IMPORTANCE OF DATA MANAGEMENT AND DATA SECURITY IN HEALTHCARE
Data is the lifeblood of the healthcare industry. It encompasses patient records, treatment plans, medical histories, and an array of vital information that healthcare providers rely on to deliver the best possible care. As the healthcare landscape becomes increasingly digital, the importance of data management and data security has never been more critical. In this Blog, we’ll delve into the significance of safeguarding patient data and how E_care, a leader in healthcare management software, prioritizes data security to protect sensitive patient information.
Preserving Patient Confidentiality:
Compliance with Data Protection Regulations:
The Importance of Data Management & Data Security in Healthcare
Data Encryption:
Access Control:
Data Backups and Recovery:
Security Audits and Monitoring:
Education and Training:
Data Security as a Competitive Advantage:
E Care Hospital Management Software
Our Social medias:
LinkedIn: E CARE - Hospital Management Software
Facebook: E-care
Instagram: e_care_hms
X: E-Care Hospital Management Software
#e care#hms#hospital management software#hospital management system#health#data management#data security
3 notes
·
View notes
Text
4 notes
·
View notes
Text
Ughhhhh there's one thing I really fucking hate about Spotify (and probably affects other streaming services too, ngl), where bands that have broken up or ended are still up on the service (good thing!!) but there's NO PROCEDURE IN PLACE??? if another artist with the same name turns up?
Case in point: My release radar for this week had some familiar faces in a blast-from-the-past fashion.

Which would be cool except HIM DISBANDED LIKE 6 YEARS AGO.
So why are they sitting on my release radar, Spotify?

The song is 1:54 by a electronica producer called Flannan, with three other artists ("HIM", "AK", "Calboy". AK seems to be an American hip-hop artist, also featured on other Flannan work, and Calboy is also another American rapper.)
It's some kind of rap/trap song. No sign of the metal band 'HIM' in sight.
(There's a certain amount of irony that through this, I did find that Ville Valo of HIM actually dropped a cover with Black Veil Brides of "Temple of Love" today. Like 9 hours kind of 'today'.)
I know it's probably some kind of really silly little background data glitchy thing but it's happened to like a good three or four artists I follow and it makes life in the Release Radar really frustrating.
#spotify#music#streaming#data management#PLEASE SPOTIFY FIX YOUR ARTIST LINKS I BEG#It could be user error from the artists end but surely spotify could put systems in place to make it not happen???#esp for bands that have broken up or won't produce anything under xyz name#(is this because the other group that comes to mind is BEAST/B2ST? yes.)#(they had to become Highlight and that's /fine/ but there's someone else using BEAST as a stagename and it's really frustrating)
3 notes
·
View notes
Text
Developing a Research question and creating personal codebook. Week 1 Homework
Upon reviewing the codebook for the NESARC study, my focus is primarily on alcohol abuse. I plan to utilize several variables, including the frequency and intensity of alcohol consumption, demographic factors, and lifestyle factors. Additionally, I intend to incorporate all relevant variables into my personal codebook for this research. I have printed following pages, 30,46,77, 125, 299, 316 so far and will print more as needed.
My topic is, “Association between alcohol abuse and chronic depression.”
While alcohol abuse serves as a solid initial focus, I recognize the necessity of clarifying my specific interests within this domain. After careful consideration, I find myself particularly intrigued by the relationship between the amount of alcohol consumed and the development of alcohol dependence. To facilitate this exploration, I augment my codebook to include variables that capture alcohol levels, such as frequency and intensity of alcohol consumption, as well as quantity and frequency. My second topic of interest revolves around the question, "What is the threshold at which a person becomes alcohol dependent?"
The article, “Alcohol consumption and major depression in the general population: the critical importance of dependence” emphasizes on the relationship between alcohol consumption and major depression. It is based on a longitudinal study of a large population cohort in Canada over 12 years. It evaluates different patterns of alcohol use and major depressive episodes (MDEs) using the Composite International Diagnostic Interview Short Form (CIDI-SF). The study found that respondents with alcohol dependence were at higher risk of MDE, but any alcohol consumption, exceeding guidelines for moderate drinking and binge drinking were not Respondents with MDE showed no increase of alcohol consumption, but the risk of alcohol dependence was elevated in depressed men.
The second article titled "Gender Differences in the Relation between Depressive Symptoms and Alcohol Problems: A Longitudinal Perspective" investigates the longitudinal relationship between depressive symptoms and alcohol problems, specifically focusing on gender differences. The study aims to clarify and extend previous research by examining whether depressive symptoms predict subsequent alcohol problems for females, while alcohol problems predict subsequent depressive symptoms for males. Overall, the study adds to the existing literature on the comorbidity of depression and alcohol problems and underscores the significance of considering gender-specific factors in understanding these relationships. It encourages further research in this domain to provide more comprehensive insights into the dynamic interplay between depressive symptoms and alcohol problems over time.
References:
Bulloch, A., Lavorato, D., Williams, J. & Patten, S. (2012). Alcohol consumption and major depression in the general population: the critical importance of dependence. Depress Anxiety, 29(12), 1058. 10.1002/da.22001.
Moscato, B. S., Russell, M., Zielezny, M., Bromet, E., Egri, G., Mudar, P., & Marshall, J. R. (1997). Gender Differences in the Relation between Depressive Symptoms and Alcohol Problems: A Longitudinal Perspective. American Journal of Epidemiology, 146(11), 966-974.
There is a positive association between alcohol abuse and chronic depression. Individuals who engage in higher levels of alcohol abuse, as indicated by increased frequency and intensity of alcohol consumption, are more likely to experience chronic depression compared to those with lower levels of alcohol abuse.
3 notes
·
View notes
Text
Integrating Salesforce? Watch out for these 7 common pitfalls and learn how to avoid them!
Inadequate planning, data management challenges, poor user adoption, and more. Discover the best strategies to overcome these obstacles and achieve a seamless Salesforce integration with GetOnCRM expertise.
#salesforce integration#salesforce#crmintegration#crm solution#businessimpact#data integration#data management#salesforce partner#technology#getoncrm
3 notes
·
View notes
Text
Alcohol Consumption and employment rate.
First Assignment
I've chosen the Gapminder data set. I think it would be interesting to see different aspects referred to the development of each country and the differences between them. I decided that I'm particularly interested in the relationship that could exist between alcohol consumption and employment rate over the countries and maybe other relationships like the suicide rate.
A good starting point to determine if there is a correlation between alcohol consumption and the employment rate per country is to identify the associated variables. I need to determine what it is about alcohol consumption that I am interested in. In this case, the first variables to consider are the employment rate and the alcohol consumption rate.
Another variable to consider could be the income per person because I think it relates to both variables, in the fact that the average income per person is related to the employment rate cause if there is a low employment rate, the average income per person is reduced possibly that produce an increase in the alcohol consumption rate, or maybe a high alcohol consumption rate produces a low employment rate and is reflected in the average income. I added to my codebook variables that reflect this data.


A second topic that is related to the first one is trying to find a correlation between alcohol consumption and the income per person and try to see if there exists some relation between them. I think it would be interesting to see if a high consumption of alcohol is related to a low income or vice versa. To make all this, I do a series of questions to explain what result I'm trying to obtain from the data for solving these questions, these questions were
Is a high alcohol consumption rate associated with a low employment rate?
Is alcohol consumption related to the average income per person?
High alcohol consumption is associated with low income?
Also, search on the internet to find research that has been done previously on this topic. And I found that this has been extensively studied, I selected a list of different articles referring to this topic, to use them to try to create a hypothesis. After looking at the different articles I figured out that is real that there exists a relationship between the level of alcohol consumption in a country and low employment rates, so I hypothesize that a high level of alcohol consumption is related to a low employment rate.
In summary, I've decided to work with the Gapminder dataset and try to find if there exists a correlation between the level of alcohol consumption and the employment rate.
For do this I selected the variables alcconsumption, employrate, and incomeperperson. And I hypothesize that a high level of alcohol consumption is related to a low employment rate.
References
Forcier, M. W. (1988). Unemployment and Alcohol Abuse: A Review. Journal of Occupational Medicine, 30(3), 246–251. http://www.jstor.org/stable/45007884
Rodriguez E, Lasch KE, Chandra P, et al
Family violence, employment status, welfare benefits, and alcohol drinking in the United States: what is the relation?
Journal of Epidemiology & Community Health 2001;55:172-178.
Rodriguez E, Lasch KE, Chandra P, Lee J. The relation of family violence, employment status, welfare benefits, and alcohol drinking in the United States. West J Med. 2001 May;174(5):317-23. doi 10.1136/ewjm.174.5.317. PMID: 11342506; PMCID: PMC1071386.
2 notes
·
View notes
Text
Linguistic Jobs: Interview with a Data Manager & Digital Archivist
This month’s interview is with Julia Miller, a Data Manager and Digital Archivist who uses their Linguistics background to archive high-quality endangered language materials. As a recent PhD graduate, I greatly appreciated Julia’s validating advice that the absence of a tenure-track position or a position in the tech industry does not qualify as “failing”. This message is on-brand for this series, as one of the intentions behind these interviews is to demonstrate that Linguistics training is applicable to lots of jobs, not just the academic ones. Additionally, this interview contains some refreshing and practical advice regarding postdoc and PhD management.
You can follow Julia on Twitter @Spectregraph.

What did you study at university?
I began my undergrad studies in Portland, focusing on art (printmaking) and languages (Russian, French, German, later adding Arabic and Latin). I loved languages and exploring the patterns; at this point I didn’t know about Linguistics. After a short break from school and a bit of reflection, I moved to Seattle, enrolled at the University of Washington, switched my area of study to Linguistics and ended up getting the hat-trick of degrees in Linguistics all from UW: BA (1998), MA (2003), and PhD (2013). My research focused on acoustic phonetics and sociolinguistics; my PhD project explored acoustic properties of lexical tone in two dialects of the Dene language Dane-zaa, spoken in NE British Columbia. During my MA and PhD studies, I was fortunate to have been part of the DOBES Documentation of Endangered Languages program, working on a collaborative documentation project of the Dane-zaa (Beaver) language, which offered funding for tuition and fieldwork, as well as providing me with training in field methods, language documentation & description, and archiving. When I was in the final stages of writing my PhD thesis, I relocated to Australia and began working with PARADISEC, based at their node at the Australian National University (ANU), in order to expand what I knew about digital language archives, building upon what I learned working with the Language Archive for the Beaver DOBES project. I then received a Postdoctoral fellowship at the ANU**, working on another DOBES-funded collaborative documentation project, working with the languages of the Morehead District, Nen, Komnzo, Idi, Nmbo, spoken in the Western Province in Papua New Guinea. The postdoc work included phonetic analyses, sociolinguistic interviews, mapping projects, as well data management and archiving. Despite my love of phonetic description and social network analysis, by the time I submitted my PhD thesis, it was clear that I was more interested in data management and archiving than in linguistic analyses. This was a difficult, yet freeing revelation.
**I do NOT suggest starting a postdoc when you are still writing your completely unrelated PhD thesis! I submitted my thesis in between field trips to PNG.
What is your job?
I am the senior data manager for the ARC Centre of Excellence for the Dynamics of Language (CoEDL) as well as a digital archivist for the Pacific and Regional Archive for Digital Sources in Endangered Cultures (PARADISEC). I facilitate the archiving of indigenous and minority language digital material collected by CoEDL members and affiliates from the region, as well as other PARADISEC depositors world-wide. I offer training for researchers, students, and anyone interested in data management and archiving procedures. I liaise with other archives, cultural institutions, and language centres for collaboration. Despite not holding an academic position, teaching is still a large part of my daily work; I offer guest lectures in Field Methods and Digital Humanities courses and run intensive training sessions in digital archiving and data management for university researchers and job placement participants. I have developed curricula, technical workflows and archiving best-practice advice for audiences with different skillsets and goals. I also manage audio and manuscript digitising studios, where we digitise audio cassettes, reel-to-reel tapes, and field notebooks, etc. and I maintain a lending library of field equipment and offer training and advice.
How does your linguistics training help you in your job?
It would appear that my entire PhD path has prepared me for my current job. All the training I received in fieldwork, collaborative research, language documentation & description, and archiving allows me to understand the work our depositors are carrying out. I can offer informed advice and try to anticipate issues they may face in the field regarding data management, equipment failures, etc. And having archived my own materials in multiple archives, I can offer commiseration (and advice) as someone who has had to create metadata databases, follow strict formatting guidelines for A/V files, and adhere to deadlines based on funding agreements.
What was the transition from university to work like for you?
I am still working at a university, but the transition from an academic role to what is considered a non-academic role has been a bit of a challenge. I find I still do a lot of research for my work, and then try to pass on what I have learned in training modules and technical writing projects. I am fortunate to be in an environment that allows me to carry out what could be considered ‘supplemental’ work. Knowing that teaching and outreach are very important to me will help me on my career path as it evolves.
Do you have any advice you wish someone had given to you about linguistics/careers/university?
As a MA/PhD student, I would have loved to have been told of career options outside of Academia (or Big Tech), or even just been reassured that it is a valid option to not pursue tenure track jobs. I think many of my cohorts and I felt as if we failed or let down our professors by not getting a tenure track position in Linguistics. I’m glad to see that the culture of academia is changing and that there is support and advice made more available to students now.
Related interviews:
Interview with a Metadata Specialist and Genealogist
Interview with a Data Scientist
Interview with a Museum Curator
Interview with a Librarian
Interview with a Computational Linguist
Recent interviews:
Interview with a Natural Language Annotation Lead
Interview with an EMLS/Linguistics instructor & mother of four
Interview with a Performing Artiste and Freelance Editor
Interview with a Hawaiian and Tahitian language Instructor, Translator & Radio Host
Interview with a Customer Success Manager
Resources:
The full Linguist Jobs Interview List
The Linguist Jobs tag for the most recent interviews
The Linguistics Jobs slide deck (overview, resources and activities)
The Linguistics Jobs Interview series is edited by Martha Tsutsui Billins. Martha is a linguist whose research focuses on the Ryukyuan language Amami Oshima, specifically honourifics and politeness strategies in the context of language endangerment. Martha runs Field Notes, a podcast about linguistic fieldwork.
#data management#digital archivist#digital archiving#language archiving#endangered language archiving#ling jobs#linguist#language#linguistics#linguistics jobs#archiving
103 notes
·
View notes
Text
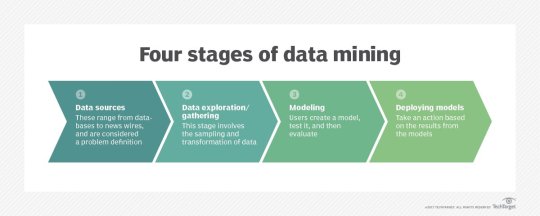
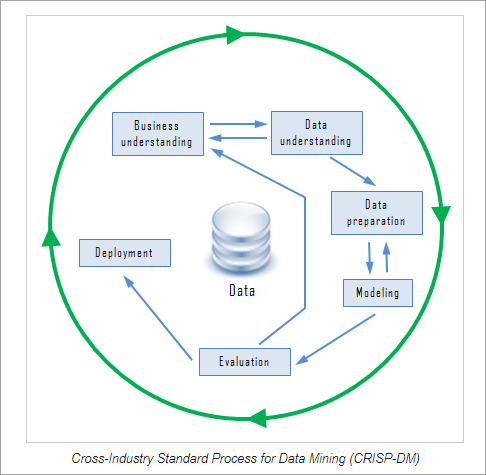
Data gathering. Relevant data for an analytics application is identified and assembled. The data may be located in different source systems, a data warehouse or a data lake, an increasingly common repository in big data environments that contain a mix of structured and unstructured data. External data sources may also be used. Wherever the data comes from, a data scientist often moves it to a data lake for the remaining steps in the process.
Data preparation. This stage includes a set of steps to get the data ready to be mined. It starts with data exploration, profiling and pre-processing, followed by data cleansing work to fix errors and other data quality issues. Data transformation is also done to make data sets consistent, unless a data scientist is looking to analyze unfiltered raw data for a particular application.
Mining the data. Once the data is prepared, a data scientist chooses the appropriate data mining technique and then implements one or more algorithms to do the mining. In machine learning applications, the algorithms typically must be trained on sample data sets to look for the information being sought before they're run against the full set of data.
Data analysis and interpretation. The data mining results are used to create analytical models that can help drive decision-making and other business actions. The data scientist or another member of a data science team also must communicate the findings to business executives and users, often through data visualization and the use of data storytelling techniques.
Types of data mining techniques
Various techniques can be used to mine data for different data science applications. Pattern recognition is a common data mining use case that's enabled by multiple techniques, as is anomaly detection, which aims to identify outlier values in data sets. Popular data mining techniques include the following types:
Association rule mining. In data mining, association rules are if-then statements that identify relationships between data elements. Support and confidence criteria are used to assess the relationships -- support measures how frequently the related elements appear in a data set, while confidence reflects the number of times an if-then statement is accurate.
Classification. This approach assigns the elements in data sets to different categories defined as part of the data mining process. Decision trees, Naive Bayes classifiers, k-nearest neighbor and logistic regression are some examples of classification methods.
Clustering. In this case, data elements that share particular characteristics are grouped together into clusters as part of data mining applications. Examples include k-means clustering, hierarchical clustering and Gaussian mixture models.
Regression. This is another way to find relationships in data sets, by calculating predicted data values based on a set of variables. Linear regression and multivariate regression are examples. Decision trees and some other classification methods can be used to do regressions, too
Data mining companies follow the procedure
#data enrichment#data management#data entry companies#data entry#banglore#monday motivation#happy monday#data analysis#data entry services#data mining
4 notes
·
View notes
Text
2 notes
·
View notes
Text
How to Make Check Marks in Google Sheets
Improve your productivity and organization skills in Google Sheets with checkboxes! This powerful tool can enhance the visual appeal of your spreadsheets and streamline your workflow for task management and data analysis. Creating checkboxes is simple and straightforward. Whether you're a professional, student, or entrepreneur, incorporating checkboxes into your Google Sheets can make a huge impact on your productivity and efficiency.
5 notes
·
View notes
Last Seen Blogs

fastf00dgarbage
Hi! Name's salty~

newjerseyvapecarts
New Jersey Vape Carts


elitesesthetic1
Best Dental Clinic in Antalya Turkey

bipolarblogss
Bipolar Blogs