#Rstats
Photo
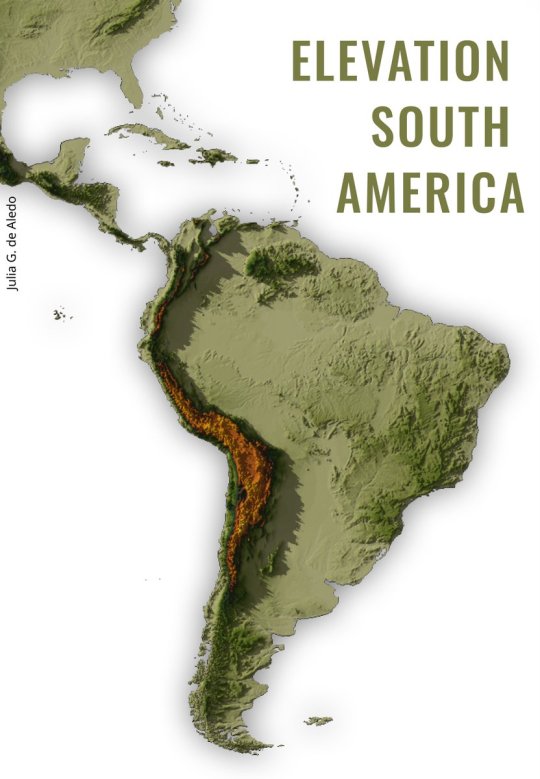
Elevation Map South America #rayshader #rstats
by @juliagdealedo
155 notes
·
View notes
Text
The Fugazi 1988 Spring USA Tour, from 1988-04-15 to 1988-06-05, consisted of 24 shows in 51 days, with a total attendance of about 3095 people. This was the band's first major tour. It was after this tour that the Fugazi EP was recorded.
The animation timescale is 1:86400 (1 second represents 1 day). The map shows a rolling week of data, where the date shown on the timeline is the first day of the week. A few bits may be hard to follow due to extended periods without shows which cause the animation to jump abruptly from one place to another.
Source: https://alexmitrani.shinyapps.io/Repeatr-app/
15 notes
·
View notes
Text
Exploratory Analysis of Google Search Trends for 'microclots' from 2015-2023: Part 1
Tracking a reported increase in Google searches for "microclots", part 1 of an exploratory analysis of public interest in COVID-19 over time
Tweet about this Analysis
Tracking #Covid19: #Google searches for #microclots were up 23% for the last week of April 2023 👀 Interested? Learn more in this brief #article by Dr. Heather Sue M. Rosen discussing part 1 of her #ExploratoryAnalysis of search trends for microclots! #TeamClotsTweet
View the Analysis on RPubs
Take me to RPubs by hsuemrosen
Submit Content for Feature on…

View On WordPress
#RStats#covid#COVID-19#data analysis#data collection#data manipulation#data science#data visualization#data viz#examples#Google Trends#GtrendsR#long covid#microclots#pandemic#post covid#R#R code#R Studio#time series
4 notes
·
View notes
Text
Unlock the World of Data Analysis: Programming Languages for Success!
💡 When it comes to data analysis, choosing the right programming language can make all the difference. Here are some popular languages that empower professionals in this exciting field
https://www.clinicalbiostats.com/
🐍 Python: Known for its versatility, Python offers a robust ecosystem of libraries like Pandas, NumPy, and Matplotlib. It's beginner-friendly and widely used for data manipulation, visualization, and machine learning.
📈 R: Built specifically for statistical analysis, R provides an extensive collection of packages like dplyr, ggplot2, and caret. It excels in data exploration, visualization, and advanced statistical modeling.
🔢 SQL: Structured Query Language (SQL) is essential for working with databases. It allows you to extract, manipulate, and analyze large datasets efficiently, making it a go-to language for data retrieval and management.
💻 Java: Widely used in enterprise-level applications, Java offers powerful libraries like Apache Hadoop and Apache Spark for big data processing. It provides scalability and performance for complex data analysis tasks.
📊 MATLAB: Renowned for its mathematical and numerical computing capabilities, MATLAB is favored in academic and research settings. It excels in data visualization, signal processing, and algorithm development.
🔬 Julia: Known for its speed and ease of use, Julia is gaining popularity in scientific computing and data analysis. Its syntax resembles mathematical notation, making it intuitive for scientists and statisticians.
🌐 Scala: Scala, with its seamless integration with Apache Spark, is a valuable language for distributed data processing and big data analytics. It combines object-oriented and functional programming paradigms.
💪 The key is to choose a language that aligns with your specific goals and preferences. Embrace the power of programming and unleash your potential in the dynamic field of data analysis! 💻📈
#DataAnalysis#ProgrammingLanguages#Python#RStats#SQL#Java#MATLAB#JuliaLang#Scala#DataScience#BigData#CareerOpportunities#biostatistics#onlinelearning#lifesciences#epidemiology#genetics#pythonprogramming#clinicalbiostatistics#datavisualization#clinicaltrials
3 notes
·
View notes
Text
Why are there not so many #rstats people on Tumblr! Please come here
6 notes
·
View notes
Text
When I started learning R, I created some simple functions for data-cleaning tasks that I planned to use frequently. I use to copy and paste those functions in my scripts (r files) to clean various data sets. 🤷🏻♀️
Then I realized there might be a better way to do the job. Copy-pasting every time is annoying!
Soon I found there was a simple & elegant solution to this😎
Do you want to learn what’s that?
📌You can save your function(s) in separate R script(s) and source the script when needed.
You can follow these steps
👉 Write your function(s) [e.g., func1] in a new script myfunc.R [𝐈𝐧 𝐭𝐡𝐢𝐬 𝐬𝐜𝐫𝐢𝐩𝐭, 𝐲𝐨𝐮 𝐨𝐧𝐥𝐲 𝐤𝐞𝐞𝐩 𝐲𝐨𝐮𝐫 𝐟𝐮𝐧𝐜𝐭𝐢𝐨𝐧(𝐬)]
👉In other R files, where you intend to use this function, you can simply source it using the 𝐬𝐨𝐮𝐫𝐜𝐞() function.
👉 Try running this code 𝐬𝐨𝐮𝐫𝐜𝐞(𝐦𝐲𝐟𝐮𝐧𝐜.𝐑)
👉 you’ll see the function(s) is loaded to your global environment.
💡 Modularizing your code makes it easier to read & debug. Start practicing it now.
2 notes
·
View notes
Photo
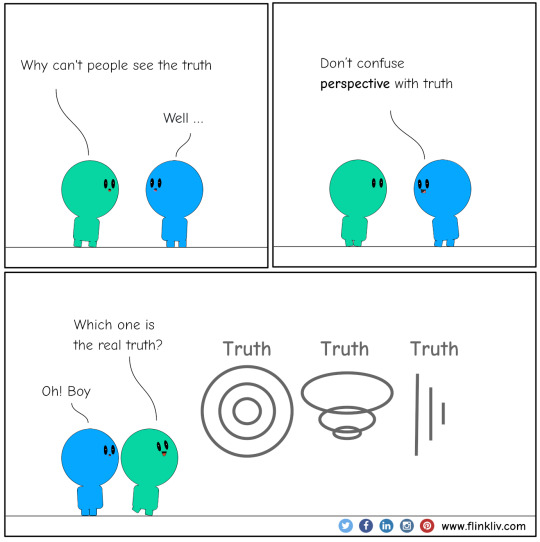
Be sure to understand the difference between truth and perspective 😮
Read more: https://flinkliv.com/
#Conflictmanagement#Cognitivebias#flinkliv#truth#Konflikthåndtering#Kognitivskjevhet#RStats#a11y#DataScience#Rbloggers
2 notes
·
View notes
Text
R in data science is a programming language used for statistical analysis, data visualization, and machine learning tasks.
Stay tuned for the next post!
know more: https://www.analyticsshiksha.com
#RProgramming#DataScienceTools#DataAnalysis#super30#artofproblemsolving#analyticsshiksha#checkyoureligibilty#super30dataanalyticsprogram#StatisticalProgramming#DataVisualization#DataScienceBasics#RStats#DataAnalytics#DataScientists#DataDrivenDecisions#StatisticalAnalysis#DataScienceSkills#ProgrammingLanguage#DataMining#MachineLearning#DataAnalysisTools#DataScienceCommunity#DataScienceEducation#DataScienceTutorials#StatisticalModels#RProgrammingLanguage#DataScienceBeginner#DataScienceInsights
0 notes
Text
📚 Exploring the Power of CiteDrive: A Game-Changer in Literature Management
Hey fellow researchers, writers, and literature enthusiasts! Are you looking for a straightforward way to manage your BibTeX entries for your next Overleaf project? Check out CiteDrive: a game-changing, free online literature management program designed to simplify and enhance your research and writing journey. 📚✨
🌐 Online Convenience: CiteDrive operates as a browser app, making it accessible anytime, anywhere. This online literature management program understands the importance of flexibility, catering to users who prefer a web-based solution. No more worrying about compatibility issues or system requirements!
🔄 Project-Based Organization: One standout feature of CiteDrive is its project-based structure. This allows users to meticulously organize their literature for specific projects, whether it's an essay, a paper, a book, or any other scholarly work. The focused approach enhances productivity and streamlines the research process.
🤝 Collaboration at its Core: CiteDrive isn't just a solo player; it's a team player too! Users can invite colleagues to projects, fostering collaboration in creating, maintaining, and commenting on a literature database. The ability to work together seamlessly enhances the collective knowledge pool.
📑 BibTeX Mastery: CiteDrive speaks the language of academics – BibTeX. The program supports BibTeX and allows users to leverage its unique types, fields, citation keys, extensions, and alternatives like BibLaTeX, Natbib, and Jurabib. It's a haven for LaTeX users, providing a familiar and efficient environment.
🔍 Extensive Database Access: Say goodbye to the endless search for articles and books. CiteDrive grants access to a vast database of literature, all conveniently available in the BibTeX format. Adding and managing references has never been easier!
🌐 Browser Extensions for Seamless Bookmarking: CiteDrive takes user convenience to the next level with browser extensions for Chrome, Edge, and Firefox. Save articles, web pages, or blog posts directly as a BibTeX bookmark, ensuring that no valuable source is ever lost.
🤝 Overleaf Integration: For those in the LaTeX world, rejoice! CiteDrive seamlessly integrates with Overleaf. References (BibTeX entries) can be filtered and inserted with ease. Plus, any changes made in the CiteDrive database are automatically synchronized with Overleaf, ensuring a smooth workflow.
Try out for free now: https://app.citedrive.com/
#CiteDrive #LiteratureManagement #ResearchRevolution #TeXLaTeX #BibTeX #BibLaTeX #Natbib #RStats #Rstudio #RMarkdown #QuartoPub #Overleaf
1 note
·
View note
Text
Essential Programming Languages needed for Data Science Majors
Data science master’s applicants often wonder what key programming know-how is essential for succeeding in quantitative heavy coursework. While statistics and calculus set the math foundation–these coding languages prime practical application readiness boosting employability later.
Python’s simplicity allows rapid insights generation from manipulating datasets, visualizing trends and building machine learning models demanded by tech recruiters. R’s open-source power and packages repository fuels deeper statistical analysis, predictive models and data visualization sophistication expected in research.
SQL querying skills extract and organize complex datasets for modeling. Shell scripting in Linux environments standardizes large scale cloud data ops. Familiarity using data visualization tools like Tableau which generate interactive reports are valued too.
While degrees cover platform specific training–having base proficiency to logically structure, analyze, make inferences and communicate data-driven findings using these languages accelerates real-world learning application across projects.
#datascience #programming #python #rstats
#SQLskills #shellscripting #tableau #realworldlearning
#visualizingtrends #envoyoverseas #ethicalcounselling
#envoyeducation
-Hithika Mekala
Disclaimer: The perspectives shared in this blog are not intended to be prescriptive. They should act merely as viewpoints to aid overseas aspirants with helpful guidance. Readers are encouraged to conduct their own research before availing the services of a consultant.
#datascience#programming#python#rstats#SQLskills#shellscripting#tableau#realworldlearning#visualizingtrends#envoyoverseas#ethicalcounselling#envoyeducation#programming languages
0 notes
Text
0 notes
Photo
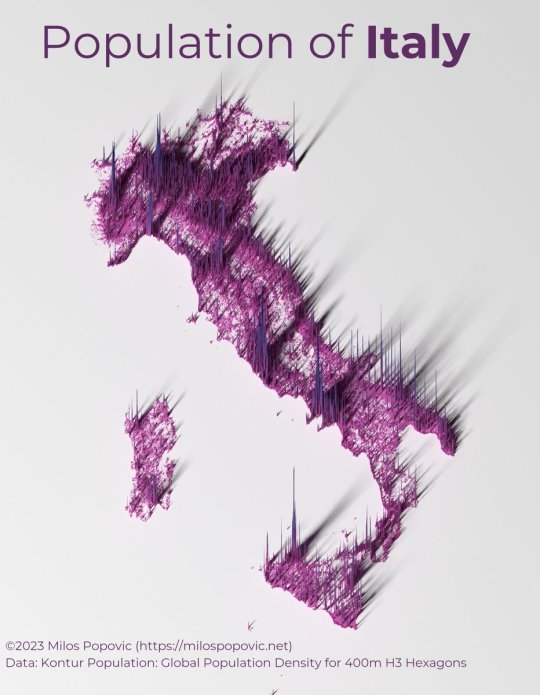
Italy population density.
by @milos_agathon
143 notes
·
View notes
Text
#AI#BigData#CloudComputing#DataAnalytics#DataPlatforms#DataScience#IoT#IIoT#PyToh#Python#RStats#TensorFlow#Java#JavaScript#ReactJS#GoLang#Serverless#4typesofdataanalytics#analytics#awsiotanalytics#bigdata#bigdataanalytics#dataanalysis#dataanalytics#dataanalyticscareer#dataanalyticsjob#dataanalyticsproject#dataanalyticsroadmap#dataanalyticstrends#datahandlinginiot
0 notes
Text
Streamlining Export Diversification Analysis with R: A Guide to Minimizing Calculation Workload with Tidyverse Across and Pivoting Functions
Maximize export success with R! Learn how to calculate export diversification and similarity indices using Tidyverse and pivoting. Get a comprehensive understanding of the data and insights for a successful export strategy. Read now!
An In-Depth Look at How to Efficiently Measure a Country’s Export Diversification with R
Introduction:
Export diversification is a crucial aspect for the development of many countries, especially developing nations. These countries are often heavily reliant on a small number of primary commodities for their export earnings, leaving them vulnerable to market fluctuations and unstable prices.…

View On WordPress
0 notes
Last Seen Blogs

samjane
samantha jane.

gooseberryjam
baaaffo

svrina
*sigh*

ikupo
iKupo

wifesbits
some random pictures