#PyCharm
Text

What kind of IDE do use in your project?
About me, I especially use VS Code due to its convenience and flexibility.
20 notes
·
View notes
Text
Visual Studio Code got offended because I used PyCharm to code and now refuses to push files to git… 😭

7 notes
·
View notes
Text
youtube
4 notes
·
View notes
Text
Current status of the database code: Bit fucked lol
0 notes
Text
Today, Python is one of the most prominent programming languages for web applications. Whether it’s building an AI and ML application or making an app with Django web development, Python is gaining global popularity. You can use Python for building scalable and rapid web applications. From ERP apps to B2C web apps, a Python development company can develop all kinds of applications for you. Python Development Companies are gaining popularity in the global development market. Python is a dynamic, object-oriented, and undoubtedly, a veteran programming language. Python Development Companies understand that this programming language enables the swift completion of tasks, allowing you to merge systems effectively.
0 notes
Text
Programs used for Programming in 2023
I didn’t really use any new programs this year. I just continued expanding on programs I’ve used in the past.
Python
For Python I continued to mostly use Pycharm. I’ve spoken about it for the past few years, but JetBrains continues to add features that make it easier to work with Python. For example, this year they added a model explorer to have better visibility into your models in Django.…

View On WordPress
0 notes
Text
[Hướng dẫn] Debug PyTest qua venv trên PyCharm
Bước 1: Chọn ở góc 5h vào intepreter hiện tại, click add new interpreter, add local interpreter
Continue reading Untitled

View On WordPress
0 notes
Text
how the fuck do i make a game in python qwq
im shit at math but i wanna learn how to code and make a video game so bad help
1 note
·
View note
Text
Supercharge Your Coding with GitHub Copilot: The Future of Intelligent Autocompletion
As a beginner software developer, you may find the process of writing long and monotonous code both boring and time-consuming. You might wonder if there are any AI tools available that can alleviate these coding challenges and make your work easier. Well,

View On WordPress
#AI#AI tool#artificial intelligence#Coding#coding problems#Developers#Framework#GitHub#GitHub account#GitHub Copilot#GitHub Copilot Pricing#IDEs#OpenAI#OpenAI Codex#Programming#Programming Languages#PyCharm#Software Developers#Technology#VS Code
0 notes
Text
Last- und Performance Testing mit Python Request

Ihr kennt das Problem sicherlich auch, der Kunde will "mal eben" einen Last und Performance Test durchführen, um an Ergebnisse zu kommen. Meistens wird dazu immer noch Jmeter genutzt, aber ich zeige euch wie man mit diesem Python Skript viel umfassender und flexibler arbeiten kann. Die Anpassungen sind für jedes mögliches Szenario auslegbar, selbst ich habe noch nicht alle Möglichkeiten dieses Skriptes hier entsprechend angepasst.
Einige Ziele, die ich noch nicht umgesetzt habe:
- Grafisches Reporting ähnlich Jmeter
- Besseres Reporting in HTML oder PDF
import requests
import threading
import time
import csv
from tqdm import tqdm
import statistics
import logging
# Todo:
## 1. Logging
## 2. CSV-Datei
## 3. Statistiken
## 4. Auswertung
## 5. Ausgabe
## 6. Dokumentation
## 7. Testen
#Author: Frank Rentmeister 2023
#URL: https://example.com
#Date: 2021-09-30
#Version: 1.0
#Description: Load and Performance Tooling
# Set the log level to DEBUG to log all messages
LOG_FORMAT = '%(asctime)s - %(name)s - %(levelname)s - %(message)s - %(threadName)s - %(thread)d - %(lineno)d - %(funcName)s - %(process)d - %(processName)s - %(levelname)s - %(message)s - %(pathname)s - %(filename)s - %(module)s - %(exc_info)s - %(exc_text)s - %(created)f - %(relativeCreated)d - %(msecs)d - %(thread)d - %(threadName)s - %(process)d - %(processName)s - %(levelname)s - %(message)s - %(pathname)s - %(filename)s - %(module)s - %(exc_info)s - %(exc_text)s - %(created)f - %(relativeCreated)d - %(msecs)d - %(thread)d - %(threadName)s - %(process)d - %(processName)s - %(levelname)s - %(message)s - %(pathname)s - %(filename)s - %(module)s - %(exc_info)s - %(exc_text)s - %(created)f - %(relativeCreated)d - %(msecs)d - %(thread)d - %(threadName)s - %(process)d - %(processName)s - %(levelname)s - %(message)s - %(pathname)s - %(filename)s - %(module)s - %(exc_info)s - %(exc_text)s - %(created)f - %(relativeCreated)d - %(msecs)d'
logging.basicConfig(level=logging.DEBUG, format=LOG_FORMAT, filename='Load_and_Performance_Tooling/Logging/logfile.log', filemode='w')
logger = logging.getLogger()
# Example usage of logging
logging.debug('This is a debug message')
logging.info('This is an info message')
logging.warning('This is a warning message')
logging.error('This is an error message')
logging.critical('This is a critical message')
logging.info('This is an info message with %s', 'some parameters')
logging.info('This is an info message with %s and %s', 'two', 'parameters')
logging.info('This is an info message with %s and %s and %s', 'three', 'parameters', 'here')
logging.info('This is an info message with %s and %s and %s and %s', 'four', 'parameters', 'here', 'now')
logging.info('This is an info message with %s and %s and %s and %s and %s', 'five', 'parameters', 'here', 'now', 'again')
logging.info('This is an info message with %s and %s and %s and %s and %s and %s', 'six', 'parameters', 'here', 'now', 'again', 'and again')
logging.info('This is an info message with %s and %s and %s and %s and %s and %s and %s', 'seven', 'parameters', 'here', 'now', 'again', 'and again', 'and again')
logging.info('This is an info message with %s and %s and %s and %s and %s and %s and %s and %s', 'eight', 'parameters', 'here', 'now', 'again', 'and again', 'and again', 'and again')
logging.info('This is an info message with %s and %s and %s and %s and %s and %s and %s and %s and %s', 'nine', 'parameters', 'here', 'now', 'again', 'and again', 'and again', 'and again', 'and again')
# URL to test
url = "https://example.com"
assert url.startswith("http"), "URL must start with http:// or https://" # Make sure the URL starts with http:// or https://
#assert url.count(".") >= 2, "URL must contain at least two periods" # Make sure the URL contains at least two periods
assert url.count(" ") == 0, "URL must not contain spaces" # Make sure the URL does not contain spaces
# Number of users to simulate
num_users = 2000
# Number of threads to use for testing
num_threads = 10
# NEW- Create a list to hold the response times
def simulate_user_request(url):
try:
response = requests.get(url)
response.raise_for_status() # Raise an exception for HTTP errors
return response.text
except requests.exceptions.RequestException as e:
print("An error occurred:", e)
# Define a function to simulate a user making a request
def simulate_user_request(thread_id, progress, response_times):
for i in tqdm(range(num_users//num_threads), desc=f"Thread {thread_id}", position=thread_id, bar_format="{l_bar}{bar:20}{r_bar}{bar:-10b}", colour="green"):
try:
# Make a GET request to the URL
start_time = time.time()
response = requests.get(url)
response_time = time.time() - start_time
response.raise_for_status() # Raise exception if response code is not 2xx
response.close() # Close the connection
# Append the response time to the response_times list
response_times.append(response_time)
# Increment the progress counter for the corresponding thread
progress += 1
except:
pass
# Define a function to split the load among multiple threads
def run_threads(progress, response_times):
# Create a list to hold the threads
threads =
# Start the threads
for i in range(num_threads):
thread = threading.Thread(target=simulate_user_request, args=(i, progress, response_times))
thread.start()
threads.append(thread)
# Wait for the threads to finish
for thread in threads:
thread.join()
# Define a function to run the load test
def run_load_test():
# Start the load test
start_time = time.time()
response_times =
progress = * num_threads # Define the progress list here
with tqdm(total=num_users, desc=f"Overall Progress ({url})", bar_format="{l_bar}{bar:20}{r_bar}{bar:-10b}", colour="green") as pbar:
while True:
run_threads(progress, response_times) # Pass progress list to run_threads
total_progress = sum(progress)
pbar.update(total_progress - pbar.n)
if total_progress == num_users: # Stop when all users have been simulated
break
time.sleep(0.1) # Wait for threads to catch up
pbar.refresh() # Refresh the progress bar display
# NEW - Calculate the access time statistics
mean_access_time = statistics.mean(response_times)
median_access_time = statistics.median(response_times)
max_access_time = max(response_times)
min_access_time = min(response_times)
# NEW -Print the access time statistics
print(f"Mean access time: {mean_access_time:.3f} seconds")
print(f"Median access time: {median_access_time:.3f} seconds")
print(f"Maximum access time: {max_access_time:.3f} seconds")
print(f"Minimum access time: {min_access_time:.3f} seconds")
#todo: Save the load test results to a CSV file (think about this one)
# hier werden die Zugriffszeiten gesammelt
#access_times = {
# 'https://example.com': ,
# 'https://example.org': ,
# 'https://example.net':
#}
# Calculate the duration of the load test
duration = time.time() - start_time
# Calculate access times and performance metrics
access_times = )/num_threads for i in range(num_users//num_threads)]
mean_access_time = sum(access_times)/len(access_times)
median_access_time = sorted(access_times)
max_access_time = max(access_times)
min_access_time = min(access_times)
throughput = num_users/duration
requests_per_second = throughput/num_threads
# Print the load test results
print(f"Mean access time: {mean_access_time*1000:.2f} milliseconds")
print(f"Load test duration: {duration:.2f} seconds")
print(f"Mean access time: {mean_access_time:.3f} seconds")
print(f"Median access time: {median_access_time:.3f} seconds")
print(f"Maximum access time: {max_access_time:.3f} seconds")
print(f"Minimum access time: {min_access_time:.3f} seconds")
print(f"Throughput: {throughput:.2f} requests/second")
print(f"Requests per second: {requests_per_second:.2f} requests/second")
print(f"Number of users: {num_users}")
print(f"Number of threads: {num_threads}")
print(f"Number of requests per user: {num_users/num_threads}")
print(f"Number of requests per thread: {num_users/num_threads/num_threads}")
print(f"Number of requests per second: {num_users/duration}")
print(f"Number of requests per second per thread: {num_users/duration/num_threads}")
print(f"Number of requests per second per user: {num_users/duration/num_users}")
print(f"Total duration: {duration:.2f} seconds")
print(f"Total progress: {sum(progress)}")
print(f"Total progress per second: {sum(progress)/duration:.2f}")
print(f"Total progress per second per thread: {sum(progress)/duration/num_threads:.2f}")
print(f"Total progress per second per user: {sum(progress)/duration/num_users:.2f}")
print(f"Total progress per thread: {sum(progress)/num_threads:.2f}")
print(f"Total progress per user: {sum(progress)/num_users:.2f}")
print(f"Total progress per request: {sum(progress)/num_users/num_threads:.2f}")
print(f"Total progress per request per second: {sum(progress)/num_users/num_threads/duration:.2f}")
print(f"Total progress per request per second per thread: {sum(progress)/num_users/num_threads/duration/num_threads:.2f}")
print(f"Total progress per request per second per user: {sum(progress)/num_users/num_threads/duration/num_users:.2f}")
print(f"Total progress per request per thread: {sum(progress)/num_users/num_threads:.2f}")
print(f"Total progress per request per user: {sum(progress)/num_users/num_threads:.2f}")
print(f"Total progress per second per request: {sum(progress)/duration/num_users/num_threads:.2f}")
print(f"Total progress per second per request per thread: {sum(progress)/duration/num_users/num_threads/num_threads:.2f}")
print(f"Total progress per second per request per user: {sum(progress)/duration/num_users/num_threads/num_users:.2f}")
# Save the load test results to a CSV file
with open("load_test_results.csv", "w", newline='') as csv_file:
fieldnames =
# Create a CSV writer
csv_writer = csv.DictWriter(csv_file, fieldnames=fieldnames, delimiter=",", quotechar='"', quoting=csv.QUOTE_MINIMAL)
csv_writer.writeheader()
# Write the load test results to the CSV file
csv_writer.writerow({"Metric": "Average Response Time (seconds)", "Value": mean_access_time, "Short Value": round(mean_access_time, 3)})
csv_writer.writerow({"Metric": "Load Test Duration (seconds)", "Value": duration, "Short Value": round(duration, 2)})
csv_writer.writerow({"Metric": "Mean Access Time (milliseconds)", "Value": mean_access_time * 1000, "Short Value": round(mean_access_time * 1000, 2)})
csv_writer.writerow({"Metric": "Median Access Time (seconds)", "Value": median_access_time, "Short Value": round(median_access_time, 3)})
csv_writer.writerow({"Metric": "Maximum Access Time (seconds)", "Value": max_access_time, "Short Value": round(max_access_time, 3)})
csv_writer.writerow({"Metric": "Minimum Access Time (seconds)", "Value": min_access_time, "Short Value": round(min_access_time, 3)})
csv_writer.writerow({"Metric": "Throughput (requests/second)", "Value": throughput, "Short Value": round(throughput, 2)})
csv_writer.writerow({"Metric": "Requests per Second (requests/second)", "Value": requests_per_second, "Short Value": round(requests_per_second, 2)})
csv_writer.writerow({"Metric": "Number of Users", "Value": num_users, "Short Value": num_users})
csv_writer.writerow({"Metric": "Number of Threads", "Value": num_threads, "Short Value": num_threads})
csv_writer.writerow({"Metric": "Number of Requests per User", "Value": num_users / num_threads, "Short Value": round(num_users / num_threads)})
csv_writer.writerow({"Metric": "Number of Requests per Thread", "Value": num_users / (num_threads * num_threads), "Short Value": round(num_users / (num_threads * num_threads))})
csv_writer.writerow({"Metric": "Number of Requests per Second", "Value": num_users / duration, "Short Value": round(num_users / duration)})
csv_writer.writerow({"Metric": "Number of Requests per Second per Thread", "Value": num_users / (duration * num_threads), "Short Value": round(num_users / (duration * num_threads))})
csv_writer.writerow({"Metric": "Number of Requests per Second per User", "Value": num_users / (duration * num_users), "Short Value": round(num_users / (duration * num_users))})
csv_writer.writerow({"Metric": "Number of Requests per Minute", "Value": num_users / duration * 60, "Short Value": round(num_users / duration * 60)})
csv_writer.writerow({"Metric": "Number of Requests per Minute per Thread", "Value": num_users / (duration * num_threads) * 60, "Short Value": round(num_users / (duration * num_threads) * 60)})
csv_writer.writerow({"Metric": "Number of Requests per Minute per User", "Value": num_users / (duration * num_users) * 60, "Short Value": round(num_users / (duration * num_users) * 60)})
csv_writer.writerow({"Metric": "Number of Requests per Hour", "Value": num_users / duration * 60 * 60, "Short Value": round(num_users / duration * 60 * 60)})
csv_writer.writerow({"Metric": "Number of Requests per Hour per Thread", "Value": num_users / (duration * num_threads) * 60 * 60, "Short Value": round(num_users / (duration * num_threads) * 60 * 60)})
csv_writer.writerow({"Metric": "Number of Requests per Hour per User", "Value": num_users / (duration * num_users) * 60 * 60, "Short Value": round(num_users / (duration * num_users) * 60 * 60)})
csv_writer.writerow({"Metric": "Number of Requests per Day", "Value": num_users / duration * 60 * 60 * 24, "Short Value": round(num_users / duration * 60 * 60 * 24)})
csv_writer.writerow({"Metric": "Number of Requests per Day per Thread", "Value": num_users / (duration * num_threads) * 60 * 60 * 24, "Short Value": round(num_users / (duration * num_threads) * 60 * 60 * 24)})
csv_writer.writerow({"Metric": "Number of Requests per Day per User", "Value": num_users / (duration * num_users) * 60 * 60 * 24, "Short Value": round(num_users / (duration * num_users) * 60 * 60 * 24)})
csv_writer.writerow({"Metric": "Number of Requests per Month", "Value": num_users / duration * 60 * 60 * 24 * 30, "Short Value": round(num_users / duration * 60 * 60 * 24 * 30)})
csv_writer.writerow({"Metric": "Number of Requests per Month per Thread", "Value": num_users / (duration * num_threads) * 60 * 60 * 24 * 30, "Short Value": round(num_users / (duration * num_threads) * 60 * 60 * 24 * 30)})
csv_writer.writerow({"Metric": "Number of Requests per Month per User", "Value": num_users / (duration * num_users) * 60 * 60 * 24 * 30, "Short Value": round(num_users / (duration * num_users) * 60 * 60 * 24 * 30)})
csv_writer.writerow({"Metric": "Number of Requests per Year", "Value": num_users / duration * 60 * 60 * 24 * 365, "Short Value": round(num_users / duration * 60 * 60 * 24 * 365)})
csv_writer.writerow({"Metric": "Number of Requests per Year per Thread", "Value": num_users / (duration * num_threads) * 60 * 60 * 24 * 365, "Short Value": round(num_users / (duration * num_threads) * 60 * 60 * 24 * 365)})
csv_writer.writerow({"Metric": "Number of Requests per Year per User", "Value": num_users / (duration * num_users) * 60 * 60 * 24 * 365, "Short Value": round(num_users / (duration * num_users) * 60 * 60 * 24 * 365)})
#csv_writer.writeheader() # Add an empty row to separate the access times from the metrics
#csv_writer.writerow({"Metric": "Access Time (seconds)", "Value": None})
# Write the access times to the CSV file
csv_writer.writerow({"Metric": "Access Time (seconds)", "Value": None})
for access_time in response_times:
csv_writer.writerow({"Metric": None, "Value": access_time})
# Sort the response times and write them to the CSV file
response_times.sort()
for response_time in response_times:
csv_writer.writerow({"Metric": None, "Value": response_time})
# Run the load test
run_load_test()
# Path: Load_and_Performance/test_100_user.py
##### Documentation #####
'''
- The script imports the necessary modules for load testing, such as requests for making HTTP requests, threading for running multiple threads simultaneously, time for measuring time, csv for reading and writing CSV files, tqdm for displaying a progress bar, statistics for calculating performance metrics, and logging for logging messages.
- The script defines the URL to test and checks that it starts with "http://" or "https://", that it contains at least two periods, and that it does not contain any spaces.
- The script sets the number of users to simulate and the number of threads to use for testing.
- The script defines a function called simulate_user_request() that simulates a user making a request to the URL. The function makes a GET request to the URL, measures the response time, and appends the response time to a list called response_times. The function also increments the progress counter for the corresponding thread. The function takes three arguments: thread_id, progress, and response_times.
- The script defines a function called run_threads() that splits the load among multiple threads. The function creates a list to hold the threads, starts each thread, and waits for all threads to finish. The function takes two arguments: progress and response_times.
- The script defines a function called run_load_test() that runs the load test. The function initializes the response_times list and a progress list that will keep track of the progress for each thread. The function then starts a progress bar using the tqdm module and enters a loop that runs until all users have been simulated. In each iteration of the loop, the function calls run_threads() to split the load among multiple threads, updates the progress bar, and waits for the threads to catch up.
Read the full article
0 notes
Text
Ki az az isten barma
aki egy IDE idáig normálisan működő menürendszerét mobiltelefonosra változtatja
Bazmeg komolyan a UI/UX tervezők a világ barmai
1 note
·
View note
Link
Python has an easy learning curve. However, there are many development tools to consider if you use Python to its full potential. This article introduces seven must-have Python tools for ML Devs and Data Scientists.
1 note
·
View note
Text
Create and Run Python Program using PyCharm
A Python-specific Integrated Development Environment (IDE) called PyCharm offers a large range of crucial features for Python developers.
Python programming can be done using the integrated development environment PyCharm. In addition to supporting Django web development, it offers code analysis, a graphical debugger, an integrated unit tester, integration with version control systems, and more.…

View On WordPress
0 notes
Text
خطوات إنشاء تطبيق Telegram الخاص بك
#تطبيق Telegram#إنشاء تطبيق#اللغة البرمجية#كود API#أداة تطوير البرامج#Visual Studio Code#PyCharm#تطوير المهارات#المفاهيم التقنية#المهارات البرمجية#Google Play Store#App Store.
0 notes
Text
How to Install Python and Anaconda/PyCharm
Hi everyone! Today’s blog post will cover how to install Python as well as some useful tools to make data analysis a bit easier. A like or share would be greatly appreciated as I’m just starting out and want to help folks out on their Public Health / Data Science Journey.
0 notes
Text
RabbitMQ in Depth
I write a bit of software here and there, but I do NOT self describe as a programmer. I am an integrator, a longtime systems guy who bolts stuff together using the "Unix way". I find things that mostly work, and which offer methods to chain them to other things, then at the very bitter end of solving a problem I might produce a little code. Given that I approach Python like a preschooler facing down his first pair of lace up shoes, it's probably for the best I don't show this stuff in public.
I've put a lot of energy into Open Semantic Search over the last few years and it was there I first encountered RabbitMQ. This piece of message oriented middleware was interesting to the point I also invested time in it, reading enough of RabbitMQ in Depth that I started refactoring my Twitter tracking system.

There's a Python library associated with the book, rabbitpy, but it's super minimal. I hit barriers with it and then wandered off to do other things. Recently I got the urge to tune up the Twitter stuff and as part of that I'm shifting to the amqpstorm library.
A lot of people start learning Python without the benefit of the computer science background I have. I see folks getting their feet wet with Jupyter Notebooks, which is a decent way to get an introduction, but I'm not sure how many of these new users are aware of the notions of a 1) integrated development environment that includes a 2) symbolic debugger.
I picked Pycharm for this role. This is a comprehensive IDE for Python, part of a family of similar tools from Jetbrains. It's enormously complex, but I wanted it for a few specific reasons:
It provides a context for working on more complex Python problems, as opposed to using shell/text editor and keeping that context in my head.
It has support for the Github version control service.
The symbolic debugger interface is much smoother than trying to use Python's native option from the command line.
So I'm revisiting the RabbitMQ book and the debugger offers a view like this into a simple script. Every command that creates an object in memory gets the blue stuff in brackets, which reveals the object type and a unique identifier:

And if you click that link you can see inside the object in question:
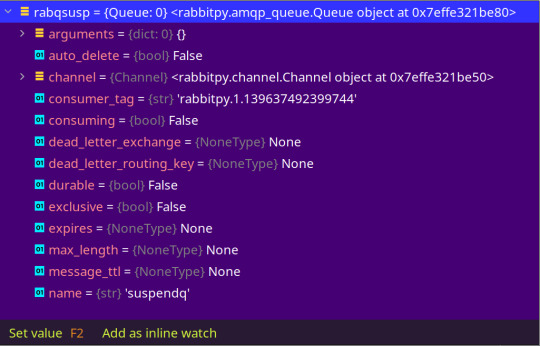
This is SO much easier than the CLI ritual of adding type(object) and dir(object) to a script, adding various programmatic probing, and then running the script again ... and again ... and yet AGAIN.
Did you notice the recurring mentions of what I call the integrator shuffle? I seldom sit down with something new and spend a lot of time exploring, instead I do just enough to get things running before I'm pulled away to some other task. Mastery, such as I may achieve, comes incrementally. Open Semantic Search was an exception - for that I had to build every component by hand in order to debug some stuff, so I got in pretty deep very quickly.
The world is changing. I'm surprised Twitter continues to run so smoothly, but I don't think it will last. The flood of Twitter refugees arriving on Mastodon is going to increase, but I expect Tumblr is going to claim a goodly portion of them. Automaticc can both scale up a platform and defended it against frivolous litigation. Whatever direction things go long term I suspect more time spent with a best of breed object broker is going to pay dividends for me.
0 notes
Last Seen Blogs

radiqueer
we kept dancing

renataoliveira28-blog
Sem título

theladycaroline
The Lady C

pablo-de-la-cruz
Incorrecto

peepoveta
vetapodcaster