#PowerBI consultants
Photo

"I am using excel in daily working but many things were unknown in excel which I have learnt in this session." - Pankaj Panchal Completed 2-Day workshop on "MS Excel to Boost Productivity" at Yanfeng Seating (India) Pvt. Ltd. (Supplier of MG Motors) We have covered, • Saving, Sharing, Protecting, Inspecting Workbook • Basic Formula & Functions • Cell Reference • Advanced Sorting & Filtering • Conditional Formatting • Data Validation • Advanced Formulas • Excel Charts & Excel Table • Dashboard Thank you Mr. Jay Gohil for giving this opportunity. 𝗪𝗮𝗻𝘁 𝘁𝗼 𝗱𝗼 𝗶𝘁 𝗳𝗼𝗿 𝘆𝗼𝘂𝗿 𝗼𝗿𝗴𝗮𝗻𝗶𝘇𝗮𝘁𝗶𝗼𝗻? 𝗽𝗹𝗲𝗮𝘀𝗲 𝗰𝗼𝗻𝘁𝗮𝗰𝘁 𝘂𝘀. 📧 : [email protected] 💬 : https://lnkd.in/dpTmMwzg 📞 : +91 98982 33268 🌐 : www.statmodeller.com #statmodeller #datascience #operationalexcellence #training #consultancy #statistics #powerbi #datavisualization #dataanalytics #dashboard #excel #microsoft #microsoftexcel #office #word #o #powerpoint #business #cursodeexcel #data #msexcel #powerbi #exceltips #datascience #microsoftoffice #dashboard #exceltraining #excelbasico #dataanalytics https://www.instagram.com/p/Cnvu-sNtcKX/?igshid=NGJjMDIxMWI=
#statmodeller#datascience#operationalexcellence#training#consultancy#statistics#powerbi#datavisualization#dataanalytics#dashboard#excel#microsoft#microsoftexcel#office#word#o#powerpoint#business#cursodeexcel#data#msexcel#exceltips#microsoftoffice#exceltraining#excelbasico
2 notes
·
View notes
Text
Complete Guide to Power BI Themes
As a data-driven organization, you understand the significance of presenting your insights in a visually appealing and cohesive manner. Power BI, Microsoft's business intelligence tool, offers a plethora of features to help you achieve this goal, including the ability to create and apply custom themes. In this comprehensive blog post, we'll dive into the world of Power BI themes, exploring their benefits, best practices, and practical examples to elevate your data storytelling game.
What are Power BI Themes?
Power BI themes are a powerful feature that allows you to define and apply a consistent look and feel across all your reports and dashboards. By customizing elements such as colors, fonts, and backgrounds, you can seamlessly align your data visualizations with your organization's branding guidelines. This not only enhances the professional appearance of your reports but also reinforces your brand identity, making it easier for stakeholders to recognize and engage with your data products.
Benefits of Using Power BI Themes
1. Consistency: Themes ensure a uniform appearance across all your Power BI reports, dashboards, and applications, fostering a cohesive user experience.
2. Branding: By incorporating your company's color palette, fonts, and logo, you can strengthen brand recognition and reinforce your organization's identity.
3. Professionalism: Well-designed themes elevate the overall presentation of your data, lending a polished and professional look to your reports.
4. Efficiency: Once you've created a theme, you can easily apply it to multiple reports, saving time and effort in maintaining a consistent visual language.
Creating a Custom Power BI Theme
Power BI offers a user-friendly interface for creating and managing themes. Here's a step-by-step guide to help you get started:
1. Launch the Theme Designer: Within the Power BI Desktop application, navigate to the "View" tab and select "Theme Designer."
2. Define Colors: Customize the color palette by selecting swatches and assigning specific colors to various elements, such as background, foreground, and accent colors.
3. Choose Fonts: Specify the font family, size, and weight for different text elements, including titles, labels, and data values.
4. Customize Background and Visuals: Adjust the background settings, including transparency and fill options, as well as visual properties like data point shapes and line styles.
5. Preview and Export: Use the live preview pane to visualize your changes and fine-tune the theme until you're satisfied. Once complete, export the theme as a JSON file for easy distribution and application across your organization.
Applying a Power BI Theme
Once you've created your custom theme, you can apply it to individual reports or to your entire Power BI environment. Here's how:
1. Apply to a Report: Within the Power BI Desktop application, open the desired report, navigate to the "View" tab, and select "Themes." From the drop-down menu, choose your custom theme.
2. Apply to the Environment: For a more comprehensive approach, you can deploy your theme to your Power BI environment, ensuring a consistent look and feel across all reports and dashboards. This process typically involves uploading the theme file to your Power BI service or working with a Power BI consultant or administrator.
Real-World Examples
To illustrate the power of Power BI themes, let's explore a few practical examples:
1. Corporate Branding: Imagine you're a multinational financial services company with a well-established brand identity. By creating a custom theme that incorporates your brand colors, fonts, and logos, you can ensure that all your Power BI reports and dashboards align with your corporate identity, fostering brand recognition and trust among stakeholders.
2. Industry-Specific Themes: If you operate in a highly regulated industry, such as healthcare or finance, you may have specific guidelines for data visualization and reporting. Power BI themes can help you adhere to these guidelines by defining color palettes, font choices, and visual styles that comply with industry standards.
3. Data Visualization Best Practices: Themes can also be crafted to follow data visualization best practices, ensuring that your reports are not only visually appealing but also optimized for clarity and readability. For example, you could create a theme that uses high-contrast color combinations, legible fonts, and consistent visual encodings to improve data comprehension.
Leveraging Power BI Consulting Services
While Power BI themes are relatively easy to create and apply, organizations with complex requirements or limited resources may benefit from seeking professional "power bi consulting services." Power BI consultants can provide expert guidance and support in designing, implementing, and managing custom themes tailored to your organization's specific needs.
These consultants possess in-depth knowledge of Power BI's capabilities, best practices, and industry-specific requirements, ensuring that your themes not only align with your branding guidelines but also adhere to data visualization principles and regulatory standards.
Additionally, Power BI consulting services can assist with the deployment and maintenance of themes across your entire Power BI environment, ensuring consistency and efficiency at scale.
Conclusion
Power BI themes are a powerful tool for elevating your data storytelling capabilities and reinforcing your brand identity. By leveraging custom themes, you can create visually stunning and cohesive reports that resonate with stakeholders and align with your organization's branding guidelines.
Whether you choose to tackle theme creation in-house or seek the expertise of "power bi consulting services," investing in thoughtfully designed themes can significantly enhance the impact and professionalism of your data visualizations, ultimately empowering data-driven decision-making within your organization.
0 notes
Text
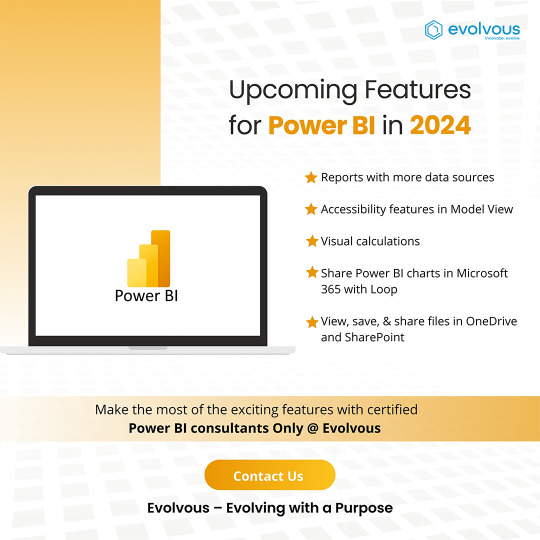
🚀 Exciting News Ahead! 🚀 Get ready to elevate your data game with Power BI in 2024! 📊✨ We're thrilled to share a sneak peek into the upcoming features that will revolutionize your analytics journey.Reports with more data sources
Accessibility features in Model View
Visual calculations
Share Power BI charts in Microsoft 365 with Loop
View, save, & share files in OneDrive and SharePoint
Make the most of the exciting features with certified Power BI consultants at Evolvous the Best Power BI Consulting Services in Canada.
#canada#powerapps#powerbi#business#evolvous#power bi services#consultants#powerbiconsultants#consultingservices
0 notes
Text
Exploring Lucrative Career Opportunities in AI
As technology continues to advance, Artificial Intelligence (AI) has emerged as a game-changer, opening a plethora of exciting career opportunities. From machine learning engineers to AI researchers, the AI job market is diverse and thriving. As businesses seek to leverage AI to enhance efficiency and gain a competitive edge, professionals with AI expertise are in high demand. Furthermore, AI's influence spans across industries like healthcare, finance, robotics, and more, presenting a vast array of paths to explore. By honing AI skills and staying updated on the latest trends, individuals can chart a rewarding career in this fast-paced and dynamic field.
Digicrome - It's a US Based Company that Provides Online Professional Courses. Digicrome is Asia's leading Brand that provides Online Data Science & Artificial intelligence Courses in 60+ Countries like Australia, Canada, America, Singapore, etc. with 50+ live projects & a **100% Job Placement Guarantee Written.**
One of the key advantages of Digicrome's courses is that they offer learners the opportunity to work on real-world projects. With over 50 live projects, learners can gain valuable experience that can help them build a portfolio of work and stand out in a competitive job market. In addition, the company's focus on job placement is a unique offering that can help learners feel more confident in their ability to succeed after completing their course.
You can visit the website: https://www.digicrome.com/
#artificial intelligence#machine learning#programming#data science#data scientist#digicromeacademy#digicrome#my writing#python#sql#placement consultancy#powerbi
0 notes
Link
OmnePresent's Power BI services help enterprises visualize & analyze data and discover new insights. We manage the complete Power BI implementation process for your organization.
0 notes
Link
Are you looking for a Power BI development for your business? Our team supports you with the migration, enhancement & development of self-service dashboards & embedded analytics.
0 notes
Text
Oil And Gas Software Firm Oil And Gas Production Software
Moreover, information visualization can help in identifying operational inefficiencies in the upstream and downstream markets. By visualizing production data, corporations can establish bottlenecks of their operations and take corrective measures to enhance effectivity and reduce costs. For instance, seismic analysis, a key component of oil and gas exploration, includes the collection and interpretation of large amounts of knowledge. Data visualization tools can help geologists and engineers to visualize this information in a significant method, enabling them to identify potential oil and gas reserves more precisely. powerbi for oil and gas certification and automation of crops offer producers within the international oil and gas sector the chance to extend their effectivity and productiveness by gathering performance knowledge from all of their crops.
To further optimise your learning experience from our courses, we additionally supply individualized “One to One” coaching support for two hours submit training. We can help improve your competence in your chosen space of interest, based on your studying wants and obtainable hours. This is a superb alternative to improve your functionality and confidence in a specific space of experience. It will be delivered over a safe video conference name by considered one of our senior trainers. They will work with you to create a tailor-made teaching program that will allow you to achieve your goals sooner.
The consultants demonstrated extensive knowledge of the legacy and new cloud-based system. In addition, they built an efficient interface to our ERP system, which streamlines our month-to-month shut course of. Furthermore, Capitalize continues to supply ad-hoc assist on an ongoing foundation, which is extraordinarily useful. Capitalize Consulting combines deep information of the vitality business with specialized experience in Midstream and Upstream Accounting, General Financials, Division Order, AFE, Tax & Regulatory, GIS, and Land Management. Our team of dedicated professionals are industry veterans in income accounting, plant allocation, geospatial, and land administration. We develop close partnerships and long-term commitments with shoppers to create immediate and persevering with influence.
Business Intelligence tools first aggregate varied forms of information from a host of sources. Business Intelligence (BI) is basically a technology-driven innovation that helps consider your small business information and ship workable insights. The main function of this expedient functionality is to empower corporates throughout all sizes to attain their goals strategically through the power of automation.
Monitoring critical parameters like manufacturing figures, downtime, and costs amidst this complexity proves arduous. Reach out to one of our twelve places of work around the globe to access instant help, to get information, or to speak with our worldwide helpdesk. The art lies within the building of specific and integrated buyer offerings that are tailor-made to individual needs.
BI automates many of the guide tasks, and decision-making processes, which were earlier based on intestine feeling, so the group can utilize its time and sources more efficiently. The tools collect knowledge across all the departments, analyze it thoroughly, and at last ship results which would possibly be simple to comprehend and execute, in the form of visible stories, charts, dashboards, etc. Overall, a recent IEA report indicated that approximately 30% of energy consumed in a net-zero system is projected from low-emissions fuels and technologies that might benefit from the talents and resources of the oil and gas industry. There is a USD 350–500 billion annual funding opportunity in clean power applied sciences in 2030 that are suited to the abilities and experience of the oil and gas industry[26]. Accessible wherever, anytime, the SaaS-based Peloton Platform permits oil and gas operators to view and manage vital operational information throughout three resolution areas integrated into one absolutely hosted platform. With greater than one hundred years of expertise in oil and gas operations, we convey the domain expertise that you have to unleash the true power of your information, at each stage of project development.
powerbi for oil and gas course has been pushed by federal and provincial authorities insurance policies developed and carried out over the previous eight years and by investments made by the sector to enhance emissions performance. A plan that utilizes an array of effective incentives, laws, investments and packages. A plan that collaborates and engages with provinces and territories, business, Indigenous Peoples, worldwide partners, and others. The Whiptail oil and gas development is the sixth growth throughout the Stabroek block, 200 km offshore Guyana. ExxonMobil is the operator and holds a 45% curiosity within the Stabroek block, Hess Guyana Exploration Ltd. holds a 30% curiosity and CNOOC Petroleum Guyana Limited, holds a 25% interest.
#powerbi for oil and gas course#powerbi for oil and gas training#powerbi for oil and gas certification#powerbi for oil and gas program#powerbi for oil and gas programme#powerbi for oil and gas education#powerbi for oil and gas fundamentals#powerbi for oil and gas skills#oil and gas powerbi course#oil and gas powerbi training
0 notes
Text
Power Bi For Oil & Gas
The Power BI dashboard provides a versatile browser-based platform for scaling up to a scalable person base, knowledge volume and numerous enterprise locations. It is simple and handy to make use of for business users even without technical information. To know more about how Power BI reports for oil & gas may help you to enhance the efficiency of your oil & gas plant and improve your company’s growth, speak to our consultants. Individuals, corporations, and national governments make monetary and policy decisions based mostly on the fee, use, and availability of these two natural assets.
Data visualization tools may help geologists and engineers to visualise this information in a meaningful means, enabling them to establish potential oil and gas reserves extra accurately. This simple oil and gas drilling dashboard, shows the present and future challenges of your project. Using story-driven, actionable KPIs (key performance indicators), let you easily see at-risk areas and take action to get your project back on track. Power BI permits environment friendly decision-making by bettering your company’s responsiveness. It offers you with a contemporary enterprise intelligence system along with efficient data administration techniques. This will increase reliability and predictability and eases the method of decision-making.
Monitoring oil manufacturing by location or monitoring manufacturing tendencies over months turns into seamless with Power BI's intuitive interface. Boston Consulting Group partners with leaders in business and society to sort out their most important challenges and seize their greatest alternatives. In abstract i'm glad i've access to each, but if I was in control of the price range I would be shifting anyone who didn't need Alteryx Analytic capabilities off ASAP. Even though both the platforms have overlapping functionalities/capabilities, they nonetheless serve distinct functions. If you look only at Midland basin you will note that the trend is kind of totally different, with gas dropping off while oil accelerated.
For over a 15 years, Capitalize has partnered with oil & gas shoppers to resolve core enterprise challenges and provide steerage to manage the trendy vitality setting. With our rich energy trade experience, superior analytics, and portfolio of resolution merchandise, we can help you navigate through strategic enterprise choices. Moreover, data visualization can help in identifying operational inefficiencies within the upstream and downstream markets.
Power BI is a Microsoft product that offers enterprise analysts the power of business intelligence and information analysis. It is a comprehensive and sturdy Microsoft enterprise intelligence system that helps business users with little or no software development expertise to create insightful dashboards for many enterprise information. Power BI purposes enable oil and gas firms to collect and analyze area data, provide operators with a reporting platform and use key information to assist production groups make well timed and critical decisions. In powerbi for oil and gas programme , PowerBI for Oil and Gas provides a transformative studying expertise for business professionals looking to improve their analytical skills and drive business success. By investing in PowerBI training, professionals can unlock new opportunities, enhance operational effectivity, and keep forward of the curve within the aggressive oil and gas industry.
These instruments not solely provide highly effective visualization capabilities but additionally combine with numerous data sources, allowing companies to tug in knowledge from different systems and visualize it in a single platform. Data visualization is especially important within the oil and gas business as a result of huge quantities of information generated from numerous sources. This knowledge, if not correctly visualized and interpreted, can lead to missed alternatives, inefficiencies, and elevated prices. The oil and gas trade has faced quite a few challenges in current times, together with the COVID-19 pandemic and the Ukraine struggle. These challenges have led organizations within the business to cut prices and analyze totally different methods, corresponding to mergers and acquisitions, to remain aggressive.
#powerbi for oil and gas course#powerbi for oil and gas training#powerbi for oil and gas certification#powerbi for oil and gas program#powerbi for oil and gas programme#powerbi for oil and gas education#powerbi for oil and gas fundamentals#powerbi for oil and gas skills#oil and gas powerbi course#oil and gas powerbi training
1 note
·
View note
Text
Ftebtech is your best Microsoft Dynamics 365 Partner In Dubai|Give it a try today itse
In the digital age, businesses in Dubai are constantly seeking innovative solutions to streamline operations, enhance productivity, and ensure seamless collaboration. At the forefront of this digital transformation journey is Microsoft Dynamics 365, a powerful suite of cloud-based applications designed to revolutionize how organizations manage their processes and engage with customers. FTEB TECH, a leading technology consultancy based in Dubai, UAE, is dedicated to empowering businesses with the transformative capabilities of Microsoft Dynamics 365.
Unlocking the Potential of Microsoft Dynamics 365
Microsoft Dynamics 365 is more than just a customer relationship management (CRM) solution; it is a comprehensive platform that integrates sales, marketing, customer service, finance, operations, and more into a single unified ecosystem. With Dynamics 365, businesses in Dubai can gain valuable insights into their operations, automate repetitive tasks, personalize customer experiences, and drive intelligent decision-making.
MICROSOFT 365
Our Service Is Tailored To Your Individual Requirements.
Microsoft Dynamics 365 Dubai, UAE
Microsoft 365 is a productivity cloud that combines best-in-class Office programs, intelligent cloud services, and advanced security to help your business succeed.
Discover the advantages of working with the FTEB TECH Team to gain access to an integrated cloud platform that provides industry-leading productivity apps such as Microsoft Teams, SharePoint, PowerBI, Dynamics 365 for Sales (CRM), and OneDrive for business, as well as intelligent cloud services and world-class security in Dubai, UAE.
It is a licensed subscription service that is a low-cost option to enhance your IT infrastructure.
As a Microsoft Partner and licensed reseller, FTEB TECH can offer strategic advice on selecting the most appropriate and cost-effective software licenses, and our Digital Modern Workplace Solutions team can assist you with ramping up your workforce to optimise the benefits of your technology investment.
Our knowledgeable consultants have assisted clients in obtaining licenses for a wide range of Microsoft business solutions, including Microsoft 365, SharePoint, OneDrive, CRM Online, Power BI, and Azure.
At FTEB TECH, we understand the unique challenges and opportunities facing businesses in Dubai. As a trusted Microsoft Dynamics 365 partner in Dubai, we offer tailored solutions to meet the specific needs of our clients. Whether you are a small startup or a large enterprise, our team of experienced consultants will work closely with you to design, deploy, and optimize Dynamics 365 solutions that drive growth and innovation.
FTEB SOLUTIONS
MIGRATION TO MICROSOFT 365 AND MANAGED SERVICESFTEB TECH not only provides migration assistance to make your transition as simple and painless as possible but also implements and configures numerous M365 products for your firm. We take pride in being a top Microsoft Dynamics Partner in Dubai, UAE.
Comprehensive Consultation and Assessment
As part of our commitment to helping businesses harness the full potential of Dynamics 365, FTEB TECH offers a complimentary consultation and assessment valued at AED 650. During this consultation, our experts will conduct a thorough analysis of your business processes, identify areas for improvement, and provide personalized recommendations for leveraging Dynamics 365 to achieve your goals.
SECURITY SERVICE AND MICROSOFT 365
FTEB TECH for M365 delivers real-time, granular visibility and control over M365 as well as the cloud services that comprise the M365 ecosystem.
Cost-Effective Licensing Options
We understand that every business is unique, which is why we offer a wide range of cost-effective licensing options for Dynamics 365, Microsoft Azure, and Microsoft Dynamics 365 Dubai. Whether you prefer a subscription-based model or a perpetual license, we can help you select the most appropriate licensing option that aligns with your budget and requirements.
Seamless Migration and Managed Services
Transitioning to a new technology platform can be daunting, but with FTEB TECH by your side, it doesn't have to be. Our experienced team not only provides migration assistance to make your transition as simple and painless as possible but also implements and configures numerous Microsoft 365 products for your firm. From data migration to ongoing technical support, we ensure a seamless transition to Dynamics 365 and managed services that meet your evolving needs.
Enhanced Security and Enterprise Mobility
Security is paramount in today's digital landscape, which is why FTEB TECH offers comprehensive security services for Microsoft 365. Our team delivers real-time visibility and control over Microsoft 365 and cloud services, ensuring the highest level of security for your business data. Additionally, our enterprise mobility solutions enable you to empower your workforce with secure access to business applications and data from anywhere, at any time.
SECURITY AND ENTERPRISE MOBILITYThrough automation and cognitive insights, FTEB TECH's hybrid cloud management solutions provide a consistent way to monitor, manage, and optimise workloads across your multi-cloud environment.The Microsoft 365 Suite exists in its own realm. Its numerous collaborations, communication, sharing, security, and application functions and apps can be intimidating. Experts who can tailor, implement, and integrate your IT according to proven and tested best practices are required to maximise your suite.100 %
Maximizing the Benefits of Microsoft 365
As a certified Microsoft partner, FTEB TECH has the expertise and experience to help you maximize the benefits of Microsoft 365. From strategic advice on selecting the right software licenses to ongoing technical support and training, we are committed to ensuring that you derive maximum value from your investment in Microsoft technologies.
Our Dynamics Consulting Company Provides Migration and Deployment in Dubai, UAE
As a Microsoft Dynamics Partner Dubai, UAE, we will provide your company with migration support. Our Dynamics consulting company can handle the entire process of migrating your existing infrastructure to Microsoft 365. As a certified Microsoft partner, we provide proper training and support to your company.
Contact us today to schedule a consultation and explore how our Dynamics consulting company can optimise your business processes.
Collaborate with a Trusted Microsoft Dynamics 365 Partner in Dubai
In today's fast-paced business environment, partnering with a trusted technology consultancy is essential to staying ahead of the competition. At FTEB TECH, we have helped numerous companies in Dubai and the UAE maximize the benefits of Microsoft Dynamics 365. Whether you are looking to migrate your existing infrastructure to the cloud or optimize your business processes, we are here to help.
Boost Your Company by Collaborating with a Microsoft Consulting Partner
Partnering with our Microsoft 365 consulting company offers numerous advantages. We have helped companies across Dubai & UAE to maximise the benefits of Microsoft 365.
Companies Can Benefit from a Microsoft 365 Partner
At FTEB TECH, we have helped numerous companies in the UAE and GCC to migrate their existing infrastructure to the cloud. We can handle data migration and provide guidance to help you transition to Microsoft 365.
Support Provided By Microsoft 365 Companies
As one of the top Microsoft Dynamics companies, we provide the following types of support.
Ongoing technical support
General training
Extensive service support
Contact FTEB TECH today to schedule a consultation and explore how our Dynamics consulting services can help you unlock the full potential of Microsoft Dynamics 365 in Dubai. With our expertise and personalized solutions, we can empower your business to thrive in the digital age. Experience the FTEB TECH advantage and transform your business with Microsoft Dynamics 365.
FTEB TECH professionals are available to provide you with the finest personalised solution based on your organisation's needs. Contact Us Now
FTEB Cloud Data Logics. © 2022 All rights reserved.
Contact Us
Terms & conditions
Get in Touch
BH Business Centre,
Spectrum Building - Office - 18 - Block A First floor - Oud Metha - Dubai - United Arab Emirates
+971 58 848 1295
0 notes
Text
Replace missing values within fraction of time using *Go to Special Options*
Go to Special is a *Special* tool for time saving tasks. Use *Go To* tool to find & select cells which are matching with criteria, such as Blank Cells, Cells with Formulas / Formatting / Data Validation etc.,
Subscribe to our channel https://lnkd.in/f3NhafJ
To get updates from Stat Modeller, please join our WhatsApp group. https://lnkd.in/dQwRymft
We at Stat Modeller provides training and consultancy in the following domains,
• Data Science (R, Python, SPSS, Minitab, PowerBI, Tableau, SAS, Excel etc.)
• Research Projects (Survey Analysis, Individual Research, Market Research etc.)
• Operational Excellence (Six Sigma, Lean, 5-S, Kaizen, TPM, Inventory Optimization)
• Universities and Institutes (Certification courses for Students, Training, Workshops)
To know more about us, please visit our website www.statmodeller.com For any enquiries, please reach out to us on 9898233268 or email at [email protected]
Follow us:
LinkedIn - https://lnkd.in/dy5f22p3
Facebook - https://lnkd.in/dWcRRq53
Twitter - https://lnkd.in/d4WEX2R2
Instagram - https://lnkd.in/d3TikXWY
#statmodeller #datascience #operationalexcellence #training #consultancy #statistics #powerbi #datavisualization #dataanalytics #dashboard
#statisticalanalysis #statistics #dataanalysis #statistical #data #dataanalyst #statistician #analysis #excel #datascience #jamovi #nonparametric #exceltips #exceltricks #microsoftexcel # #tableau #lean #python #research #universities #projects #universities #facebook #linkedin #marketresearch #email #students #instagram
🌐 : www.statmodeller.com
#datascience#statmodeller#operationalexcellence#statistics#training#consultancy#datavisualization#powerbi#business#data
3 notes
·
View notes
Text

The Evolving Landscape of Workforce and Project Spend Management
The landscape of workforce and project spend management is undergoing significant transformations. An increasing reliance on contingent workers and the escalating complexity of project spends have revealed that traditional systems are often not fully equipped to handle these changes. We have built AltiosForce as a response to these evolving needs, designed to bridge gaps left by previous solutions. This article aims to explore this evolution, examining various competitive alternatives, their strengths and shortcomings in managing SOW spend, and how AltiosForce addresses these challenges.
The Shift in Workforce Dynamics
The workforce today is vastly different from what it was a decade ago. Businesses are increasingly depending on contingent workers – freelancers, contractors, and consultants – leading to a more complex workforce structure. This shift demands more agile and comprehensive management systems.
Traditional Tools and Their Limitations
As we delve into traditional tools, it’s essential to acknowledge their strengths while also recognizing their limitations in the context of SOW spend management.
Excel Workbooks: The Familiar Choice
Strengths: Excel’s widespread use is attributed to its familiarity and flexibility. It allows users to create custom solutions for various data needs.
Limitations: Excel struggles with complex SOW and services spend data, leading to fragmented insights. Its scalability and security features are inadequate for large-scale, sensitive data management.
DIY BI Projects: PowerBI, BOBJ, and Tableau
Strengths: Known for robust customization and advanced analytics capabilities, these tools offer extensive data analysis.
Limitations: They often require significant implementation time and expertise. Understanding the problem space and designing an effective solution is a complex and costly endeavor.
Traditional Procurement Systems: SAP Ariba, Coupa, Jaggaer, iValua
Strengths: These established platforms are renowned for their comprehensive procurement functionalities.
Limitations: They often lack integration with project and workforce data, leading to a fragmented view of operations and spend.
CWM/VMS Solutions: SAP Fieldglass, DCR Workforce, Beeline, Magnit
Strengths: Effective for managing contingent and variable workforces, offering robust functionalities for vendor management.
Limitations: These systems may lack integration with project management data and do not provide detailed visibility into employees assigned to specific projects.
Project Management Tools: Monday.com, MS Project, Asana
Strengths: Excellent for organizing tasks, tracking project progress, and enhancing team collaboration.
Limitations: They do not integrate project management with detailed insights into SOW and workforce costs, leading to a lack of comprehensive spend management.
Managed Service Providers (MSPs)
Strengths: Operational support and efficiency in managing vendor relationships and contingent staffing.
Limitations: MSPs often obscure data, lacking direct visibility into SOW spend and facing challenges in integrating data with other business systems.
AltiosForce: A Response to Evolving Needs
AltiosForce was developed as a solution to the limitations of these traditional tools. Let’s explore how it addresses specific challenges:
Comprehensive Data Integration: Unlike traditional tools, AltiosForce integrates data across multiple systems, providing a unified view of SOW and services spend.
Enhanced Visibility and Analytics: It offers in-depth insights into both contingent and permanent workforce expenses.
User-Friendly and Tailored Solution: Designed specifically for SOW spend management, AltiosForce presents a more adaptable and comprehensive platform.
Direct SOW Spend Management: Offering direct and comprehensive management, it enhances data accuracy and strategic insights.
For More info https://blogs.altios.ai/2024/02/06/the-evolving-landscape-of-workforce-and-project-spend-management/
#SOWSpendManagement#SOWSpendManagementSolutions#SOWSpendmanagementsoftwarevendors#ServicesProcurementSpendManagement#SOWSpendAnalytics#SOWManagement#SOWsoftwaresolution#SOWspendtrackingsoftware#Contingentworkforcespend#Controllingcontingentworkforcespend#Contingentworkforcemanagementsoftware#Contingentlabormanagementsoftwarevendors#VendorsinStatementofworkApps#Externalworkforcespendmanagement#ServicesProcurementsoftware
1 note
·
View note
Text
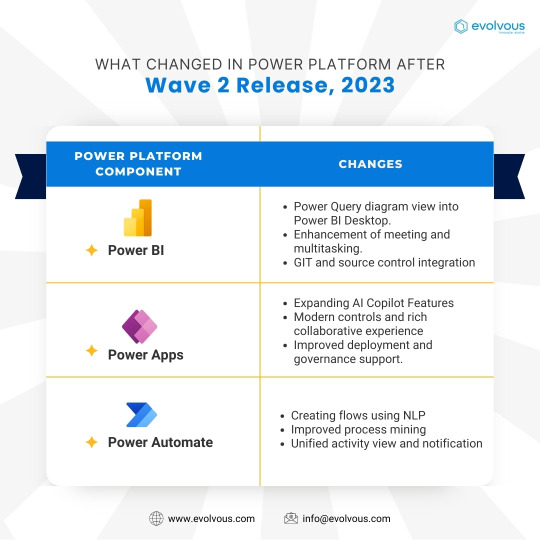
On October 2023, Microsoft announced the general availability of a host of improvement and changes to their Power Platform applications. Here are some of the major changes to three of the most widely used components - Power BI, Power Apps and Power Automate. At Evolvous, we help you leverage the updates to Power Platform and deliver modern and effective services that propel your business growth. Visit https://lnkd.in/dimx57hP to know more about our Power Platform services. Contact our Power Platform consultants to take the first step in realizing the potential of Power Platform for your business. ----- #powerapps #powerbi #powerautomate #powerplatform #microsoft #business #newupdates #automation #insights
#powerapps#powerbi#powerautomate#powerplatform#microsoft#business#newupdates#automation#insights#christmas#december#2023
0 notes
Text
The Ultimate Step-by-Step Guide to PowerBI Report Creation
Power BI is a business intelligence (BI) tool that allows you to connect to your data, create visualizations, and share insights with others.
Prerequisites:
Power BI Desktop installed on your computer.
A dataset that you want to connect to. (Here we will use SharePoint List)
Step 1: Connect to Your Data
The first step in creating a report is to connect to your data. Power BI can connect to a variety of data sources, including Excel spreadsheets, CSV files, SQL databases, and cloud services like OneDrive and many more.
To connect to your data,
Open Power BI Desktop and click on the Get Data button.
Click more and select Online Services> SharePoint Online List.
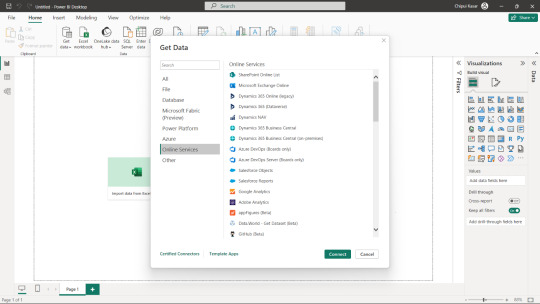
Follow the prompts to connect.
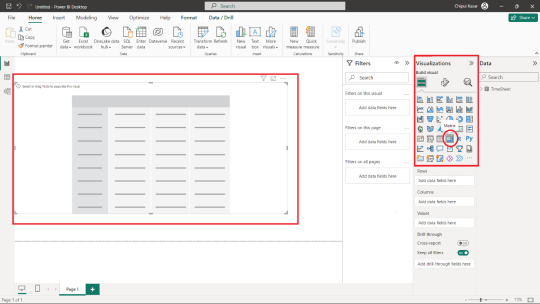
Step 2: Create Visualizations
Once you have connected to your data, you can start creating visualizations. Power BI offers a wide variety of visualizations, including charts, graphs, maps, and pie charts.
To create a visualization, Click a visual from the Visualizations pane. Power BI will automatically create a visualization based on the visual that you selected.
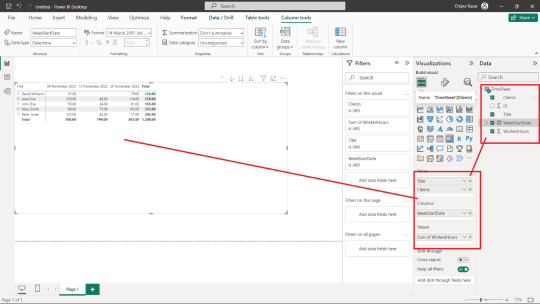
To Add Data into to visual:
Under Data Pane, Expand the Data Source (Timesheet)
Drag and drop the fields into the visual as per your need.
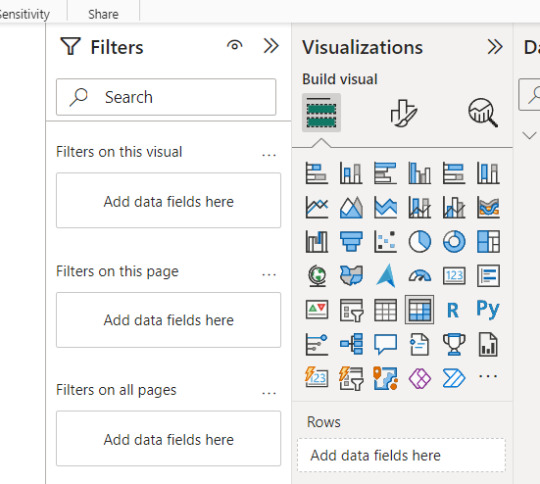
Step 3: Add Filters and Slicers
Filters and slicers allow you to narrow down your data and see specific results. To add a filter, click on the Add Filter button in the Filters pane. To add a slicer, click on the Add Slicer button in the Visualizations pane.
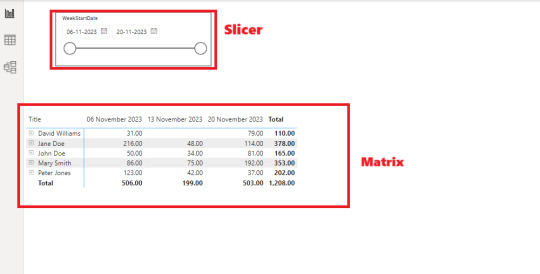
Now you can also use slicer as a filter to play around with the table.
Similarly, you can also use slicer as a filter for the other columns available in your Data Source.
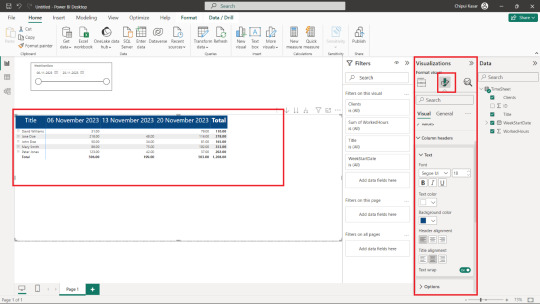
Step 4: Format Your Report
Once you have added your visualizations, filters, and slicers, you can format your report to make it look its best. You can change the font, colors, and layout of your report.
To format your report, click on the Format tab in the Visualizations pane. You can then make changes to the appearance of your report.
Step 5: Final Output
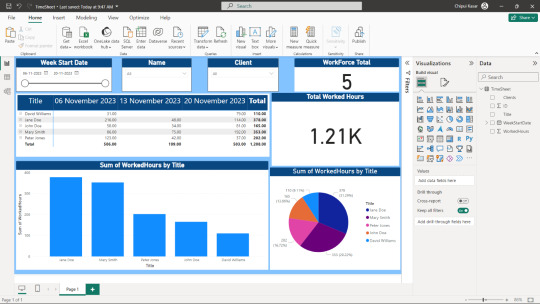
Step 6: Share Your Report
Once you are satisfied with your report, you can share it with others. Power Business Intelligence offers a variety of ways to share your report, including exporting it to a PDF file, publishing it to a web page, or sending it via email.
To share your report, click on the File tab in the top menu bar and select Share. Choose the sharing method that you want to use.
To Publish your report, click Publish on the Top right and select the destination to publish your report.
Stay tuned for our upcoming blog, 'Easy 9 Steps Guide to Embed Power BI Report in SharePoint' for a comprehensive step-by-step guide on seamlessly integrating Power BI reports into SharePoint.
Join our weekly newsletters and regular blog updates for the latest insights and tips. Connect with our expert Business Intelligence Consultants for Power BI Services. Elevate your data strategy and make informed decisions. Contact us now to transform your analytics!
#microsoft#Sharepoint consulting services#power pages sharepoint#Sharepoint consultant#microsoft copilot#power bi#powerplatform#microsoft teams#powerapps#sharepoint intranet#sharepoint onboarding app#sharepoint#intranet
0 notes
Photo
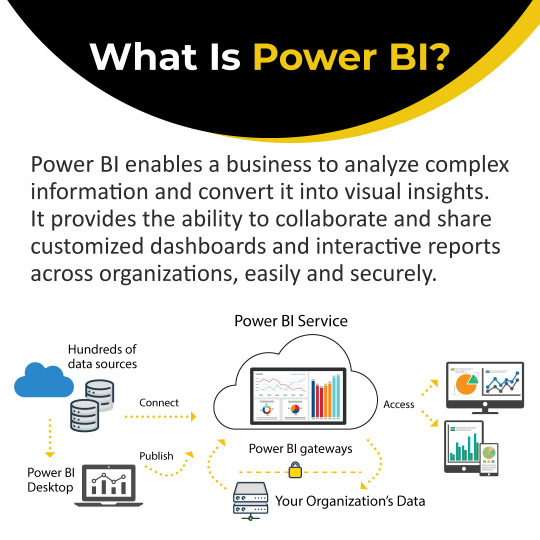
Power BI: Architecture, Components and Features
Power BI is a data analytics tool helping users to visualize data, create rich dashboards, and embed them in any application. With this technology, enterprises can monitor their business more closely and get instant answers with Power BI dashboards. Check out this post to learn about Power BI and understand its architecture, components, and features.
0 notes
Text
𝐃𝐞𝐯𝐞𝐥𝐨𝐩 𝐯𝐢𝐬𝐮𝐚𝐥𝐥𝐲 𝐫𝐢𝐜𝐡 𝐝𝐚𝐬𝐡𝐛𝐨𝐚𝐫𝐝𝐬 𝐚𝐧𝐝 𝐦𝐚𝐤𝐞 𝐢𝐧𝐟𝐨𝐫𝐦𝐞𝐝 𝐝𝐞𝐜𝐢𝐬𝐢𝐨𝐧𝐬 𝐰𝐢𝐭𝐡 #PowerBI
In today's business landscape, data is the key to answering critical questions and accessing insights from diverse sources is pivotal for advancing your analytics initiatives.
Motifworks is your trusted partner in enhancing decision-making intelligence. We specialize in crafting tailored, self-service Power BI solutions that seamlessly integrate with your various business applications. This centralizes your data, enabling real-time visualization, and empowering you and your team to take informed actions.
Take decisive action with your data today by creating an implementation strategy with a trusted Power BI consulting partner.
0 notes
Last Seen Blogs

invisiblewerewolf
Unbetitelt

dolphindiluna
Inside Out

showallyourbody
I want to see you

freshenthusiastbread
Untitled