#world meteorological organization
Text
World has hottest week on record
View On WordPress
#climate#climate change#global warming#heat#meme#memes#news#record#records#summer#warm period#weather#wmo#world#world meteorological organization
10 notes
·
View notes
Video
Seagull flying near melting ice from Glacier in Alaska by World Meteorological Organization
Via Flickr:
Photo by: Henrique Pacini (Switzerland) Location: Mendenhall Glacier, Alaska WMO 2021 Calendar Competition Entries
#Alaska#calendar#sea#seagull#iceberg#world meteorological organization#glacier#henrique pacini#nature#mendenhall glacier#landscape
26 notes
·
View notes
Text
Seeking to develop a sustained and coordinated Global Greenhouse Gas Monitoring Infrastructure to support implementation of the Paris Agreement.

WMO is seeking to develop a sustained and coordinated Global Greenhouse Gas Monitoring Infrastructure to support implementation of the Paris Agreement.
It would expand and consolidate WMO’s long-standing activities in greenhouse gas monitoring under the auspices of the Global Atmosphere Watch and the Integrated Global Greenhouse Gas Information System and coordinate surface based measurements with satellites.
The future of weather climate and water across generations.
#World Meteorological Day#23 March#WorldMetDay#Global Atmosphere Watch#surface based measurements#greenhouse gas monitoring#world meteorological organization#Arctic#antarctica#The future of weather climate and water across generations.
3 notes
·
View notes
Text
2 notes
·
View notes
Text
Critical global indicators of the climate crisis broke records in 2021, according to a UN report, from rising oceans to the levels of heat-trapping emissions in the atmosphere.
The UN World Meteorological Organization (WMO) said these were clear signs of humanity’s impact on the planet, which was bringing long-lasting effects. Extreme weather, which the WMO called the day-to-day face of the climate emergency, wreaked a heavy toll on human lives and led to hundreds of billions of dollars in damages, the agency said.
Droughts and floods triggered food price rises that have been exacerbated in 2022. The WMO’s State of the Global Climate in 2021 report also found the past seven years have been the hottest recorded.
2 notes
·
View notes
Link
4 notes
·
View notes
Text
WMO: Climate change is bad for health but climate services save lives
#ThereIsNoPlanetB - "#Climatechange threatens to reverse decades of progress towards better health and well-being, particularly in the most vulnerable communities. Scientific know-how and resources can help redress the balance, but are not sufficiently accessible or utilized, according to a new multi-agency report coordinated by the World Meteorological Organization (WMO)." World Meteorological Organization
0 notes
Text
UN Forecasts 2 In 3 Chance Of Briefly Hitting Climate Danger Point Soon
There’s a two-out-of-three chance within the next five years that the world will temporarily reach the internationally accepted global temperature threshold for limiting the worst effects of climate change, a new World Meteorological Organization report forecasts.
It likely would only be a fleeting and less worrisome flirtation with the agreed-upon climate danger point, the United Nations…

View On WordPress
0 notes
Text
Ozone layer slowly healing, hole to mend completely by 2066, UN Report
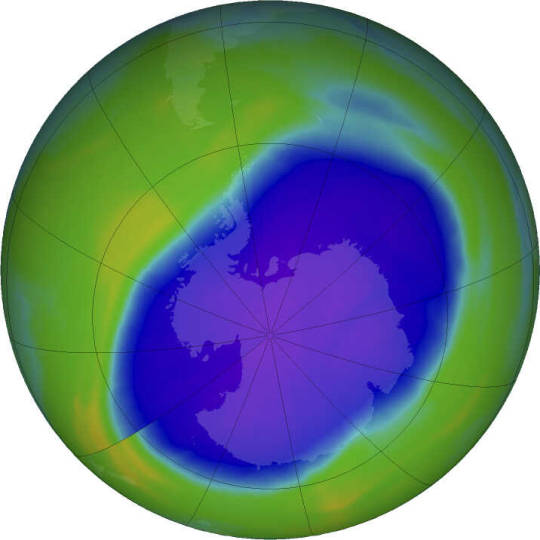
The Earth’s protective ozone layer is slowly but visibly healing at a rate that would fully mend the hole above Antarctica by 2066 (in about 43 years), a new United Nations (UN) and World Meteorological Organization (WMO) report say.
Read More
#ozone hole#ozone#enviornment#science#ozone layer#earth science#mother earth#planet earth#the earth#protective#un report#report#news#antarctica#united nations#world news#world meteorological organization#unpacked#global#global warming#climate and environment#climate change#climate science#economic#sun rays#uvrays#montreal#montreal protocol#unep
1 note
·
View note
Text
Scientific Assessment of Ozone Depletion: 2022.

Providing highlights on the health of the ozone layer in the meantime, the full Scientific Assessment of Ozone Depletion: 2022 Executive Summary report will be available soon.
#ozone depleting substances (odss)#stratospheric ozone#ozone layer protection#ozone layer#world meteorological organization#ozoneaction#NASA#UN Environment Programme#NOAA
0 notes
Text
3 notes
·
View notes
Video

flickr
A brilliant sunrise by World Meteorological Organization
Via Flickr:
Photographer: Hyunju Yu Location: Sorae Port, Republic of Korea WMO 2019 Calendar Competition Entries
0 notes
Video

flickr
Tanker Strike by World Meteorological Organization
Via Flickr:
Photographer: Will Eades Location: Port Macquarie, Australia WMO 2020 Calendar Competition
#Port Macquarie#Australia#Landscape#WMOcalendar#Sky#Cloud#Storm#Lightning#Thunder#Sea#Ocean#Seaside#Seascape#nature#will eades#photographer#world meteorological organization
22 notes
·
View notes
Text
As the fastest warming continent, Europe is witnessing the impacts of Climate Change.

2023 was the second-warmest year on record for Europe, at 1.02–1.12°C above average.
The three warmest years on record for Europe have all occurred since 2020, and the ten warmest since 2007.
Temperatures in Europe were above average for 11 months of the year, and September was the warmest on record.
Winter and autumn were both the second-warmest on record.
There is an increasing trend in the number of days with at least ‘strong heat stress’ across Europe.
The year saw a record number of days with ‘extreme heat stress’.
Surface air temperature, referred to from here on as ‘temperature’[1], has impacts on both human and natural systems. It affects health, agriculture and energy demand, for example, as well as biodiversity and natural environments. Human health is especially affected by extreme temperatures, and this impact can be estimated through the use of ‘thermal comfort’, or heat and cold stress indices. Information on heatwaves during 2023 can also be read in the ‘Contrasting summer’ section.
The three warmest years on record for Europe have all occurred since 2020, and the ten warmest since 2007. According to the European State of the Climate (ESOTC) report, 2023 was the joint warmest or second warmest year on record, depending on the dataset.

Figure 1a. Annual surface air temperature anomalies (°C) over European (as defined by C3S) land for 1950 to 2023, relative to the average for the 1991–2020 reference period. Data source: ERA5 and EOBS.
WMO Regional Association VI - dataset comparison
Figure 1c. Annual surface air temperature anomalies over European (as defined by the WMO Regional Association VI) land, from a range of datasets, for 1900 to 2023 (start year varies by dataset), relative to the average for the 1991–2020 reference period. Data source: HadCRUT5, NOAAGlobalTemp, GISTEMP, Berkeley Earth, JRA-55, ERA5. Credit: WMO. Data can be downloaded, and information on the methodology can be found on the WMO Regional Dashboard for Europe.
Temperatures for Europe as a whole show long-term warming trends. The trends are not uniform over time, however, and generally show little change, or weak cooling, from the 1950s to the 1980s, and the majority of the warming thereafter. For the year as a whole, 2023 was warmer than the average for the 1991–2020 reference period, by 1.02–1.12°C[2]. This makes it the second-warmest year on record for Europe, and 0.13–0.17°C cooler than 2020, which was the warmest year on record. The three warmest years on record for Europe have all occurred since 2020, and the ten warmest since 2007[3]
Figure 2a. Average surface air temperature anomaly (°C) for 2023, relative to the 1991–2020 reference period. Data source: ERA5.

Temperatures for the year as a whole were above average across most of Europe. The largest anomalies occurred in eastern and central areas, with some parts of eastern Europe seeing temperatures up to 2.6°C above average and parts of the Alps up to 2.3°C above average. Negative anomalies occurred in Scandinavia and Iceland, with temperatures as much as 1°C lower than average.

Figure 3. Ranking of the 2023 annual average surface air temperatures, for the period from 1950 to 2023. Darker shades of red indicate a higher ranking; the darkest showing the warmest year on record. The lightest shading indicates areas that were outside of the top 10 warmest years.
For most of Europe, 2023 was amongst the top 10 warmest years on record. Much of southeastern Europe, and parts of western and central Europe, saw their warmest year on record.
Seasonal temperatures
Figure 4a. Seasonal average surface air temperature anomalies over European land (C3S domain) for winter (DJF), spring (MAM), summer (JJA) and autumn (SON) 1950–2023, relative to the average for the 1991–2020 reference period. Winter spans the period from December of the preceding year to February of the year noted. Data source: ERA5, E-OBS.
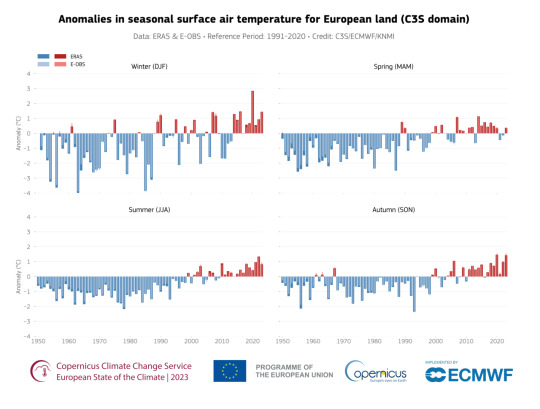
Temperatures were highly variable across Europe in 2023, especially in spring and summer. During both these seasons, Europe as a whole saw above-average temperatures, but not record breaking. Spring 2023, although warmer than the previous two years, was thirteenth-warmest on record. According to the ERA5 dataset, summer was fifth-warmest, with a temperature of 19.63°C. This is 0.83°C above average, a year after the warmest European summer of 2022, when temperatures were 1.4°C above average. Winter and autumn were both the second-warmest in the ERA5 record. More information on the intra-seasonal variability, which can be obscured by seasonal averages[4], is given below, and in the ‘Europe’s contrasting summer’ section.
Monthly temperature

Figure 5a. Average surface air temperature anomalies for each month of 2023, relative to the average for the 1991–2020 reference period
The year began with warm anomalies across much of Europe, with temperatures up to 5°C above average across a large area in January. Above-average temperatures across much of Europe were also seen in March, except for in Iceland and Fennoscandia, where cold anomalies reached 5°C below average. In April and May, much of central and northwestern Europe saw near-average or colder-than-average temperatures, while Iberia and northeastern Europe experienced well-above-average temperatures. May was the only month where the temperature for Europe as a whole was slightly below average.
June was warmer than average in northern Europe and cooler than average in the south. July and August, however, were cooler than average in northern Europe, while southern (July) and southwestern (August) Europe experienced extreme heatwaves with many locations seeing new record daily temperatures. Marine heatwaves were also seen, affecting the Atlantic Ocean and the Mediterranean Sea. September saw the most widespread much-warmer-than-average conditions, with only small parts of Spain and Iceland seeing slightly below-average temperatures. This is discussed in more detail in the ‘Europe’s contrasting summer’ and ‘Ocean’ sections.
Particularly cold conditions occurred from October to December across Fennoscandia, with temperatures down to 6°C below average, whereas the rest of the continent experienced above-average temperatures. These anomalies are discussed in the ‘Atmospheric circulation’ section.
Temperature extremes
The grey area shows the range between the 10th and 90th percentiles of the daily European land surface air temperature over 1991–2020

Figure 6. Average daily surface air temperature for European land for 2023. The grey area shows the 10th and 90th percentiles of the daily surface air temperature for European land over 1991–2020, and the dashed line the median
Fluctuations in daily temperatures highlight that, while there were periods of above- and below-average temperatures lasting several days or weeks between February and June, there was a long period of well-above-average temperatures from June to September. During these months, 80 days (66% of the period) saw temperatures that were in the top 10% of temperatures in the 1991–2020 reference period for the time of year. Only November to early December saw a long spell of cooler-than-average temperatures, with particularly cooler-than-average temperatures over Fennoscandia. In November, central Norway saw temperatures colder than any in the 1991–2020 reference period for the time of year, and Visby in Sweden recorded the lowest November temperature in a record going back to 1859, of -15.4°C.
Both the minimum and maximum temperatures for the year as a whole were also above average across much of Europe. Only Norway and central Sweden saw slightly below average maximum temperatures. The same region, alongside small parts of western Spain and northwestern Italy, also saw slightly-below-average minimum temperatures.

Figure 7. Anomalies (°C) in (left) daily maximum and (right) minimum surface air temperature for 2023 as a whole, relative to the average for the 1991–2020
Across large parts of southwestern, central and eastern Europe, maximum temperatures were up to 2°C above average for the year as a whole, and in some areas up to 3°C. Maximum temperatures were most above average in January, September and October; conditions seen across much of Europe, except for Fennoscandia in October. The anomalies were highest in September, when they reached up to 6°C higher than average. In April, central and eastern Europe saw below-average maximum temperatures, while in Spain they were well above average.
Minimum temperatures across the continent were 1.5–2.0°C above average, and up to 2.5–3.0°C in some areas. Minimum temperatures were most above average in January, September and December for much of Europe, other than Fennoscandia. More detail can be seen in the monthly maps, under ‘Further reading’ below[6].
Thermal comfort - heat and cold stress
Thermal comfort indices represent the effect of the environment on the human body. One such index is the Universal Thermal Climate Index (UTCI), which takes into account temperature, humidity, wind speed, sunshine and heat emitted by the surroundings, and how the human body responds to different thermal environments. It can be used to infer weather-induced outdoor thermal stress in humans by classifying UTCI values into ten different heat and cold stress categories, with units of oC representing a ‘feels-like’ temperature. For heat stress, the focus is on maximum (daytime) daily UTCI, and for cold stress, the minimum (night time) daily UTCI.
Days with 'very strong heat stress'
Percentage of days per year with 'very strong heat stress' (feels-like temperature between 38 and 46°C), averaged over European land

Figure 8a. Percentage of days[7] with ‘very strong heat stress’ (UTCI between 38 and 46°C), for European land, for each year between 1950 and 2023. Data source: ERA5-HEAT. Credit C3S/ECMWF.
DOWNLOAD DATA
Across Europe, there is an increasing number of days with heat stress and a decreasing number of days with cold stress. While the record-breaking summer of 2022 meant the year as a whole saw a higher percentage of days with ‘very strong heat stress’, 2023 reached a record number of days with ‘extreme heat stress’, which is equivalent to a ‘feels like’ temperature of more than 46°C.
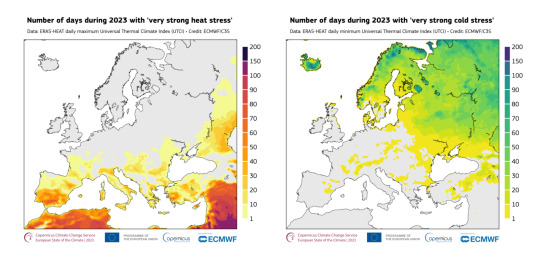
Figure 9a. Number of days during which (left) ‘very strong heat stress’ (UTCI between 38 and 46°C) and (right) ‘very strong cold stress’ (UTCI between -27 and -40°C) were experienced during 2023 across the C3S domain. Data source: ERA5-HEAT. Credit: C3S/ECMWF.

Surface air temperature, referred to from here on as ‘temperature’[1], has impacts on both human and natural systems. It affects health, agriculture and energy demand, for example, as well as biodiversity and natural environments. Human health is especially affected by extreme temperatures, and this impact can be estimated through the use of ‘thermal comfort’, or heat and cold stress indices. Information on heatwaves during 2023 can also be read in the ‘Contrasting summer’ section.
#European State of the Climate (ESOTC)#thermal stress#heat stress#temperature#world meteorological organization#Surface air temperature#Universal Thermal Climate Index (UTCI)#humidity#wind speed#sunshine#heat emitted by the surroundings#thermal environments#weather-induced outdoor thermal stress#maximum (daytime) daily UTCI#minimum (night time) daily UTCI
0 notes
Last Seen Blogs

techcubators
Untitled

ladygagapops
Lady Gaga Pops

shopifytemplate
Web Template

thecryxxred
Untitled

freshlineentertainment
Fresh Line ENT