#priceaction
Text

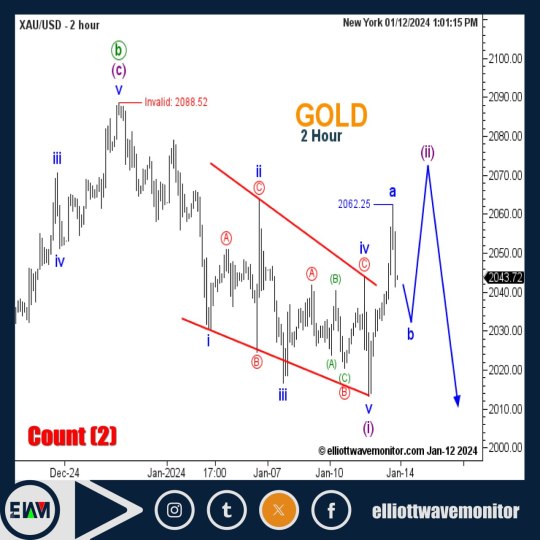

GOLD & GBPJPY
#gbpjpy#goldtrading#gold analysis#goldprice#gold#xauusdsignals#xauusd#forextrader#forex#elliottwave#bitcoin#investing#priceaction#forextraining#marketing#eurusd#forexprofit
6 notes
·
View notes
Text
#intraday stock tips#share market tips#free stock tips#nifty intraday tips#nifty futures tips#technical analysis#priceaction
0 notes
Text
Chart scaling is an important part of technical analysis that involves adjusting the axes of a chart to represent data in a meaningful way. There are two main types - arithmetic and logarithmic scaling. Arithmetic scales have equal distances between data points while logarithmic scales adjust based on percentage change. Log scales are useful for long-term charts and identifying trends. Choosing the right scaling is key - arithmetic works better for low price stocks and short-term trading while logarithmic fits high price, long-term investments. Both have advantages and limitations that need to be considered. Understanding chart scaling allows for better analysis and more informed trading decisions.
0 notes
Text
📣 Where You Want to be is Always in Control, never Wishing, Always Trading ⚖📈
💸 And Always, First and Foremost Protecting Your Butt. 💰
💷 Working in Mcx ,, Nse ,, Comex ,, Forex ,, Index ,, Future.💲
💱 Start In Just 4999/- 💸

#niftytrading#bse#sharemarket#niftyfifty#nifty#nse#sensex#shares#indianstockmarket#priceaction#optionstrading#stockmarkets#banknifty#intraday#stockmarketnews#stockmarketinvesting#futurestrading
0 notes
Text
#forex#forextrader#elliottwave#bitcoin#investing#priceaction#forextraining#marketing#eurusd#forexprofit
4 notes
·
View notes
Text
youtube
"Wave after wave Persian attack will be smashed against Spartan shields", Leonidas, 300
The elliottician coffee break ☕️, btw they must be satisfied featuring on my posts 😁✌️🤞✌️ GG!
My Instagram and Threads: @handisaputra_lin
My LinkedIn: linkedin.com/in/handisaputralin
My TradingView: tradingview.com/u/handisaputra
0 notes
Text
#intraday stock tips#share market tips#free stock tips#stock tips#gold tips#nifty intraday tips#nifty future tips#nifty futures tips#technical analysis#priceaction
0 notes
Text

Technical Analysis in Stock Market Trading:
Technical analysis is a method employed by traders to evaluate and predict future price movements based on historical market data. This approach revolves around the analysis of price charts, patterns, and trading volumes, aiming to uncover potential trends and turning points. Key components of technical analysis include:
Price Charts:
Utilizing various chart types (candlestick, line, bar) to visualize historical price movements.
Identifying trends, support, and resistance levels through chart analysis.
Indicators:
Implementing technical indicators like moving averages, Relative Strength Index (RSI), and Moving Average Convergence Divergence (MACD).
These indicators provide quantitative insights into market momentum, overbought or oversold conditions, and potential trend reversals.
Trendlines:
Drawing trendlines to highlight the direction of the market.
Recognizing breakout or breakdown points that may signify significant price movements.
Chart Patterns:
Identifying common chart patterns such as head and shoulders, triangles, and flags.
Interpreting these patterns to forecast potential future price movements.
Volume Analysis:
Analyzing trading volumes alongside price movements.
Volume analysis helps confirm the strength of a trend or identify potential reversals.
While technical analysis doesn't consider a stock's intrinsic value, it provides valuable insights into market sentiment and momentum, making it particularly useful for short to medium-term trading strategies. Traders often combine technical analysis with risk management techniques to enhance decision-making and navigate the dynamic nature of financial markets successfully. Understanding the nuances of technical analysis empowers traders to make informed choices based on historical patterns and market psychology.
#sharemarket#stockmarket#priceaction#technicalanalysis📊📈📉#technicalanalysisdaily#technical analysis#technicalanalyst#technicalanalysis#priceactionstrategy#priceactiontrader#priceactiontrading
0 notes
Text
price action strategy : Unlock the Full Potential of Forex Trading
price action strategy Introduction:
As a price action strategy leading market with staggering daily transaction volumes, the foreign exchange, or forex,
market undoubtedly offers exciting opportunities for both new and experienced traders.

Among the plethora of technical analysis strategies employed by traders, the price action strategy is particularly noteworthy due to its precision and reliance on historical data.
In this blog post, we will delve into the fundamentals of this approach,
discussing various patterns and techniques that will substantially enhance your forex trading journey.
Understanding
Fundamentally, the price action strategy revolves around the careful analysis of historical price movements to identify recurring patterns,
which ultimately inform trading decisions.This methodology eschews traditional indicators and places emphasis on raw price data from charts, enabling traders to assess market sentiment and make well-founded decisions.
Consequently, by familiarizing themselves with key price action patterns, traders can anticipate future market movements and seize opportunities accordingly.
Key Price Action Patterns to Recognize

- Pin Bars: With unique characteristics like a long "tail" (wick) and a small or nonexistent body,
- pin bars indicate rejection of higher or lower prices and often signal trend reversals.
- Engulfing Bars: These bars completely "engulf" the previous candlestick, representing increased market momentum and potentially heralding a trend continuation or reversal.
- Double Inside Bars: Comprising two inside bars within a larger price range,
- double inside bars may signify that a breakout in either direction is imminent.
- Inside-Bar False Breakout: An inside-bar that initially appears to break in one direction,
- only to quickly reverse, often indicates that the move will continue in the opposite direction.
Key Price Action Strategies and Techniques

- The Trendline Break Strategy: In this strategy, traders draw trendlines connecting higher lows or lower highs and subsequently enter or exit a position once the price breaks through these lines.
- The Support and Resistance Strategy: Support and resistance levels reflect the psychological price barriers where buyers and sellers are most active. Hence, trading based on these levels can yield positive results.
- The Breakout Strategy: Upon identifying a well-established trading range, a breakout strategy aims to exploit the price movement as it emerges out of the range.
The Advantages of Price Action Trading

- Simplifies Decision Making: By analyzing raw price data without the distractions of various indicators, traders can anticipate market movements more effectively.
- Flexibility: Impressively, a price action approach can adapt to all markets, including forex, commodities, and indices.
- Works with all Timeframes: Price action trading can be successfully applied to a wide array of chart timeframes, from intraday to long-term perspectives.
Visit Investopedia for more on price action strategy
"Gain deeper insights and data on market analysis."
"forex chart patterns: A Guide to Effortlessly Identifying"
Conclusion:

Ultimately, embracing the price action strategy can significantly boost your forex trading endeavors, providing a strong foundation for future success.
By mastering the essential patterns and techniques outlined in this comprehensive guide,

you will be well-equipped to capitalize on market opportunities and elevate your trading profits.
So why wait? Embark on your journey to unlock the full potential of forex trading with the price action strategy today.
Firstly, the price action strategy is appreciated for its simplicity and adaptability across various markets. Secondly, it excels in identifying both short-term volatility and long-term trends, enhancing traders' understanding. Lastly, this approach helps traders improve their decision-making skills based on diverse market scenarios.
Read the full article
0 notes
Text
Bollinger Bands Strategy Guide to Trading Success Trading

The key to success in the ever-changing world of trading is the ability to anticipate market moves and make calculated choices. Bollinger Bands is a popular strategy among traders because of its flexibility and efficiency. This in-depth manual will teach you everything you need to know to use this trading strategy successfully.
An Overview of the Bollinger Bands Strategy

Bollinger Bands Strategy
The Bollinger Bands Strategy is defined as follows.
John Bollinger created the Bollinger Bands strategy in the 1980s as a technical analysis tool. Its purpose is to aid traders in determining when to enter and quit the market. The process employs a triangular plot with a simple moving average in the center and two lines at different standard deviations above and below it. This produces a moving border around the price activity, giving traders a graphical depiction of the market's condition.
Where Bollinger Bands Came From and Why They Matter in Trading
Technical analyst veteran John Bollinger first popularized the Bollinger Bands.
The strategy's value comes from its ability to quantify market volatility and provide benchmarks for a price high or low. Because of its importance in spotting trading opportunities and controlling risk, this data is a must-have for investors.
Learning How Bollinger Bands Are Made
Bollinger Bands include three primary parts:
The Center Line: This short moving average is a foundation for the upper and lower bands. As a symbol of the trend in the medium term, it is often a point of support or resistance.
Overbought conditions are indicated by a move above the Upper Band, which may be seen as a signal to reduce holdings. When the price of an asset reaches or passes this level, it may be a sign that it is overvalued and that a decline in its value is likely.
As indicated by the Lower Band presence, Oversold situations may signal a good time to purchase. Price action around or crossing this level may tell that the asset is underpriced, and a price rise is likely.

Top Methods For Using Bollinger Bands
Profitable Trading Requires Recognizing The Bollinger Squeeze
Top Methods for Using Bollinger Bands
Profitable Trading Requires Recognizing the Bollinger Squeeze
An essential part of the Bollinger Bands strategy is the Bollinger Squeeze. This happens when there is less volatility in the market and the bands' contract. When the band's arrangement is like this, volatility increases, causing significant price swings. Squeezes like this may provide profitable trading chances, so traders watch for them.
Taking Advantage of Market Volatility with the Bollinger Bounce
Another crucial idea essential to the Bollinger Bands strategy is the Bollinger Bounce.
That's jargon for how often prices "bounce" between the two bands. Markets whose prices tend to fluctuate between a specific high and low might benefit significantly from recognizing this trend.
Why RSI and Bollinger Bands Work So Well Together
The efficiency of your trading strategy may be improved by integrating Bollinger Bands with the Relative Strength Index (RSI). The Relative Strength Index (RSI) is a momentum oscillator that evaluates the price change rate. Used in tandem with Bollinger Bands, it may corroborate the signals given by the bands, lowering the chance of receiving a false signal and increasing the strategy's overall dependability.
Strategy for Using Bollinger Bands
Preparing Your Trading Platform Using Bollinger Bands
Bollinger Bands are a standard indicator on most trading platforms. Please select it from the list of possible hands, then tweak the parameters to your liking. Bollinger Bands have two standard deviations for the upper and lower bands and a 20-day simple moving average for the center line. But you may tweak these parameters to suit your trading preferences and time horizon.
Bollinger Bands: An Introduction and Explanation
Bollinger Bands are easy to understand and apply.
A widening of the bands shows increased market volatility. Conversely, narrower bands are indicative of lower volatility. Prices tend to fluctuate towards the bands during high volatility and shift closer to the center line during low volatility.
Traders might utilize these insights to spot future market openings. When the price reaches the top band, it may be time to sell, while when it goes to the lower band, it may be time to purchase. These signals, however, should be double-checked with other indications to ensure their accuracy.
Divergence, convergence, and other high-level methods
Expert traders often use Bollinger Bands to search for divergence and convergence patterns. When the price and band trends are heading in opposing directions, we have divergence; when they run similarly, we see convergence. These patterns may help traders spot good opportunities by revealing information about possible market reversals.
Bollinger Bands and Compatible Indicators
Bollinger Bands and Simple Moving Averages: A Powerful Combination
Smoothing out price data using moving averages makes it worthwhile in technical analysis since patterns become more apparent. When combined with Bollinger Bands, these indicators are helpful for trading. For instance, a trading opportunity may present when the price moves above or below a moving average line.

An Unbeatable Combination: Macd And Bollinger Bands
An Unbeatable Combination: MACD and Bollinger Bands
Another common technique that combines nicely with Bollinger Bands is the Moving Average Convergence Divergence (MACD). The Moving Average Convergence Divergence (MACD) is a momentum indicator that tracks price trends. When used with Bollinger Bands, it may corroborate the signals provided by the bands, making their signs more trustworthy.
A Potent Combination of the Relative Strength Index (RSI) and Bollinger Bands
The Relative Strength Index (RSI) is a momentum oscillator that evaluates the price change rate. By highlighting overbought and oversold circumstances, Bollinger Bands may serve as a helpful trading indication. When the price reaches the upper band and the RSI shows overbought events, this is an excellent time to sell.
Analysis of Bollinger Bands' Performance
The Reasons Why Bollinger Bands Are So Popular With Traders
Because of their adaptability, Bollinger Bands are often used in trading. They are helpful for both short-term traders and long-term investors since they can be used across all markets and time durations. And since they show the market situation graphically, even inexperienced traders can understand them.
Using Bollinger Bands Successfully in Real-World Trading Scenarios
Bollinger Bands have been used successfully by many traders. This trading strategy has shown itself successful time and time again, as seen by these examples of its use. Examples of this use include the identification of overbought/oversold circumstances in range-bound markets and the identification of breakouts in turbulent markets.
What Bollinger Bands Can't Tell You and How to Fix It
Bollinger Bands, like any other trading technique, has its limits. For instance, they may give out misleading readings during high volatility. A disciplined trading strategy and supplementary indicators help traders get beyond these restrictions. Combining Bollinger Bands with other indicators like the Relative Strength Index (RSI) or the Moving Average Convergence Divergence (MACD) may assist in eliminating spurious signals and boost the strategy's consistency.
Improving Your Use of Bollinger Bands
How to Use Price Movement with Bollinger Bands
The term "price action" describes the fluctuations in the value of securities, which are often shown in real-time on a chart. Bollinger Bands are helpful, but you may get more insight into market behavior by including price action in your strategy. For instance, pin bars and engulfing patterns are two examples of price action patterns that may indicate a market reversal. Strong trading signals may be generated by the appearance of such patterns at the band's upper or lower boundary.
Bollinger Bands and the Importance of Candlestick Patterns Trading
Potential market reversals might be predicted with the use of candlestick patterns. Bollinger Bands help determine when to enter and leave a market. For example, in the lower band, a bullish engulfing pattern might indicate a buying chance, while near the higher bar, a bearish engulfing pattern could indicate a selling opportunity.
The Importance of Risk Management in Bollinger Bands Trading
A successful trading strategy must prioritize risk control. Stop-loss orders may
Control losses and gains can be cashed at predefined points. Stop-loss orders may be placed above the upper band or below the lower band when using Bollinger Bands to guard against potentially disastrous price swings. Similarly, take-profit orders might be placed in the opposite band to benefit from price increases.
Market Conditions and Bollinger Bands
Market Trends and Bollinger Bands
Bollinger Bands help determine when to enter and leave moving markets. The upper and lower bands can serve as shifting support and resistance zones. In an upward trend, for instance, a price that encounters resistance at the lower Bollinger Bands may rebound off that level and proceed toward the upper Bands, creating a purchasing opportunity. When prices fall, they can bounce off the upper band and go back down, creating a selling opportunity.
The Breakout Strategy for Bollinger Bands in Choppy Markets
Bollinger Bands are helpful in sideways markets because they reveal stretches of low volatility that usually precede a breakthrough. Investors might use this data to be ready for any price shifts. For instance, if the bands narrow, it may be a precursor to a breakthrough. When a breakout occurs, traders may cash in by placing entry orders either above the upper band or below the lower band.
Bollinger Bands: Riding the Waves in Turbulent Markets
When market volatility is high, Bollinger Bands widen to account for more price movement. Investors might use this data in their trading techniques. They may, for instance, increase the distance between their stop-loss and take-profit levels in anticipation of the higher levels of volatility.
Different Trading Strategies Using Bollinger Bands
Bollinger Bands for Swing Trading: Taking Advantage of Price Movements
Swing traders may use Bollinger Bands to forecast price changes. The higher and lower bands represent possible turning points. For instance, a chance to sell may present itself when the price increases to the upper band. The same holds for the bottom band, as a price touching that level may indicate a possible upward movement and a purchasing opportunity.

Using Bollinger Bands
Using Bollinger Bands for Intraday Trading
Day traders may use Bollinger Bands to monitor temporary price shifts. The strategy may aid in providing signs for entering and leaving markets quickly. For instance, a touch of the upper band may indicate a short-term selling opportunity, while a touch of the lower band may indicate a short-term purchasing opportunity.
Using Bollinger Bands Patiently for Long-Term Gains
Bollinger Bands may help long-term investors see possible shifts in the market's long-term trend. Signals for promising long-term investments may be gleaned by using the strategy. For instance, if the price stays above the upper band for an extended time, it may indicate a robust upward trend and a promising chance for long-term investment. Similarly, if prices stay below the lower range for an extended time, it may indicate a significant negative trend and provide an opportunity for short sellers.
Successfully Using Bollinger Bands, Final Thoughts
Bollinger Bands is a strategy that calls for time and dedication to master. However, if you take the time to learn how it works, you can use it to your advantage in the trading world, bolstering your strategy while increasing your earnings. In trading, remember that finding opportunities is just half the battle; the other half is risk management. Never put more money at risk in the market than you can afford to lose.
Read the full article
#BollingerBands#ForexTrading#MACD#MarketTrends#MovingAverage#PriceAction#RSI#StandardDeviation#TechnicalAnalysis#TradingSignals#TradingStrategy#Volatility
0 notes
Text
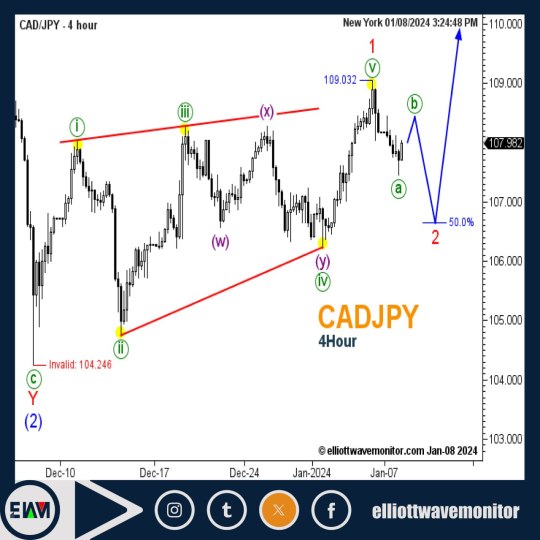
CADJPY - 4Hour
#forex#forextrader#elliottwave#bitcoin#investing#priceaction#forextraining#marketing#eurusd#forexprofit
2 notes
·
View notes
Text
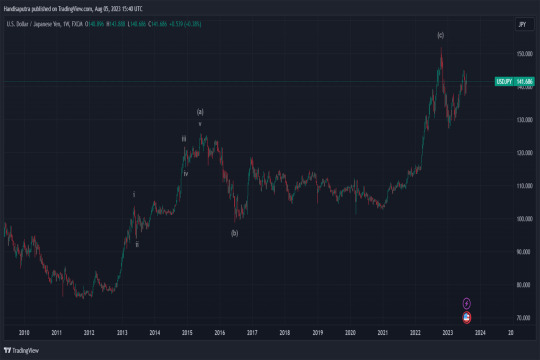
The #USDJPY chart shows the high probability of the completed zigzag with wave (a) expanded.
Good luck!
My TradingView: https://www.tradingview.com/chart/USDJPY/X4DRDyid-The-Zigzag-Correction-of-USD-JPY/
My Instagram & Threads: @handisaputra_lin
0 notes
Video
youtube
Estratégia de Price Action com Robôs Automáticos - Como Implementar com Sucesso!
Assista esse vídeo-áudio que fala sobre uma Estratégia de Price Action com Robôs Automáticos - Como Implementar com Sucesso. Acesse mais informações: https://www.ganhardinheiro.com/2023/04/estrategia-de-price-action-com-robos.html
0 notes
Text
0 notes
Text
In price action trading, pivots and swings serve as key elements in analyzing market movements. Pivots mark potential reversal points, where the direction of an asset's price could shift. Traders often look for pivot highs and lows to identify changing market sentiment.
Swings, on the other hand, represent the oscillation of prices between highs and lows. Traders observe swing points to gauge the strength of a trend and anticipate potential entry or exit points. Recognizing the rhythm of swings aids in making informed decisions, as traders strive to ride upward swings in bullish markets and navigate downward swings in bearish trends.
Successful price action trading involves astutely interpreting these pivotal moments and swings, enabling traders to adapt their strategies based on the evolving market dynamics. It's a dance of precision and timing, where understanding the subtle nuances of pivots and swings enhances one's ability to navigate the unpredictable terrain of financial markets.
0 notes
Last Seen Blogs

femme-crimes
starlights


asker85xx
Asker85xx

kamleshkumarsposts
Kamlesh

central-is-growing
Thank you.