
sharemarketmalayalam
Share market malayalam
Trader who follow technical analysis. Check my blog https://www.teqmocharts.com for share market related posts
186 posts
Don't wanna be here? Send us removal request.
Last Seen Blogs

helenatimdepp
"I want to shock everyone!" HBC

kotsku-artworks
a r t w o r k s

imabocari
katy

sarahcares4u-blog
Untitled

forsevy
for sevy,
Text
Explore the thrilling world of finance and stock trading through the lens of cinema. This insightful blog post curates the best stock market movies across genres - from gripping dramas like Wall Street and The Big Short to biographical accounts of legends like Warren Buffett. Discover cinematic gems that offer a captivating glimpse into the high-stakes realm of investments, corporate scandals, and the 2008 financial crisis. Whether you're a financial enthusiast or simply seeking an entertaining watch, this curated list is a must-read for movie buffs and stock market aficionados alike.
0 notes
Text
🔥 Unlock precision trading with FYERS' Seconds Timeframe Charts! Get granular 5-second intervals, 30-day history & game-changing insights for scalping, options & more. Rev up your trading game as an Indian trader! 📈
0 notes
Text
Unlocking the secrets of option greeks! 📈 Delta, Gamma, Theta, Vega, and Rho are crucial factors in understanding options trading. Delta measures sensitivity to the underlying asset, Gamma tracks changes in Delta, Theta captures time decay, Vega reflects volatility impact, and Rho assesses interest rate influence. Dive into my latest blog post for a deeper insight into these option greeks and elevate your trading strategies. 💡 #OptionsTrading #Investing #FinancialEducation
0 notes
Text
Tools and resources useful for option traders.
0 notes
Text
An option chain is an important tool for traders looking to implement options trading strategies. My new article provides a beginner's guide to understanding option chains - what they are, why they matter, and how to leverage them in making data-driven trading decisions. Learn about strike prices, expiration dates, puts vs calls, implied volatility, and interpreting the numbers to determine optimal trades. Whether you're an amateur investor hoping to utilize options to hedge positions or a seasoned active trader aiming to capitalize on short-term price movements, read this overview on utilizing option chains to enhance your options trading strategy. With clear explanations and actionable steps tailored for newcomers, it's an invaluable resource for demystifying option chain analysis. Check out the article through the link above to learn how option chains can take your options trading to the next level.
https://www.teqmocharts.com/2024/02/option-chain.htmlp
0 notes
Text
Interested in understanding algorithmic trading and its growing adoption in India? I've written a comprehensive blog post discussing the strategies, platforms, and future outlook of algo trading in the Indian context. I analyze the current landscape, regulations, growth prospects, challenges, and opportunities for algorithmic traders in India. If you want to get up to speed on this cutting-edge trading approach that’s gaining significant traction, be sure to check out my post! Let me know what you think - I welcome feedback from fellow trading enthusiasts! Does algorithmic trading have the potential to disrupt Indian markets in the coming years? Share your thoughts after reading my analysis!
0 notes
Text
Discover all about Alice Blue Stock Broker in our new blog post! I break down their services, fees, and trading platforms so you can easily understand. Whether you're new to trading or looking to level up, this guide has insights for everyone. Check it out
0 notes
Text
A comprehensive list of 100+ technical indicators.
നൂറിൽ അധികം ടെക്നിക്കൽ ഇൻഡിക്കേറ്ററുകളെ കുറിച്ചുള്ള വിവരങ്ങൾ അടങ്ങിയ പോസ്റ്റ്.
0 notes
Text
Have you ever come across stocks tagged with the periodic call auction symbol while researching small-caps? In zerodha you may have seen this error message "this stock is traded in periodic call auction for illiquid securities" while selling an illiquid stock. It can get confusing if you don't understand the rationale and workings of this mechanism introduced by SEBI specifically for illiquid stocks. I recently published an in-depth guide explaining what periodic call auctions are, how the scheduled auction sessions operate, the trading rules to follow for such stocks, and most importantly - why this controlled system benefits typically volatile small caps. If you actively track or invest in low liquidity stocks, I highly recommend giving this a read to clarify your understanding of periodic call auctions.
0 notes
Text
Zerodha integrates leading charting platforms ChartIQ and TradingView for their clients. This blog article contrasts key capabilities between them across technical parameters like indicators, drawings, alerts in addition to functionality differences based on trading horizon and mobile availability. Get a concise but detailed comparison to determine which charting tool better serves your market analysis needs based on whether you are an intraday scalper or positional investor focused on long term trends.
0 notes
Text

This infographic summarizes 7 essential budgeting tips to help you manage money effectively, align expenses with income, reduce unnecessary costs, save towards goals diligently, clear loans faster, build an emergency corpus, and lay the groundwork towards gaining financial freedom. Implement these strategies to take charge of your finances.
0 notes
Text

Exchange Traded Funds (ETFs) have become increasingly popular investment vehicles in India over the last decade. An ETF is a basket of securities that tracks an index, commodity, or other asset, and trades on the stock exchanges like individual stocks. The first ETF launched in India was the Nifty BeES by Goldman Sachs Asset Management in 2001, which tracked the NIFTY 50 index. As of 2022, there were over 300 ETFs in India with Assets Under Management of over $45 billion across equity, gold, banking, state-owned enterprises, and other sectors. Reasons for the growth of ETFs in India include their low costs, transparency, ability to diversify easily, and liquidity compared to traditional mutual funds. Indian investors use ETFs for index investing, cash management, asset allocation, and to gain exposure to overseas markets. The Securities Exchange Board of India (SEBI) has also taken steps to boost ETF penetration by allowing fund houses to launch passive funds tracking unique indices. The growing investor interest shows the increasing maturity of the ETF market in India.
0 notes
Text
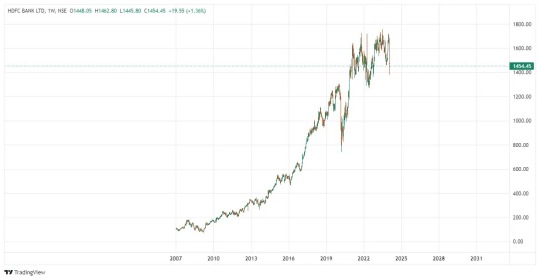
Chart scaling is an important part of technical analysis that involves adjusting the axes of a chart to represent data in a meaningful way. There are two main types - arithmetic and logarithmic scaling. Arithmetic scales have equal distances between data points while logarithmic scales adjust based on percentage change. Log scales are useful for long-term charts and identifying trends. Choosing the right scaling is key - arithmetic works better for low price stocks and short-term trading while logarithmic fits high price, long-term investments. Both have advantages and limitations that need to be considered. Understanding chart scaling allows for better analysis and more informed trading decisions.
0 notes
Text
How Company Decisions Shake Up Stock Prices
Investing in the stock market can resemble a roller coaster, with share prices fluctuating wildly. One reason for these sharp ups and downs are the decisions made by companies, known as corporate actions. Let's examine how these moves can impact the value of stocks.
Imagine you own part of a company through shares you've purchased. Firms often reward shareholders by distributing a portion of profits called dividends. Like a thank-you bonus for investing, dividends can signal to investors to purchase shares, lifting prices. However, dividend cuts make some investors hesitant, potentially decreasing share values.
Consider an intriguing tactic: stock splits. Suppose you swap a ₹100 bill for two ₹50 bills. The total value holds steady, but the number of bills increases. Similarly, a split divides a share price, but market capitalization stays constant. More affordable shares can attract investors, sparking a surge in demand and price.
Another common move is mergers and acquisitions (M&A), which is combining with or acquiring another company. For the desired company, offers usually boost share prices as investors anticipate a profitable deal. However, for the bidder, it’s riskier - prices shift based on deal perceptions.
Share buybacks also impact prices. By repurchasing outstanding shares, companies reduce supply, making remaining shares more valuable. Investors typically welcome buybacks, lifting prices.
Not all decisions pay off. Issuing new shares dilutes existing share value, making shares less attractive. Major M&A deals can also spook investors, sinking prices temporarily.
In summary, the unpredictable stock market reacts strongly to company decisions like dividends, splits, mergers, and share issues. Understanding these catalysts helps navigate the roller coaster of investing.

0 notes
Text
The BSE Sensex, also called the S&P BSE SENSEX or simply the SENSEX, is a free-float market-weighted stock market index of 30 well-established and financially sound companies listed on Bombay Stock Exchange. It is the oldest stock index in India and serves as the country's primary barometer of economy. The 30 component companies are leaders in their respective industries, offering a wide range of products and services to customers across India and abroad. They represent various major sectors of the economy like information technology, financial services, oil and gas, healthcare, automotive, consumer goods and more. The Sensex was first compiled in 1986 with a base value of 100 points. Over the years, it has become one of the most tracked stock market benchmarks in India. The index is computed using the free-float market capitalization methodology, wherein the level of index reflects the free-float market value of 30 component stocks relative to a base period. It indicates the overall direction of the market and changing business sentiments based on the performance of these market leaders.
0 notes
Text
Stock Market Crashes in India
The Harshad Mehta Scam (1992) In 1992, the Harshad Mehta securities scam led to a 30% crash in the BSE Sensex. Mehta manipulated share prices using tactics like circular trading and fake bank receipts to defraud banks and inflate stock valuations before the scam unraveled.
The Global Financial Crisis Crash (2008) In 2008, the global financial crisis triggered panic selling leading the Sensex to plunge over 50% within a year. Stock markets worldwide crashed due to subprime mortgage defaults in the US spreading to other economies.
The COVID-19 Pandemic Crash (2020) In 2020, the onset of COVID-19 led to large-scale investor panic selling again crashing the markets by nearly 39%. Lockdowns and mobility restrictions severely disrupted economic activity.
Key Impacts While exact details differed, these crashes led to wealth erosion, slower growth, job losses, tighter credit conditions, and wider economic pain.
Mitigating Future Crashes India has since strengthened regulation and risk management including oversight by SEBI, settlement reforms, circuit breakers and surveillance systems. Learning from past crashes and following prudent market practices can help Indian markets fortify themselves against excessive volatility during times of crisis.
0 notes
Text

Technical Analysis in Stock Market Trading:
Technical analysis is a method employed by traders to evaluate and predict future price movements based on historical market data. This approach revolves around the analysis of price charts, patterns, and trading volumes, aiming to uncover potential trends and turning points. Key components of technical analysis include:
Price Charts:
Utilizing various chart types (candlestick, line, bar) to visualize historical price movements.
Identifying trends, support, and resistance levels through chart analysis.
Indicators:
Implementing technical indicators like moving averages, Relative Strength Index (RSI), and Moving Average Convergence Divergence (MACD).
These indicators provide quantitative insights into market momentum, overbought or oversold conditions, and potential trend reversals.
Trendlines:
Drawing trendlines to highlight the direction of the market.
Recognizing breakout or breakdown points that may signify significant price movements.
Chart Patterns:
Identifying common chart patterns such as head and shoulders, triangles, and flags.
Interpreting these patterns to forecast potential future price movements.
Volume Analysis:
Analyzing trading volumes alongside price movements.
Volume analysis helps confirm the strength of a trend or identify potential reversals.
While technical analysis doesn't consider a stock's intrinsic value, it provides valuable insights into market sentiment and momentum, making it particularly useful for short to medium-term trading strategies. Traders often combine technical analysis with risk management techniques to enhance decision-making and navigate the dynamic nature of financial markets successfully. Understanding the nuances of technical analysis empowers traders to make informed choices based on historical patterns and market psychology.
#sharemarket#stockmarket#priceaction#technicalanalysis📊📈📉#technicalanalysisdaily#technical analysis#technicalanalyst#technicalanalysis#priceactionstrategy#priceactiontrader#priceactiontrading
0 notes