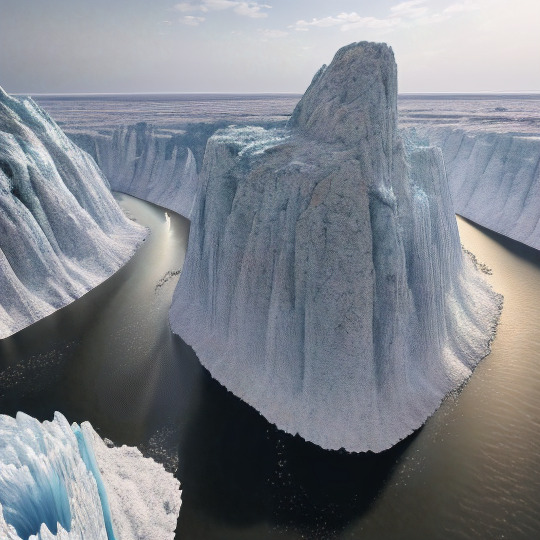
#ice sheets
Photo
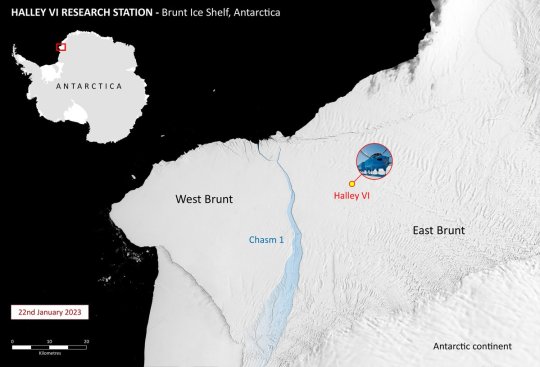
A new iceberg the size of Greater London has calved from Antarctica's Brunt Ice Shelf.
Last night, the crack Chasm-1 fully extended through the 150m thick ice - a decade after BAS scientists first detected that cracks in the ice sheet were growing.
by @BAS_News
115 notes
·
View notes
Text
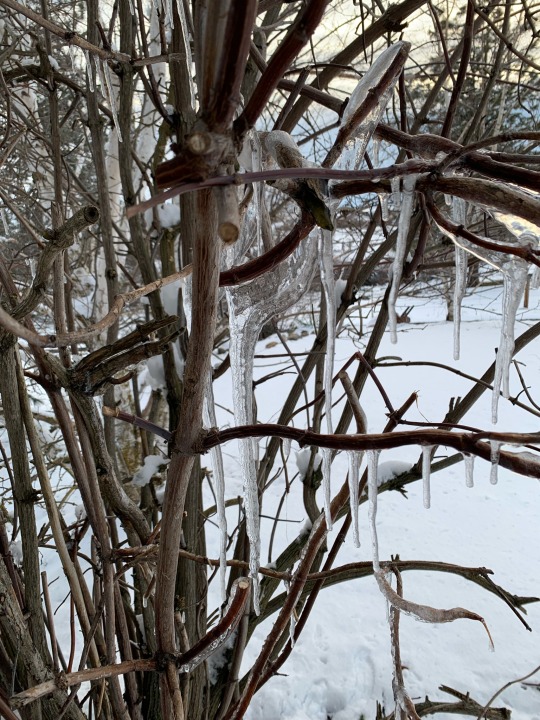

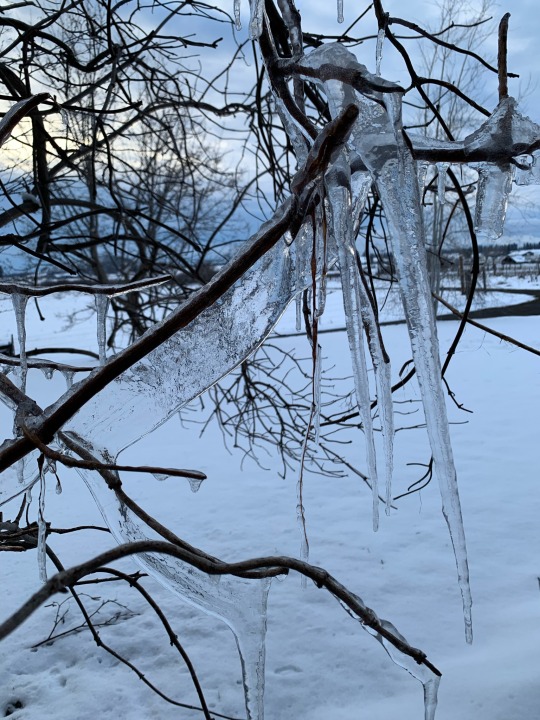
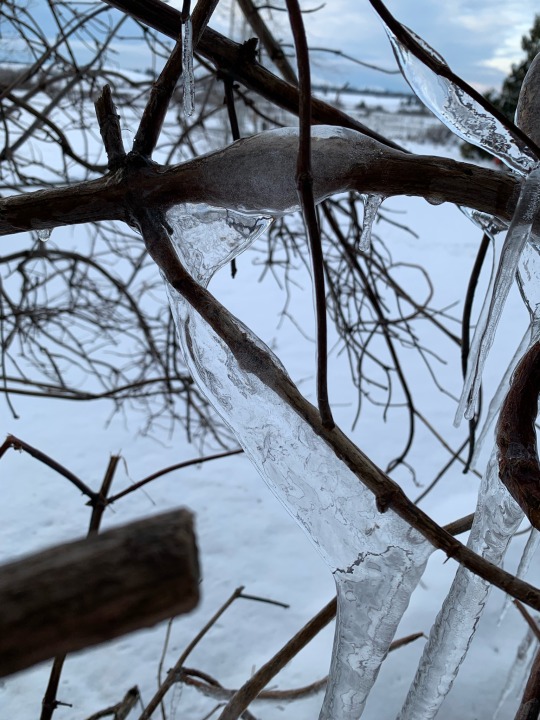
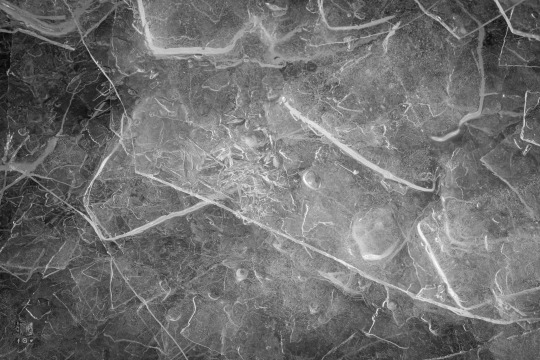
I found some interesting icicles on the elderberry bush yesterday. I’ve never seen it hang in sheets off the branches like that before.
7 notes
·
View notes
Text
Glacial Streams / The frozen north
7 notes
·
View notes
Text
The Arctic ice sheets are melting. Many already understand that is will lead to sea-level rise, but there is another effect that this may have on the world. In the past the melting of large masses of ice in the Artic Ocean has happened before and they had massive effects on the climate. Europe cooled dramatically, especially in winter, and Asia showed signs of desertification. Climatologists believe that these temporary climatic shifts may happen again now that the Arctic ice sheets are melting due to human driven climate change.
You may wonder how melting ice sheets may make parts of the world cooler. Some might know of the albedo effect. The white of the ice reflects the energy of the sun back into space. As the ice melts there is less white to reflect the energy and more heat remains on Earth. If the heat is increasing, then how can parts of the world become cooler? This is because the chain reaction that leads to potential cooling isn’t linked to the amount of ice left, but the amount melted. When ice melts, fresh water is added to the ocean and this influences how the ocean functions.
Oceanic circulation is often called a conveyor belt by oceanographers. Ocean waters rise in the Northern Pacific Ocean and the Indian Ocean. Then they travel across the surface to eventually sink again in the North Atlantic Ocean. From there they travel across the bottom of the ocean back to the Pacific and the Indian Oceans. Figure 1 shows this circulation. It takes centuries for waters to travel along the entire conveyor belt, but if the circulation gets disturbed the effects may be noticeable quite a bit faster. This may be a good hundred years, but that is quite fast on a geological time scale.
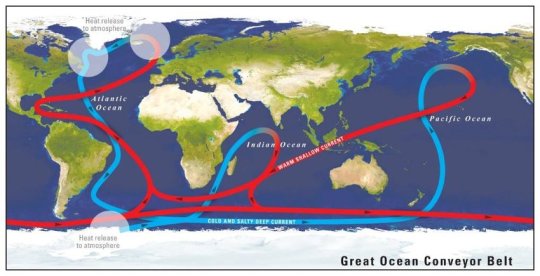
Figure 1: This map shows a simplified image of the Great Ocean Conveyor Belt. Arrows indicate the direction in which the water travels. Blue indicates deep water currents and red indicates surface water currents (Source: IPCC 1996, based on Broecker (1987)).
So what happens if a lot of fresh water from icebergs gets added in the area where the waters sink? To answer this question we need to know the mechanisms behind the sinking of these waters or, as it is also called, the North Atlantic Deep Water formation. The warmer waters that arrive from the south are saltier without being heavy. This is due to the different properties water can have at different temperatures. As the waters travel north they become colder. The higher salt content causes the waters to become heavier and eventually sink. Much like water evaporates more when the air is warm and then falls down as rain when the air cools. When fresh water is added to these waters their salt concentration decreases and therefore the speed at which they sink decreases as well.
Scientists have measured a slowing down of North Atlantic Deep Water formation in certain places in recent years. They have also observed mass melting of icebergs in the distant past. These are called Heinrich events and can be observed in oceanic sediment by the large rocks that fell as the icebergs melted. Both computer models and natural records from prehistoric times show a chain of events caused by this melting and subsequent slowing and/or stopping of the North Atlantic Deep Water formation. Figure 2 shows a simplified map of climate anomalies from an event that happened 8,200 years ago. Lands near the North Atlantic cooled down, especially during winter, Africa and Asia saw decreases in rain, and the Americas suffered from increased winds.
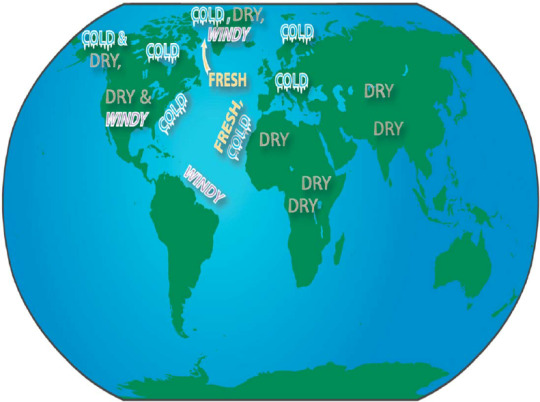
Figure 2: Summary map of climate anomalies during the 8k event (from Alley & Argustsdottir (2005)).
But how can one part of this circulation cause effects as far away as India? Lets go back to the name ‘conveyor belt’. If you stick a screwdriver in the place where the conveyor belt at a supermarket cash registry disappears down, the whole belt will stop moving. The same applies to the oceanic conveyor belt to a degree. If no more water sinks in the North Atlantic Ocean the rest of the system will slow down and stop as well. The oceans have a massive influence on the climate of the world, especially on landmasses near these oceans. Warm waters from the equatorial region move north and release their heat (also shown in figure 1). During winters this means that temperatures do not get as low as they could. If no more warm waters move north this influx of warmth is also gone. North America and Europe suffer much colder winters in this scenario. Models and prehistoric records have shown the formation of sea ice in Europe in these conditions. In Africa and Asia monsoons are very important for the formation of rain. Monsoons form due to the balance of ocean temperatures and land temperatures. The slowing and/or stopping of the ocean conveyor belt will change this balance and the characteristics of the monsoons will change, leaving Africa and Asia drier than before.
However, we shouldn’t panic and start worrying about apocalyptic winters in Europe or massive crop failures in Africa and Asia just yet. The Earth’s climate is a system about balances. A balance can be upheaved, but as long as certain thresholds aren’t passed the balance will be restored. The slowing of North Atlantic Deep Water formation that has been measured in certain spots recently doesn’t mean that the whole system will be messed up. In other areas the waters are still sinking at regular speeds and scientists haven’t measured any of the other waters moving towards these sinking spots slowing down. Even if it came to it, the conveyor belt can restart and speed back up again, as it has in the past. This article isn’t written for the purpose of scaremongering. It is a look at a truly tiny part of the massive system of checks and balances that influence the climate on Earth. How complicated it is to predict how the human driven climate change will effect the Earth in the long term. There is a reason why we changed from talking about Global Warming to Climate Change. In the past Heinrich events and the climatic changes linked to it were most often observed at the end of ice ages. The Earth was warming, but would temporarily cool down again. However, the forcing behind the warming was too strong and the Earth would continue to warm. If the forcing had not been as strong, the Earth could have gone back to the way it had been before (the ocean conveyor belt never stayed still). This is why we talk about thresholds and tipping points. The Earth can regain her balance. It will take a long time, but we can help her along the way.
If you want to read more about the North Atlantic ‘conveyor belt’ and the associated climatic changes a good place to start is: Alley, R. B. (2007). Wally was right: Predictive ability of the North Atlantic" Conveyor belt" hypothesis for abrupt climate change. Annual Review of earth and Planetary sciences, 35(1), 241-272.
Reference:
Alley, R. B., & Ágústsdóttir, A. M. (2005). The 8k event: cause and consequences of a major Holocene abrupt climate change. Quaternary Science Reviews, 24(10-11), 1123-1149.
#climate change#climate crisis#climateaction#crisis#environmental activism#activism#climate activism#activist#climate science#climate#weather#glacier#atlantic records#conveyor belts#arctic#ice sheets#ice caps#melting#global climate change#global
93 notes
·
View notes
Text
Wind blowing against the freezing ice at the Confederation Bridge in Canada created this "ice shredder" effect.
#interesting#interesting facts#nature is everything#nature is weird#nature#discover#thats interesting#thats incredible#thats insane#ice#ice sheet#ice sheets#cold#cold weather#temperature#canada#optical illusion#optical illusions#illusions#illusion#but woah#woah woah woah#woah :0#woah dude#woahhhh#like woah#woah#nature is healing#nature is beautiful#nature is art
3 notes
·
View notes
Text

Ice on Lake Superior | Feb. 2023
//Instagram
#photography#photographers on tumblr#lake superior#ice#snow#winter#black and white#nikon#d750#90mm#macro#macro photography#icicles#ice sheets#bnw#nature#nature photography
10 notes
·
View notes
Text
youtube
Melting ice sheets are the biggest danger to sea level rise. But researchers are investigating whether there could be a way to stop the flow of ice. Could these far-out ideas be worth it?
Credits
Reporter: Adam Levy
Video Editor: Joe Wright
Supervising editor: Joanna Gottschalk
Thanks to: Bethan Davies & Helene Hewitt
We're destroying our environment at an alarming rate. But it doesn't need to be this way. Our new channel Planet A explores the shift towards an eco-friendly world — and challenges our ideas about what dealing with climate change means. We look at the big and the small: What we can do and how the system needs to change. Every Friday we'll take a truly global look at how to get us out of this mess.
#PlanetA #SeaLevelRise #IceSheets
Read more:
Marine Ice Sheet Instability:
https://www.antarcticglaciers.org/ant...
The hysteresis of the Antarctic ice sheet:
https://www.nature.com/articles/s4158...
Geoengineering polar glaciers to slow sea-level rise:
https://www.nature.com/articles/d4158...
Chapters
00:00 Introduction
01:20 If all the ice sheets melted
03:46 The tipping point
05:32 The impact of sea level rise
07:36 What can we do about the problem?
12:11 Conclusion
#dw planet a#solarpunk#climate crisis#climate chaos#climate change#global heating#global warming#Tidalpunk#ice sheets#rising sea levels#sea level rise#ocean#sea#melting ice#Youtube
4 notes
·
View notes
Text
Local weather scientist warns of implications of 2023's unexplained excessive warmth
Information: NOAA; Map: Erin Davis/Axios Visuals
The pinnacle of NASA’s Goddard Institute for Area Research is sounding an alarm within the scientific group — albeit a nuanced one — over how unexpectedly vital 2023’s warming was.
Why it issues: Scientists do not but know why the world warmed by about 0.2°C (0.36°F) greater than would have been anticipated throughout 2023, lasting into this yr,…

View On WordPress
0 notes
Text

♡
1 note
·
View note
Photo
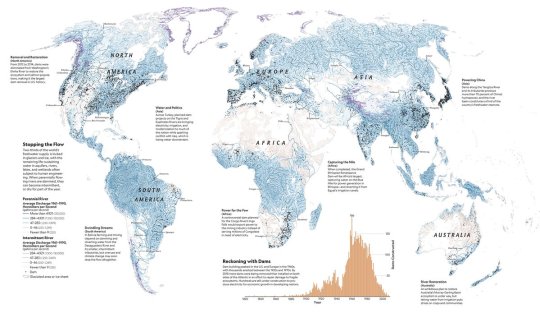
This map from the NatGeo 11th edition Atlas of the World shows the world's perennial and intermittent rivers, ice sheets, and major dams.
by @NatGeoMaps
67 notes
·
View notes
Text
Arctic permafrost is melting an is a "sleeping giant" of greenhouse gases.
The cryosphere is a top priority, given the increasing impacts of diminishing sea ice, melting glaciers, ice sheets, permafrost and snow on sea level rise, water-related hazards and water security, economies and ecosystems.
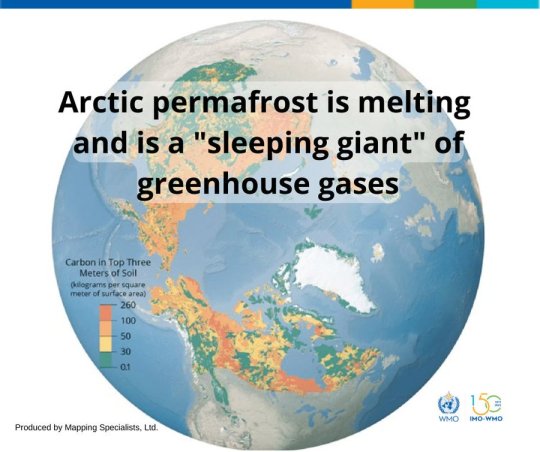
#sea level rise#water-related hazards#glaciers#ice sheets#permafrost#Earth's concern#Soil#greenhouse gases#climate change#World Meteorological Organization (WMO)#mapping specialists#cryosphere#snow
0 notes
Link
#adelie penguin#adventure#adventure travel#antarctic peninsula#antarctic treaty#antarctica#birds#candice gaukel andrews#climate change#conservation#ecotravel#ecotourism#environment#global warming#great barrier reef#ice sheets#national parks#natural habitat adventures#nathab#nature#nature lovers#nature travelers#penguins#remote#science#scientific research#sea level rise#tourism#travel#wallace stegner
0 notes
Text
Water. Salt.
I humour myself with a fantasy of thousands of beach chairs in the Bahamas washing ashore close to Orlando.
0 notes
Text

And so @viktuuri-week starts!
Day 1: Music
I was in one hell of a time crunch to make all the illustrations because I procrastinated UuU But I took most of these works as opportunities to experiment a bit with some ideas so I had fun.
Credit to TheMoonChild on Musescore.com for the arrangement of Yuri On Ice used.
#i made this so goddamn fast yall#i had no time#this is literally the very first rough sketch just cleaned a bit and filled in and then every layer effect in csp#i had fun though#i was really hating it until i started playing with the background and then it all came together#also i know i committed crimes against that sheet music by compressing it but i swear it was worth it#also unintentional but yuuris colours be lookin a lil gay#and i cant say im mad at it#especially since i wouldve done it anyway if i knew how#idk what i did#layer effect magic#yuri on ice#yoi#yuri on ice fanart#yoi fanart#fanart#art#arom antix art#arom antix#katsuki yuuri#viktuuri week
602 notes
·
View notes
Text
youtube
Check out America Outdoors: Understory at https://youtu.be/s-R1p89zHnk
PBS Member Stations rely on viewers like you. To support your local station, go to: http://to.pbs.org/DonateTerra.
A “tipping point” is when a system, with just a small amount of additional energy, is pushed from one stable state to another suddenly and dramatically. This can be a chair falling backwards. Or it can be a major earth system collapsing.
The IPCC recently identified 15 potential climate-related tipping points that scientists have grown increasingly worried we are getting close to crossing due to global warming. In this episode of Weathered, we look at 6 of the major candidates, how they are all interconnected and influence each other, and what it would mean if they were triggered. These tipping points or tipping elements are the Greenland and Antarctic ice sheets, the Amazon rainforest, global monsoons, the AMOC (Atlantic Meridional Overturning Circulation) and the earth’s permafrost and coral reefs.
The consequences for any of these systems being pushed over the edge would be truly catastrophic and would encompass everything from massive droughts, loss of biodiversity, increased flooding, heat waves, large scale climate migration, food shortages, and much more.
Weathered is a show hosted by weather expert Maiya May and produced by Balance Media that helps explain the most common natural disasters, what causes them, how they’re changing, and what we can do to prepare.
Check out America Outdoors: Understory at https://youtu.be/s-R1p89zHnk
Subscribe to PBS Terra so you never miss an episode! https://bit.ly/3mOfd77
And keep up with Weathered and PBS Terra on:
Facebook: https://www.facebook.com/PBSDigitalSt...
Twitter: https://twitter.com/pbsds
Instagram: https://www.instagram.com/pbsds
#pbs terra#solarpunk#global heating#global warming#climate chaos#climate crisis#climate change#IPCC#ice sheets#amazon rainforest#monsoon#AMOC#Atlantic Meridional Overturning Circulation#permafrost#coral reefs#Maiya May#Youtube
2 notes
·
View notes
Last Seen Blogs

thuvienanhdotnet
Thuvienanh.net

nickblount83
🎹💡
euronyymous
𝔒𝔶𝔰𝔱𝔢𝔦𝔫 𝔄𝔞𝔯𝔰𝔢𝔱𝔥

bloodcrimsonrain
semi-hiatus

tsu-kitsu
Tsukitsu