wagginstaff-bct-blog
Wagginstaff @ BCT
My name is Alexander Wagstaff - An aspiring student in creative technologies @ AUT
147 posts
Don't wanna be here? Send us removal request.
Last Seen Blogs
dreymide
A documentary and conceptual photographer

desiner12
부천 40대 네토 부부

queenmea604
SKZ OT8

enbymattel
the dolls, they antagonise me

stockingswhynot
Girlskneesocks
Text
Method Statement:
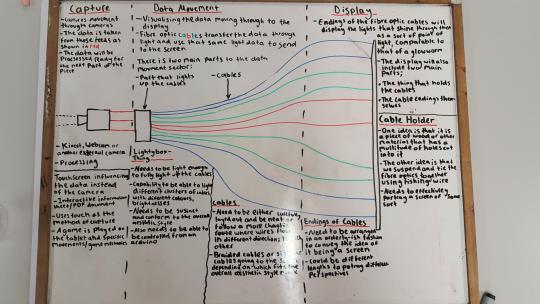
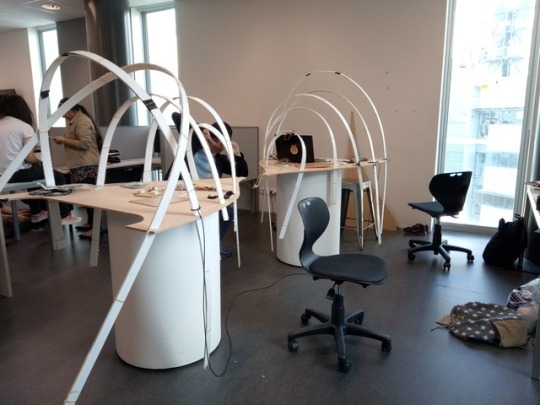
CLOUD has been created to show the internet by simulating industrial level fibre optic internet cabling with over 1 Km of optic cabling consisting of various thicknesses of 0.75, 1.0, and 1.5mm. We wanted to connect people to the physical internet in a manor beyond the standard Wi-Fi icon on a screen. Constructed to bring about discussion concerning the often-neglected physical aspect of the internet. The optic-fibres were a main focus during the development of the installation. Serving its purpose through generating a changing aesthetic that can be linked back to a growing trend of resources and energy consumption. Physically, CLOUD consists of four main elements; the Mac (presenting the infographic), the desk (the projector housing), the fibre optics, and the fibre optic hanging display.
Due to the volatility of the build, constant iterations and design refinements had to be considered to compensate for design and functionality changed throughout development. Other factors that influence the build included; the budget of the project, time constraints, and risk of failure if experimentation-gone-wrong resulted in damaging our limited amount of optic-fibres. Within these constraints we chose to make the build of the project from materials that could easily be interchanged and reiterated during construction, rather than those which served the highest price.
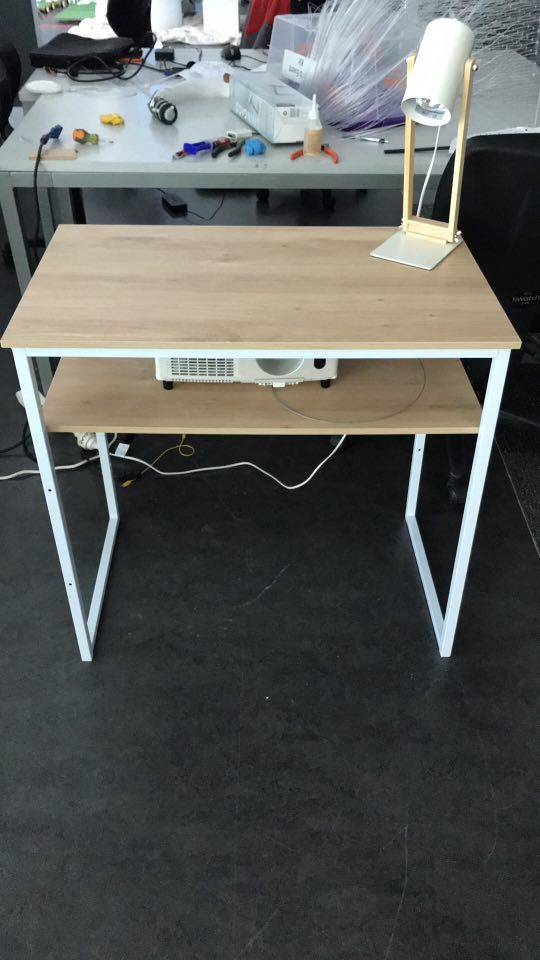
The Mac & lamp sit on the desk to serve the purpose of showing the user end of the internet as many of us see in our homes, offices, and schools. creating the ‘relatable’ side of the project to ground it in everyday problems before expanding the display into greater, more lucrative aspects of the internet functionality. The minimalist desk is used in the project to keep the focus on the fibre’s, making the display relatable on the end of the Mac but as simple as possible at the same time. The desk also acting to house the illumination of the project.
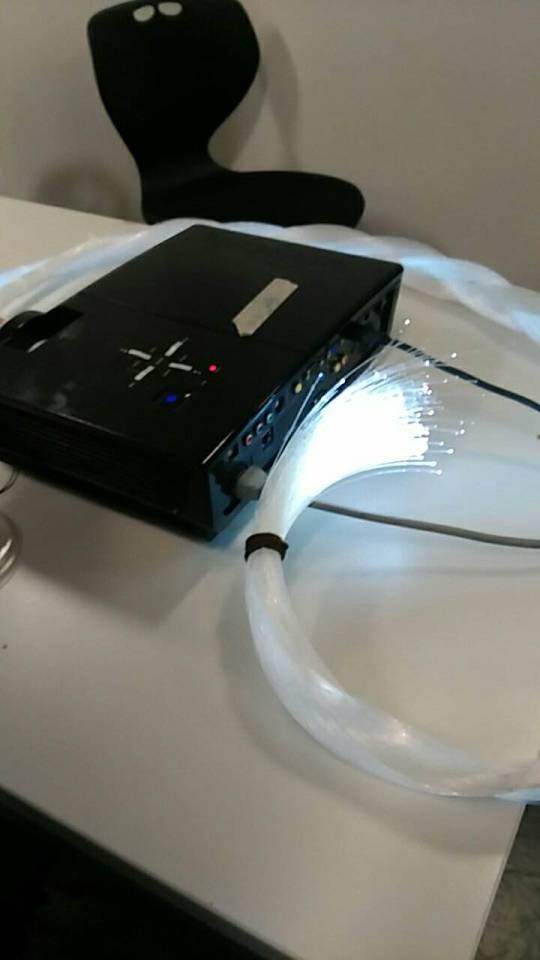
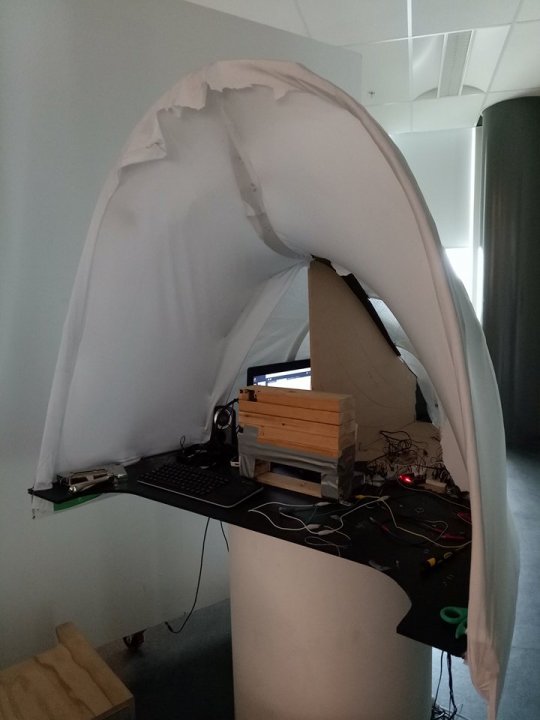
This housing is kept under the desk in the box which was laser cut to efficiently allow the fibres to exit whilst also cooling the projector. As safety and longevity of the project was a high concern for us we have an effective cooling system consisting of two PC fans installed to the box to keep the projector temperature regulated. This means CLOUD will continue to function for its duration (of five days) without maintenance. Cable management has also been solved using this housing to maintain the clean aesthetic. Inside the housing away from the viewer we hide the power to the Mac, lamp, projector and fans as well as the required data cables to run the display.
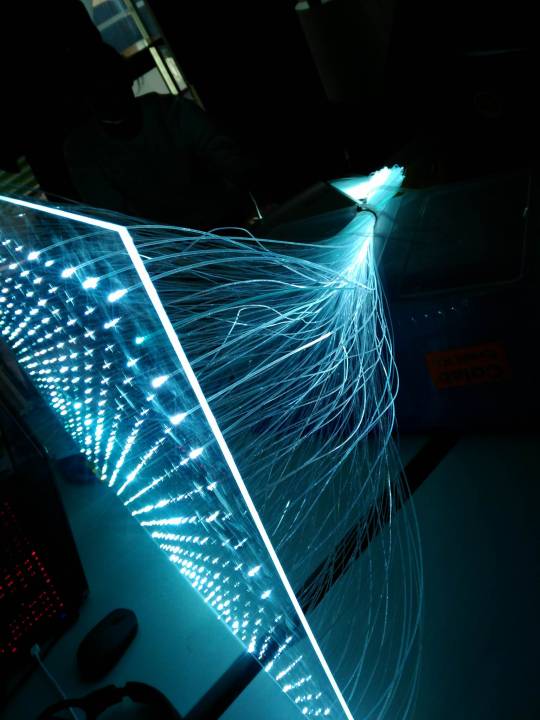
Feeding from the desk are our fibre optics. As we wanted to make the illumination from the fibres dynamic, we couldn’t light them from a traditional lightbox. This led to much experimentation ending with us clamping the fibres tightly and square against the projectors lens. Lighting the fibres through a projected image that can be dynamically (and randomly) changed in colour. Here we came to the solution of using an extensive amount of blu-tac to hold the fibres to the projector, as they have given us the desired result as well as allowing us to mould the alignment of the fibre-optics when necessary to maximise its light output. blu-tac also allows us to cause no permanent damage to the projector so it can be re-used for its original purpose after the lifetime of our display has been fulfilled.
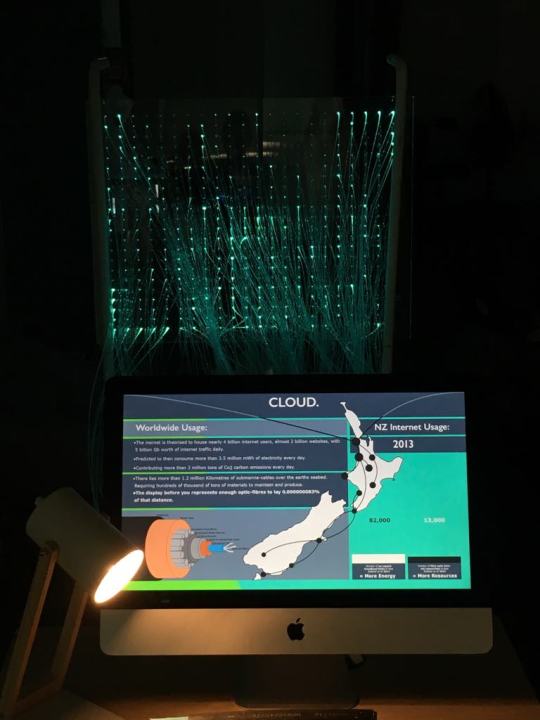
The infographic was created as a vector image designed in adobe illustrator, and rendered in combination with the dynamic colour pattern in processing. The infographic acts to show the more straightforward information concerning statistics around predicted: internet users, energy consumption, daily internet traffic, Co2 carbon emissions (internetlivestats.com, 2018), submarine cables and its material composition (telegeography.com, 2018). Localised internet usage in New Zealand (nzstats.com, 2018), and trends in fibre-optic connections in New Zealand (nzstats.com, 2016). The graphic then uses abstracted data sets from these
websites to help inform the magnitude of internet by-waste. The infographic and projected light pattern are also rendered together as opposed to two different sketches in order to provide a level of cohesiveness and a visible connection between the mac screens information and the optical-fibres. Where the rate of colour change and rise in internet usage within New Zealand is then mirrored through the fluctuating lighting changes. Turning onand-off to mirror the inspiration taken from binary code and data transfer.
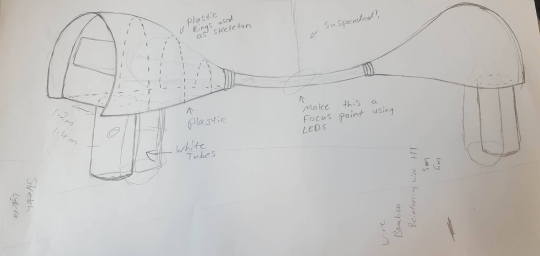
Outside the constraints of the studio environment the Perspex fibre optic display of CLOUD would be hanging to minimize the footprint of the project in its exhibition space, keeping the focus on the fibres. However, as this wasn’t a possibility we instead created a stand to hang it from with the aim of an ‘industrial’ aesthetic to reflect the industrial aspect of the internet. Our methodology behind the stand was to make as ‘invisible’ as possible whilst acknowledging it in our build rather than trying to hide it. The display of the project is fabricated from acrylic plastic, a translucent plane in which the ends of the fibre optic cables are arranged into a grid like formation to mimic a screen. Secured into laser cut holes in the acrylic with adhesive, the display is then suspended in the air using a repurposed metal frame.
Technologically, CLOUD incorporates aspects of digitally represented data, infographic design, structural engineering, visually represented data, electronic design and physically represented themes through design processes. Using the physical infrastructure itself as a medium reflects the intentions of the artwork as well as being an effective way to abstract immaterial data into a tangible artefact as per our initial aim. Fibre-optics forms both the aesthetic and narration CLOUD to become a reflection of the price of information in its rawest form.
Individual and collaborative roles in the making of CLOUD:
Matthew Newick: Lead of the construction visuals and material designer.
Kale Buchanan: Final physical fabrication and creator of physical prototypes throughout the development process to the team’s brief/s.
Alexander Wagstaff: Conjoint researcher for infographic, as well as digital designer for said infographic. 7Also, programmer concerning any digital prototypes, techniques, and final processing sketch on display.
Adam Perry: Initial Research/concept development and iteration, design researcher
Infographic references:
Live internet statistics, (updated daily, 2018). Retrieved from URL: http://www.internetlivestats.com/ Statistics from website are predicted using:
United Nations Economic and Social Council (15 December, 2014). 2010 and 2020 World Population and Housing Census Programmes. Retrieved from URL: https://unstats.un.org/unsd/docs/2015-6-Censuses-E.pdf
International Telecommunications Union (2009). Manual for Measuring ICT Access and Use by Households and Individuals. Retrieved from URL: https://www.itu.int/en/publications/Pages/default.aspx
Stats NZ (20 March, 2018). Topic: Information and Communications Technology. Retrieved from URL:https://www.stats.govt.nz/topics/information-and-communicationtechnology?gclid=CjwKCAjwgYPZBRBoEiwA2XeupWI3yRUfcNRx4I1Kid7IhWMGRJgx5Uu mrMrhZlSyGiNnOBMCJazTVRoC2FwQAvD_BwE
Stats NZ (14 October, 2016). Internet Service Provider Survey: 2016. Retrieved from URL: https://www.stats.govt.nz/information-releases/internet-service-provider-survey-2016
TeleGeography (Updated 2018). Submarine Cable 101. Retrieved from URL: https://www2.telegeography.com/submarine-cable-faqs-frequently-askedquestions?__hstc=196094579.eeae409a04f066114b91de109a7d5cf2.1528877726609.1528877726609.1528877726609.1&__hssc=196094579.1.1528877726610&__hsfp=1232023527
2 notes
·
View notes
Text
Conceptual Statement:
CLOUD is a veritable installation aimed to inform society's attitude towards the environmental impacts of the internet through the expression of its physical nature and resource consumption.
Through a critical analysis of the processes which produce some of the world’s most ubiquitous technologies, we discovered our own ignorance towards humanities many adverse effects on the Anthropocene. The most typical example of this being the internet, we access it without limits or restraints and our perception of this technology carries no regard for its physical presence and its subsequent environmental impact. Since its inception, telecommunication has very much been a physical process; consider an old telephone exchange, it took a human operator to physically connect your line. This human hand and inherent physicality has not since been lost, simply hidden as modern technology becomes increasingly inconspicuous. Allowing us to ignore our responsibility for its subsequent impacts. CLOUD is a parable of our increasingly resource dependant society and our failure to acknowledge the physical reality of our digital habits. Public misconception has since shrouded the internet as a transcendent technology, presented as intangible or Immaterial, we fail to acknowledge the cables, circuits, materials, and energy consumption demanded by a modern audience. This “cloud” is not a cloud at all, but instead a vast network of cabling, overseas servers, and infrastructure encompassing most of the Earth. Consuming an incredible amount of energy in data transfer and storage alone, questions should be raised concerning the future sustainability of rising energy, resources, and costs of physically creating such an expansive network.
Mimicking the use of fibre-optic technology, CLOUD aims to visualise the process of data download and upload in a tangible, confronting manner. We have abstracted data from its digital form by presenting it purely as light, binary connections, on and off, 1’s and 0’s, acknowledging that even in its purest, fundamental form, information has not transcended a physical presence. Where something as benign as light is indispensable to the internet’s existence, yet many people fail to make the association with their transfer of data and the technology that underpins it all.
In contrast with how we began this project, CLOUD now stands as a result of much exploration into the concept and build. Beginning with the admittedly ambiguous theory of human Anthropocene, discussion and development acted to refine that down to “what is an unseen, or possibly unacknowledged human influence on today's environmental landscape.” While presenting many options, the internet was eventually chosen. However, this was still an incredibly broad subject to approach in a single semester and was then reduced in scope to the singular aspect of data and its energy, as well as fibre-optics and its material waste. The build itself was then redesigned multiple times with key focus on being informative and interesting at both ends of the display. When compared against earlier designs of projecting a live video feed, or translating binary messages, the use of a dynamic infographic that influences the refresh rate of the optical-fibres is stronger in being both informative about hard facts, whilst providing a level of cohesion between the two sides.
0 notes
Text
Contextual Statement:
RQ: “In what way can we represent the potential for environmental ramifications and the consumerist nature of the internet through a tangible and informative medium”
Authors that informed our concept:
Our research process began with the idea of societies inherent interconnectedness, yet in spite of this, an individual's inability to look beyond what immediately impacts them to consider the greater network remains almost non-existent. Since the inception of now ubiquitous technologies this problem has been well documented, the essay “I, a pencil” (Read, L. 1958) Leonard E Read dissects the life of a pencil, one of the most basic yet influential pieces of technology, with the intention of breaking down each step of its creation. Drawing attention to the “symphony of human activity” required for even the most basic technology to exist, raising an interesting contrast against something as vast and omnipresent as the internet. CLOUD presents the internet as exactly that, the outcome of extensive labour and industry.
“This is the world we live in, if we weren’t surrounded by it every day, if we didn’t take it for granted, we’d be dumbstruck by its very intricacies and brilliance.” (Read, 1958) Reads expression for gross public misconception has also been shadowed in the presentation of Andrew Bloom during his Ted talk seminar. Who, while not quoting the author directly, shares parallel thoughts when describing the process of the internet; “Whenever we put something on the cloud, we think of losing responsibility for it.” (Bloom, A. 2012) Bloom makes this point in the concluding statements of his presentation after expressing his personal investigation into the internet. Realising his own misconceptions following an amusing incident of a squirrel ‘eating’ his internet, his journey did not end until seeing one of the various submarine cables pulled from the ocean and reconnected by hand. Where the internet has always been the created and maintained through manned labour interacting with it directly. For every computer connected to the internet, is connected to every other device through a band of light and waves, facilitated by the material fibres that allow this code of photons to pass through.
“The immaterial Internet runs on a very material, industry-like infrastructure” (Bloom, A. 2012)
While the actual physical connections between internet users has been outlined by Boom, he does not go into the era of information dependence we now find ourselves in like speculative designer Thomas Thwaites does. Raising questions around our dependence on energy distribution and the sustainability of modern society. Energy futures (Mazé, Messager, Thwaites & Önal, 2013) is an examination of social trends regarding energy usage. This project depicts a future where ‘flick of the switch convenience’ is no longer feasible due to the influence of external factors on electricity generation e.g. environmental factors as a result of climate change, forcing us to critically reflect upon our consumption habits and the subsequent environmental ramifications. Through a process of exploration and reflection we identified similar trends existent in societies relationship with the internet, whilst adverse effects on the environment are less obvious due to a lack of knowledge surrounding the infrastructure and industry that underpins it all the effects are no less severe.
Existing artworks that informed the techniques and aesthetic:
The Immaterial project, created by Timo Arnall, Einar Sneve Martinussen, and Jack Schulze (Arnall, Sneve Martinussen & Schulze, 2011) demonstrates an example of visualising seemingly immaterial forces (in this case Wi-Fi signals) through light. Expressing a visual map of the digital environments through the use of LEDs and exposure photography. While not directly relatable in its method, it does provide an interesting concept into visualising data transfer through the internet. A concept of data transfer and interaction also exhibited in Mark Hansen and Ben Rubin’s ‘Listening Post’ (Hansen, M & Rubin, B. 2011). Featuring a display wall of multiple screens displaying messages sent through random chat rooms and forums on the internet in real time. Creating a display of apparent randomness when valued message by message, but becomes dynamic and alive through the metadata-like presentation of various interactions constantly firing within the internet. While people's connections were only partly explored during development, the power of displaying constant activity and interactions was well realised. A strong aesthetic of fluctuation in patterns can help to give an appearance of life and movement to the fibre-optics with the intention of having it appear larger to fill a real space in studio.
The concept of visualisation through abstract has also been developed in ‘Fibre Optic Ocean,’ by Ozge Samanci (Smanci, O. 2015). However, this time much more closely related to the internet’s environmental influence. Making use of real time data to influence the display and visualise the fluctuations in both shark and internet activity. By using key data related to shark movements and internet usage, Samanci is successful in relating the artefact to a larger issue through connecting its meaning to an ongoing present time. Used as a tool to generate musical scores and influence the light patterns in the display. Where fibre-optics acted as a direct reflection of the materials impacting sea life, while also incorporating the aesthetics of fibre optics in a meaningful way. Drawing on this, and despite not being able to utilize live data due to copyright, CLOUD is also rooted in the environmental influence of internet fibre-optics, but adapted and expanded to also reflect the energy consumption and destabilising sustainability of the internet connection.
In essence, this design future speculates on the adjustment of established behaviours, something CLOUD asks our audience to reflect on while remaining heavily inspired by the combination of works above. CLOUD intends to develop these broad observations of connection, energy, and material process’ into a focused abstract of this unappreciated force as a tangible and informative artefact.
References:
Read, L. (1958). I, pencil: My family tree as told to Leonard E. Read.
Blum, A. (2012, May). Tubes: A Journey to the Center of the Internet. New York: Ecco.
Arnall, T. Sneve Martinussen, E and Schulze, J. (2011). Light painting Wi-Fi. Retrieved from URL: http://yourban.no/2011/02/22/immaterials-light-painting-wifi/
Samanci, O. (2015) Fiber Optic Ocean. Retrieved from https://vimeo.com/139216831
Hansen, M & Rubin, B. (2011). Listening Post. Retrieved from URL: http://earstudio.com/
Mazé, R., Messager, A., Thwaites, T., & Önal, B. (2013). Energy Futures.
0 notes
Text
Reflection 8: Brief recount of construction.
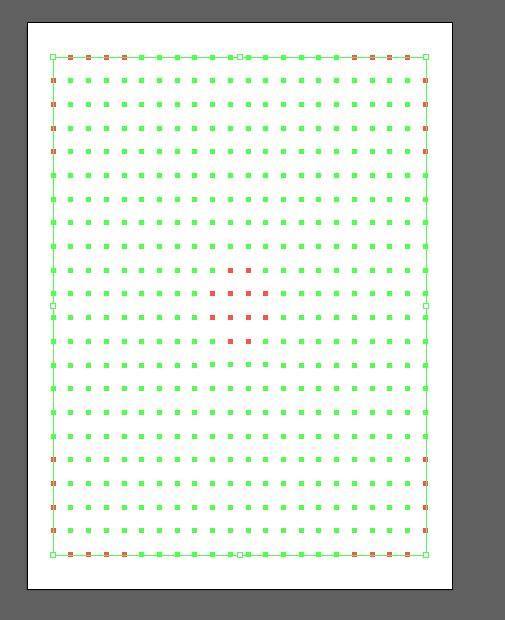
The later parts of the physical construction was primarily led through Matt in design, and Kale in construction of the build. While I Led the digital display and projection while Adam focused on research and development while helping with the digital half of the artefact. However, that isn't to say that work was never done solely individually. As the same level of conjoint work and development was also demonstrated in the final weeks of construction. With everyone helping out on construction when tasked required more than one person, especially during the creation of the acrylic screen where we would take turns in drilling, gluing, and supporting each of the >450 individual points of fiber.
*Below is the (admittedly low resolution) image of the laser cutting file used to cut out the acrylic panel. The red dots are circles of 1.0mm diameter while the green is 1.5mm in diameter. Unlike originally intending to have this randomized, I had eventually decided to give the 1.5mm optics a distinct pattern with the intention of 'containing' the display using the thicker parts at the outsides, drawing more attention to the thick ones about the middle.*
0 notes
Text
Reflation 7: Processing sketch and intent
Because of the nature of lighting the optic fibers through a projector, individual strands could not be mapped to create an image that does not end up randomized. Instead, information could instead be shown through a dynamic rate of change in the colours projected onto the ends. While this is not as accurate in a display, I found it was still capable of forming a connection between the trend of rising resource consumption in New Zealand that was identified in my previous blog through the rise and fall in the speed of colour change based on the rise and fall of internet consumption.
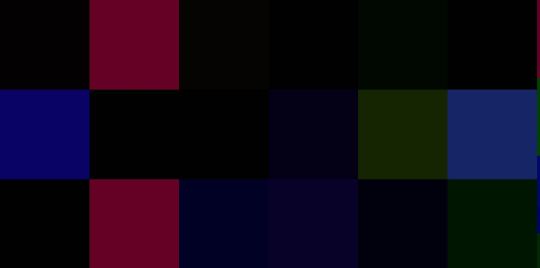
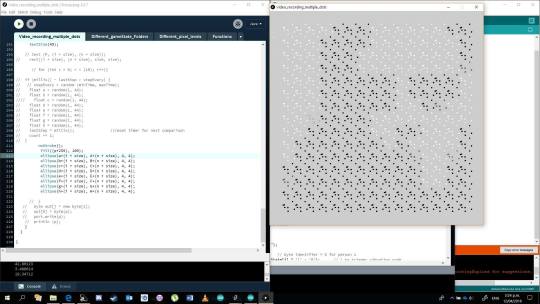
The original processing sketch was designed as an array of squares. Randomly changing in both colour and placement in the projection. However, this method of pattern creation was eventually changed as the sudden randomization of colours gave an appearance more akin to Christmas tree lights. Coming off as corny and disjointed from what was shown in the rest of the display.

Through much experimentation into what looks nice as a method of pattern changing, we eventually settled on a gradually increasing circle , randomized in both colour and starting point, that would increase in size to completely fill the screen before beginning the creation of another circle and thus another transition into a new colour. The circle was also given a thick black border when rendering out of the projector as to further itself from the static Christmas light effect we grew to dislike earlier in development.
The infographic and projected light pattern are also rendered on the same processing sketch together as opposed to two different sketches. This was done with intent to provide a level of cohesiveness and a visible connection between the mac screens information and the optical-fibers colours. Where the rate of colour change and rise in internet usage within New Zealand is then mirrored through the fluctuating lighting changes and the visible trend of consumption in NZ.
0 notes
Text
Reflection 6: Information and the Infographic
After the lessens learned from the previously abandoned prototypes earlier, the development for the final display no longer focused on providing a level of interaction. I now believed giving personal influence over the display only served to devalue the significance of the internet and material upkeep on a worldwide scale by reducing it to game. This decision was also supported as we felt the inclusion of personal input also limited the scope of which our project could be a commentary to the singular aspect of the internet directly related to the form of interaction.
However, this also left a large gap in logic between the materials used for the display, and the now un-interactable display sitting opposite it. We refrained from removing the now pointless screen altogether as this would only serve to further isolate and obscure the meaning of the fibers should it be left unaccompanied by a method of explanation or context. Thus, our context for the artefact would be provided through the accompaniment of a infographic detailing statistics concerning the environmental impacts of the internet and to outline growing trends in the potentially destructive internet usage.
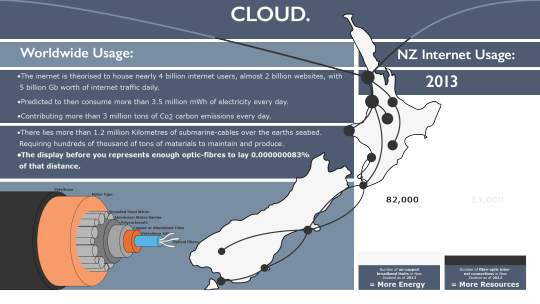
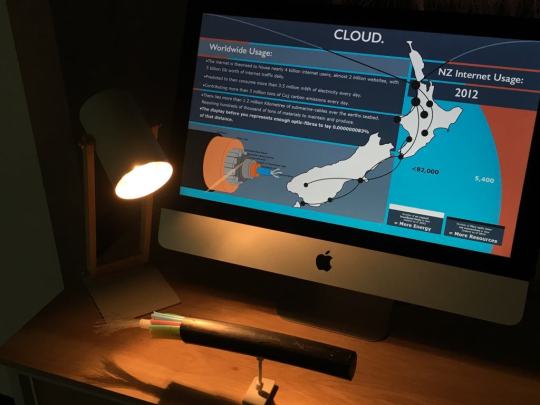
The infographic was created as a vector image designed in adobe illustrator. The infographic was then intended to act as a more straightforward method of detailing information concerning internet users, energy consumption, daily internet traffic, Co2 carbon emissions (internetlivestats.com, 2018), submarine cables and its material composition (telegeography.com, 2018). Localized internet usage in New Zealand (nzstats.com, 2018), and trends in fiber-optic connections in New Zealand (nzstats.com, 2016). The intent for the infographic was to split the presented statistics into two separate categories: One based around the larger globalized statistics surrounding pollution and resources used in cabling, the other being based around the much more specific growing trends of increasing fiber-optic connections and uncapped energy consuming data limits. I had chosen to use the two different target for the infographic as I believe each one works better in illustrating a specific aspect of the internet pollution: Worldwide statistics are used to build up he magnitude and scale the internetworks on. Allowing me to use the highest, most attention-grabbing statistics available. Meanwhile New Zealand was used to help then relate the impact of internet consumption to a target closer to the intended audience. Where the illumination of the growing trend can be used to reinforce to the observer that from a world-wide scale, to a continental scale, to an individual scale, all internet users contribute to the supply-and-demand of recourse consumption.

*Disclaimer: Inspired by Ozge Samanci's 'Fiber-Optic Ocean,' I had intended to make use of live statists found from https://www.internetlivestats.com. However, the use of the companies live stats is protected under copyright law as the numbers are generated from a licensed algorithm that uses data form United Nations Economic Council, and the International Telecommunications Union to create the predicted internet usage, energy consumption, and C02 pollution. However, I am able to use this site as a reference for predicted numbers and present them as an unchanging, static predicted number taken at a certain time. Therefore, all statistics referenced in the display, method, and blogs, has been taken from internetlivestats.com at 11.59pm, 04/06/2018. However, despite this setback in dynamic results, I instead chose to represent the more localized data related to NZs resource and energy consumption over the past six years of its recording from nzstats.com. now using multiple infographics that change every year between 012 and 2017 to highlight the growing trend I New Zealand, and by extension, the rest of the world.*
*Second disclaimer: All vectographic drawings used in the infographic have been created by myself but has been created through other imaged including a Map of New Zealand and a diagram of Submarine internet cables under the fair use, creative imagery license*
Infographic references:
Live internet statistics, (updated daily, 2018). Retrieved from URL: http://www.internetlivestats.com/
Statistics from website are predicted using:
United Nations Economic and Social Council (15 December, 2014). 2010 and 2020 World Population and Housing Census Programmes. Retrieved from URL: https://unstats.un.org/unsd/docs/2015-6-Censuses-E.pdf
International Telecommunications Union (2009). Manual for Measuring ICT Access and Use by Households and Individuals. Retrieved from URL:
https://www.itu.int/en/publications/Pages/default.aspx
Stats NZ (20 March, 2018). Topic: Information and Communications Technology. Retrieved from URL:https://www.stats.govt.nz/topics/information-and-communication-technology?gclid=CjwKCAjwgYPZBRBoEiwA2XeupWI3yRUfcNRx4I1Kid7IhWMGRJgx5UumrMrhZlSyGiNnOBMCJazTVRoC2FwQAvD_BwE
Stats NZ (14 October, 2016). Internet Service Provider Survey: 2016. Retrieved from URL: https://www.stats.govt.nz/information-releases/internet-service-provider-survey-2016
TeleGeography (Updated 2018). Submarine Cable 101. Retrieved from URL: https://www2.telegeography.com/submarine-cable-faqs-frequently-asked-questions?__hstc=196094579.eeae409a04f066114b91de109a7d5cf2.1528877726609.1528877726609.1528877726609.1&__hssc=196094579.1.1528877726610&__hsfp=1232023527
0 notes
Text
Reflection 5: working with fibre optics
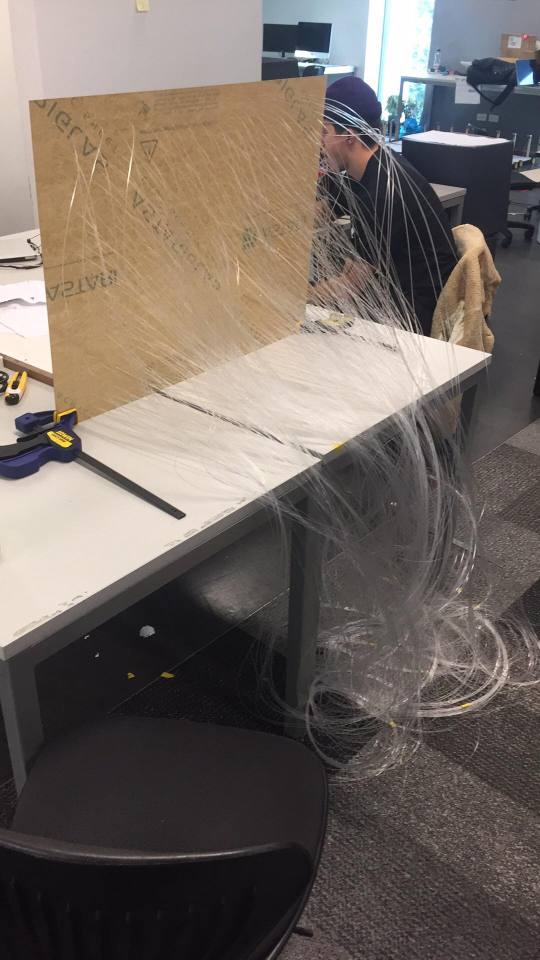
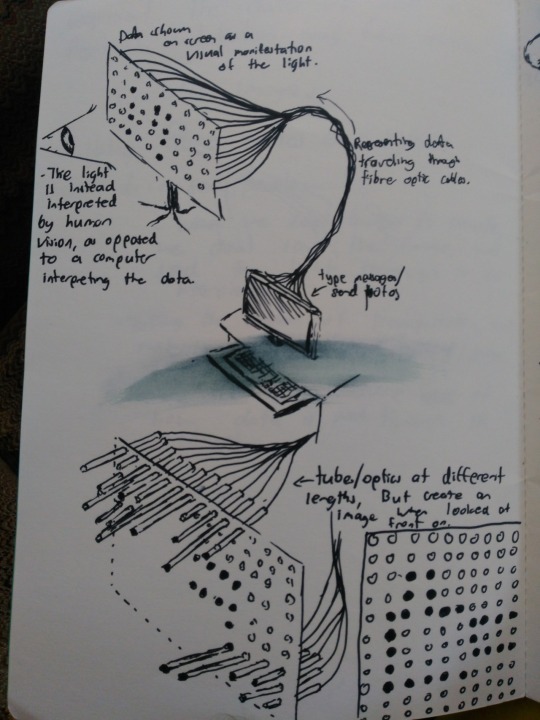
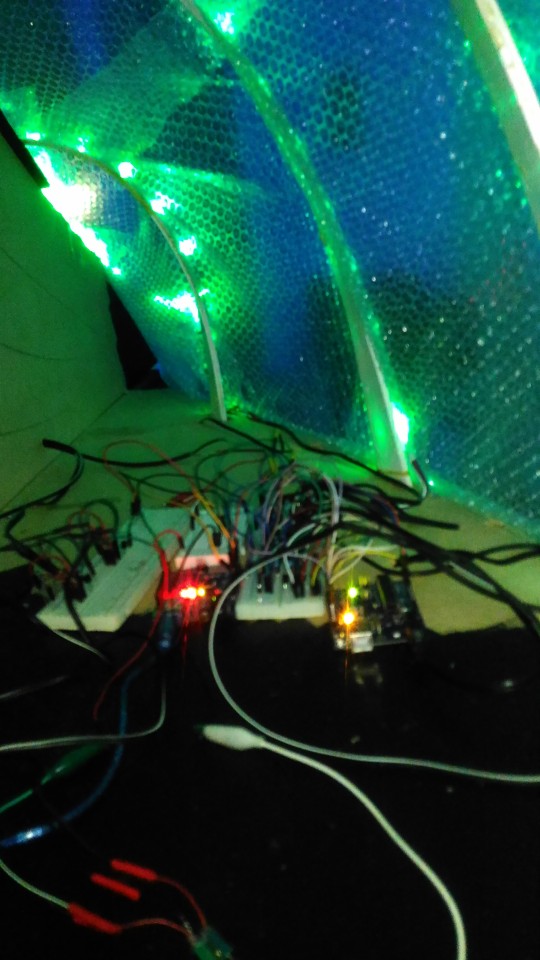
Some time during the development and testing of the other prototypes, the order of over 1000m of fiber optic cables came from Ali express. After which, we we're able to take our time, and explore the different physical ways of setting up the cables alongside the digital prototypes being worked on in processing. Working with the optics revealed the best way to light up the strands was to have a strong directional light shining into the ends. We tried many different thing to try and achieve this effect. From using the torch of a phone, to manipulating LEDs through sanding them down to a flat point or covering the ends in tinfoil to try and isolate the direction of the light at the optic ends.
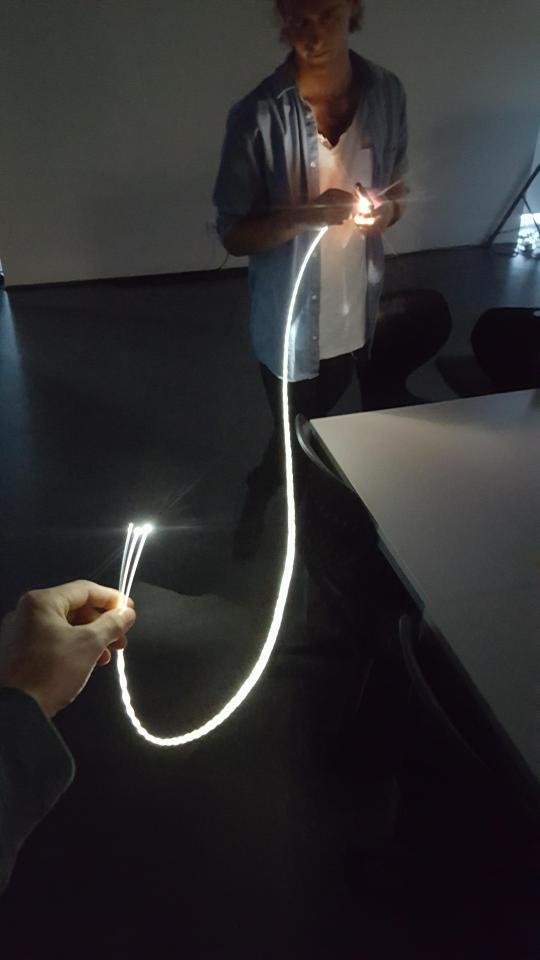
Through this exploration, the most effective, reliable, and simple method we found to illuminate the strands was to utilize the projector previously used to create the digital prototypes from earlier, and beam it directly into the exposed ends of the cables. By using this, we are able to adapt multiple colours and patterns through simply projecting different images into the ends.
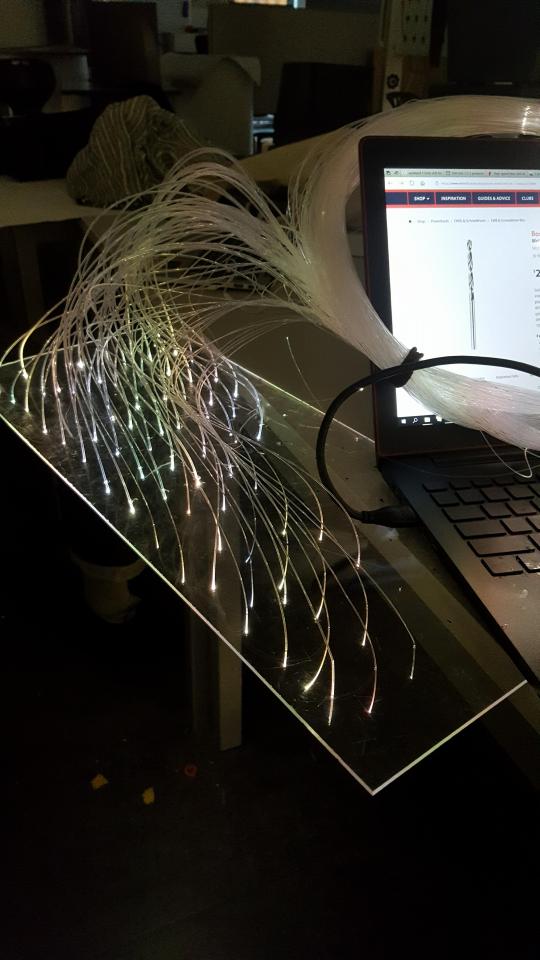
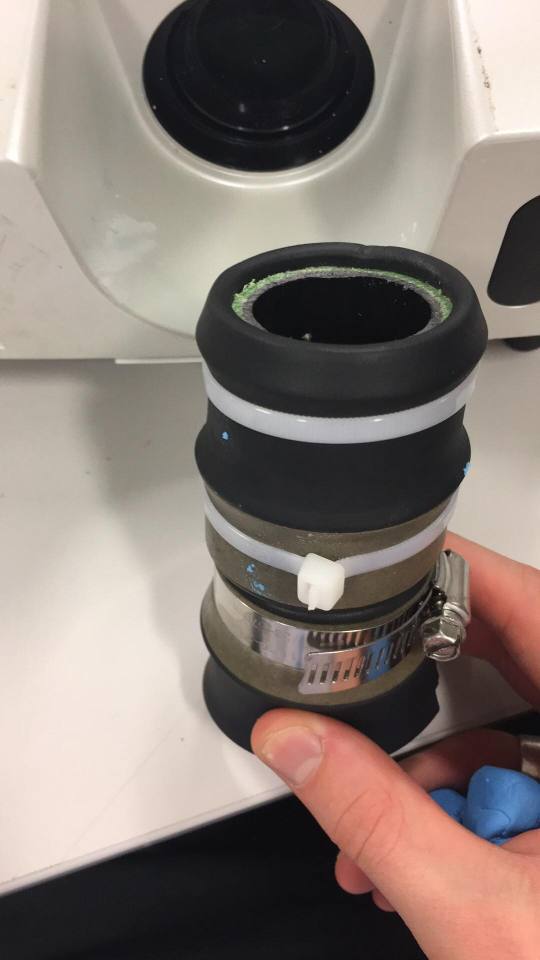
However, this chosen form of light projection also comes with some restriction in what patterns or projections can then be shown through the lights. As the points of the grid ultimately come to a smaller tube housing around 450 individual strands, the ends have basically become randomized and borderline impossible to predict what end point relates to a specific point on our grid. There is also the problem with a type of 'colour bleed' when displaying more than one colour at a time as the space between the lens and the fiber-optics is so short the image is blurred to the point of removing much of the fidelity of the projected image. Leaving the only opportunities for a dynamic or meaningful pattern come from the rate of change applied to all strands at once, or the colour used for each of them.
vimeo
An interesting art display by Ozge Samanci (Smanci, O. 2015) titles Fiber Optic Ocean, was a important source of inspiration for this stage of development as the artist makes effective use of the same materials as us (I.e. optical fibers), to communicate a problem (albeit much more specific) surrounding the use of fiber optic cabling along seabed's and how it has impacted aquatic sea life. The artist utilized live data concerning internet usage and sea life activity to influence the soundscape and coloured visuals of the display. Allowing him to form a connection between the two through the prominence of both almost 'battling' against one against the backdrop of skeleton and death, impaled and beautifully illuminated by, the submarine cables. The prospect of using live data to influence the display was then also explored as a technique during the development of the projected processing sketch and the infographic.
This was also the point in the project when the group became divided into two clear roles: kale and Matt would be focusing on the physical build and material aesthetics of the project while Adam and I would be working on the digital side and what should be displayed on both the screen and through the suspended cables.
Inside our role of being the on the 'digital' side of the output, Adam was tasked with gathering resources and supporting the argument for why our display should exist, while I focused on developing an informative display to properly communicate mankind's affects on the Anthropocene through the unexpected pollution from Internet usage.
0 notes
Text
Reflection 4; prototype 1.5
Realizing that the previous prototype failed in its communication of internet usage, we changed direction to try and focus on displaying something through the optics or computer that is more directly relatable to data packaging and light traveling through optic networks. During this point of the project I was still intent on including some kind of audience interaction with the artwork, so decided combining binary data and interaction to have someone type messages out and have it be translated into binary in front of them.
Reading binary: https://patents.google.com/patent/US4433352A/en
youtube
Method: Using processing, viewers would be able to type in messages or texts as they would any other device and have those words be translated in real time in both the binary text underneath, and the flickering of the fiber optics and it turned on and off to illustrate what the computer or server at the other end of that beam of light would actually see.
The primary intent of this concept was to illustrate another aspect of internet usage (I.e. messaging and emails) from a perspective transformed through the display of the data required to send messages presented in its raw form. However, upon reflection into this concept it was simply an altered version of my previous prototype .which focused on typing as opposed to video feed. As such it fell into the same trappings as the video translation during the digital prototyping stage. Where yes, people we're typing and seeing an array of 1's and 0's combined with lights flickering on and off, it did not act to communicate the energy resources into it so much as it just explained how binary works.
It was a nice idea to include interaction of having someone type in a message and know that cost something, it felt overshadowed by the insignificance of individual texts. Even after included a side statistic showing the rough energy consumption for sending messages, the incredibly small number of 0.07μW to 3.0μW of energy only acted to cement to the viewer how insignificant this energy trade off is. Making remarks like; "I didn't realize it was so small" Or, "it probably takes much more just to turn the computer on." It was clear to us that the true magnitude of the internet shouldn't be quantified on personal use basis, but instead o a worldwide level that factors in of over a billion users a any time.
0 notes
Text
Reflection 3: Prototype 1
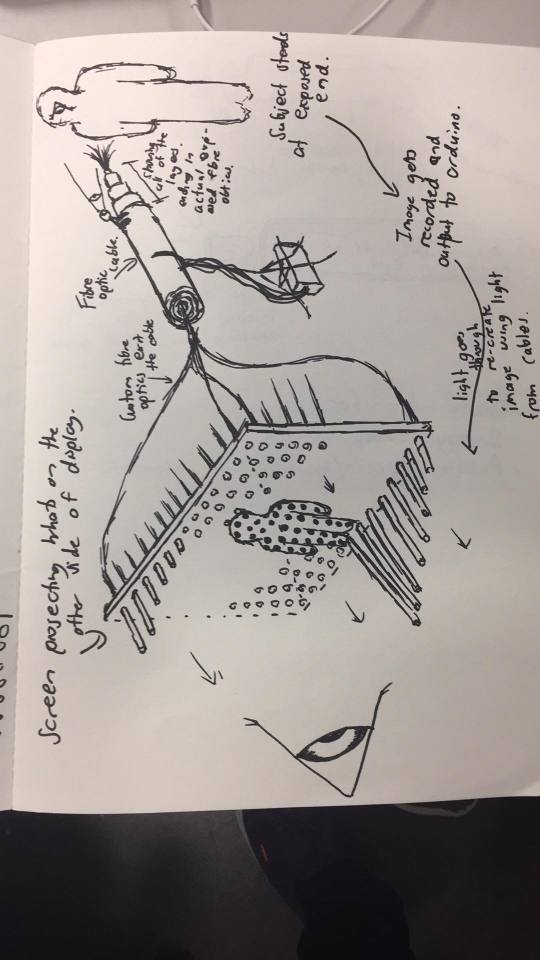
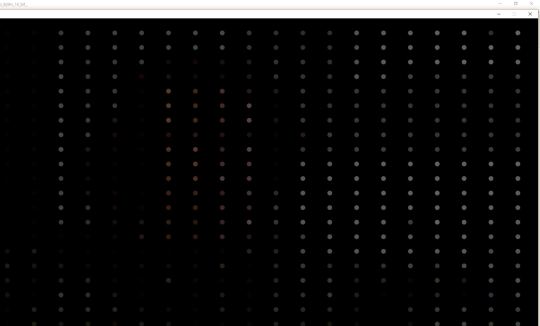
Concept one included using a web camera to project users in a stylized, low-pixel fashion by mapping Arduino and processing together. The theory behind this application was that the video live feed taken from one end at a computer or interface, would be projected through the fiber optics to reflect the image on the other side. As a concept, this was aimed at showing how actual video livestreams are sent to other people, there is no frame-by-frame image sent through cables or waves, but instead the video is broken down to pixels, placement algorithms, and color gradients. Only to then be broken down further into the most basic binary code of 1's and 0's. Translating to whether the beam of light is on or off. Through the translation of the video into pure light, we had hoped to portray the communication and translations made by all devices when using the internet.
This was later developed to be more related to internet terminology by creating the images using 1's and 0's. Showcasing a beginning in exploring how binary language could help show data transfer in a more literal fashion.
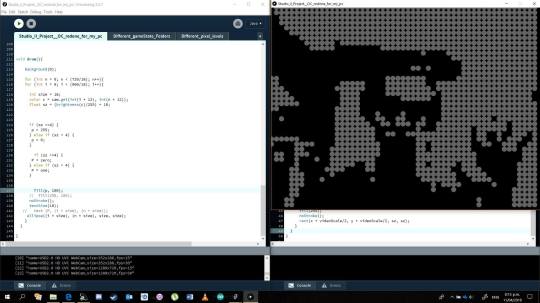
I then set about using serial communication between processing and Arduino to move pixel by pixel across the screen, calculate the brightness threshold, and output whether the corresponding LED should be on or off. Here is me setting that up with a small 8x8 grid of pixels pointed at my face, dictating whether or not the LED is on or off at any given point.
youtube
I then began to create an actual 5x5 grid of LEDs using a bunch of shift registers which was intended to read the incoming string of 1's and 0's and output accordingly. However, preliminary testing of the virtual prototype using a projector to 'mimic' the low bit resolution video that would be used proved unsuccessful as both a meaningful concept or a feasible build for the project.
Problem with build:
While I was able to have processing control a single LED, this was only replicated using the individual pins on the Arduino, giving me a maximum of 13 LEDs as I could not get the shift registers (that would allow me to use an infinite amount of LEDS) to work in tandem with the serial communication between Arduino and processing.
Problem with concept:
During our wait for the fiber-optics to arrive, as a team we had decided to use a type of digital emulation of what the final display would be to help inform rapid developments and decide whether the concept is worth pursuing further. So, adapting the previous script I had made, I modified it to showcase fine points laid out in a grid more akin to what the result would look like if used with regular fiber-optics.
Through questioning observers about what the grid of point meant to them in relation to internet data, it was obvious the decision to show a live video playback through the optics was both too vague as a point of interaction, and too specific in its scope to properly cover the interconnectedness as it is a multi-faceted medium of many uses. When we consider the network being used for messaging, video, research, gaming, sharing, encryption, email, etc. We would be doing an extreme disservice to presenting the issue if we we're to only focus on such a small aspect of data consumption, and such a weak visual too.
1 note
·
View note
Text
Reflection 2: Design and brainstorming
While at this stage of development, our focus of just the internet was admittedly far too broad of a subject to be handled appropriately within a semester worth of work. And we son came to learn of the restrictions of trying to relate any one thing to the incredibly broad statement of "internet is bad". Thus we then spent a few weeks refining this down into key concepts outlined by Andrew Blooms ted talk. Exploring; the networks of the 21st century, the materials used to maintain connection and offshore servers, and transmission/receival of data.
After breaking these concepts up into the three respective parts, we decided on working with the fiber-optics for both its aesthetic potential with light, as well as its relation to how the internet actually functions. Depending on whether or not the use of fiber-optics was feasible, I began on drafting up some quick conceptual designs based around using light and projections to map meaningful images that related to our concept of showing both the physical connection and the functionality optical cables.
During this development, I intended to specialize on prototyping what could be used to represent the internet. At the time, I was specifically invested in including some kind of interaction with the display to facilitate some kind of play. The theory at the time being that levels of interaction helped to get an observer invested in the project beyond a passing interest from passive observation. This was later reiterated in a group discussion on all of the ways this could be achieved, and what were the important factors essential to making this artifact actually work.
Upon reflection, while it was a good idea to begin planning everything out before beginning construction, I now believe it would have saved much time in developing the concept if we had questioned its relevance to the context of the intended communication. As I will get to in my next few blog posts, designing a display with the intention of communicating one thing may be clear to you, but can ultimately leave other observers confused to how it related to internet consumption. The first two prototypes fell victim to this as the concept was much more shallow in practice than we had originally anticipated.
0 notes
Text
Reflection 1: beginning of exploration.
In post of me submitting my project, these blogs are now going to be made in a sort of recap/revision of both my studio group and my personal contributions made throughout the semester.
Admittedly, the year began slow, lost in the face of a completely student work environment. Therefore, the most logical steps for starting began with a combined exploration into possible concepts we may have found interesting. Yet in spite of this, nothing of interest came of these first few weeks, instead opting to take the lecturers advice and focus our intentions towards a specific topic: The Human Anthropocene. Now I don't know why, maybe it was burn out from e-waste last year, or we grew tired of the more standard criticisms of pollution, but what became more interesting to us as a group was the lesser known, or surprising aspects of mankind's environmental impacts.
From memory, Pete's specific fact about a google search producing a quantifiable about of Co2 pollution was borderline shocking. At the time it was such a subversion of our own understanding we couldn't help but express an interest in finding out more. Finally, we turned to exploring the internet as a whole to find out what we did not know about it.
Developing on Pete's surprising fact, the more we looked into the energy required to send/receive data, the further down the rabbit hole we went. While we had originally found unacademic sources telling how much approximate energy something like an email would cost (0.074 μW for a 10KB email
~3.7 μW for a 500KB email, taken from https://www.quora.com/How-much-energy-is-spent-sending-an-email) this did help in broadening our scope to acknowledge the sheer size and near incomprehensible amount of resources used to maintain the 'traffic' of what was essentially a light flickering on and off while bouncing around the globe several times a second. Maintained through a vast network of servers and cables. A unprecedented new meaning to "the world wide web."

While the world internet has always been derived from its beginnings as a inter-netting of cables and wires sending data between army offices, I believe its original context has been further diminished with the more universal internet has become Where wireless connections and unlimited data caps has allowed the internet to appear as a force beyond physical limitations when the internet will always be bound such things. Your fiend does not see a message from satellite or magical waves, instead through a physical connection spanning across countries and oceans o connect the two of you. A very interesting journey of discovery shared by Andrew Bloom during his ted talk on the physical connection of "the amorphic blob that is the internet.
youtube
0 notes
Text
Brief reflectionon Studio Project:
After a semester project, Studio II has taught me significant aspects of both having a team dynamic and vision to fulfil an idea. With that statement comes many more in the subtext about the learning while taking part in such an ambitious and large-scale project in the largest group I have been in so far this year. With that came a whole range of issues and complications when dealing with both my personal and group time management. Something I believe worked against us in the latter stages of development. Especially in the little room left over for massive iteration on the idea once we had reached the construction of it. As such, I found the latter part of its development to be driven by a need to accommodate these problems. The major example of this for me being the compromise with the webcams. Abandoning the idea that involved both being functional so our final artefact has some relevance to what we hoped to communicate.
Despite our attempts to make informed decisions through user testing, I do not believe our current state communicates the ideas we want it to. With much of my own user testing being extremely biased and for a long time, was primarily focused in feedback in the U.I, or the questions. Never what the activity says to a bystander that has no part f this project.
Because of this, my final disappointment in the artefact does not stem from the actual construction. Completing the individual components and aspects of this project has been a monumental effort from everyone involved. From the coding, all the setbacks, construction, integration between Arduinos, problems with video feed, serial communication, and interactivity; completion of the artefact is something we doubted would be complete hald way through this. So, in a very basic term, I believe we had succeeded in developing skills through this project. My personal learning in Processing, Arduino, and having more experience as a team. Yet despite this, the artefact becomes very surface level not in its complexity, but what it tries to communicate [highlighting the distractions of modern communication channels] and how well it succeeds in communicating this. While the artefact is made up of many layers, it does not leave an impression on participants on the difficulties of modern communication like we had originally envisioned.
0 notes
Text
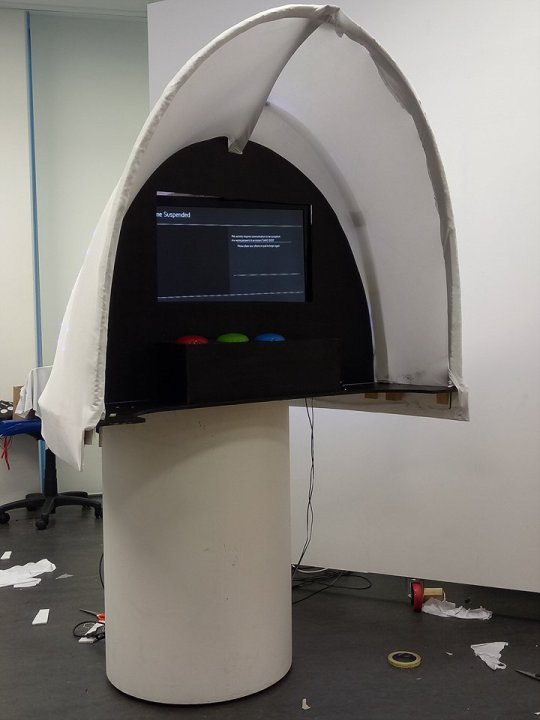
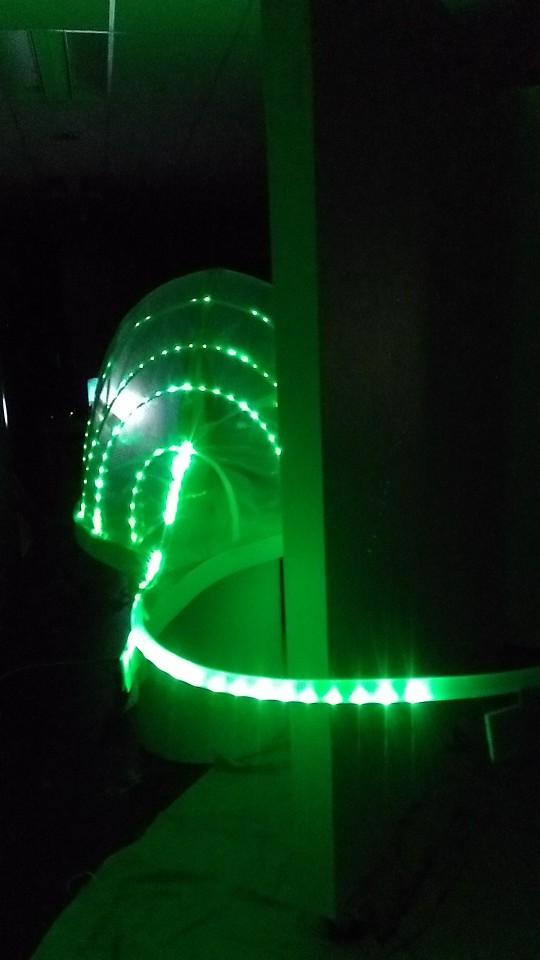
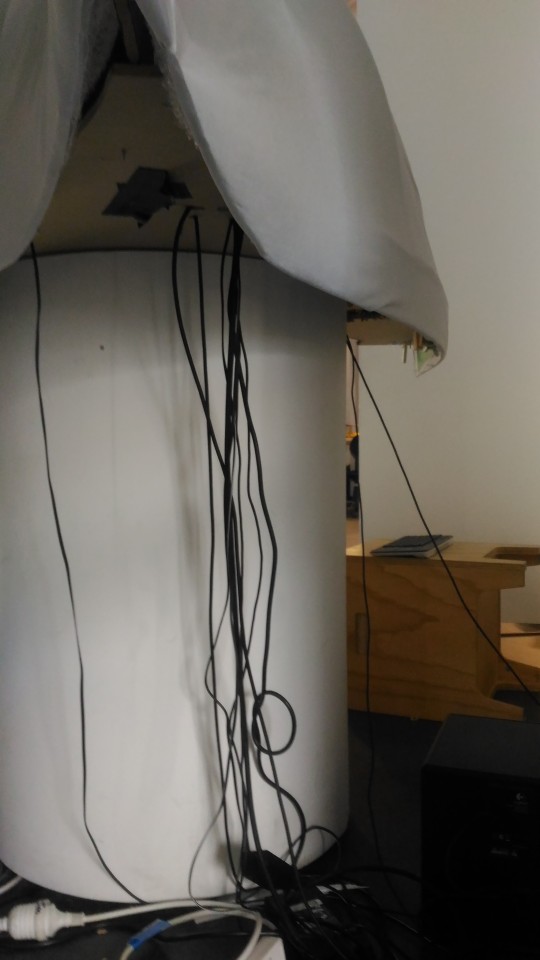
Reflect on consruction:
For this very large aspect of our final hand-in, my personal role in this was general assistance wherever I was needed in the construction, sometimes moving away from programming to assist in jobs, gathering materials, helping with gluing the frame, or general management of the team in the last few weeks. But in no way, was I solely responsible for, nor solely focused on, the actual construction. Where such a job was largely created by the joint effort of everyone in the group. With the lead in the construction being Daniel in general creation and overseer of the design and construction. And Samy when it came to management of the overarching cloth and laying on the LED strips. Daniel was then heavily invested in the button interface which he had done by deconstructing two keyboards and circuit bending the chip to output keys directly into the computer rather than running through the Arduino. Something almost essential as the Arduino was unable to output more stringln that what was currently being used to detect the placement of the phones on the pad.
I’m not sure what else to say about the construction other than I am glad we finally managed to get it finished. In terms of fulfilling what we set out to do, I believe he have done exactly that. The project was extremely ambitious in the general time it took and the number of smaller components inside to make it work.
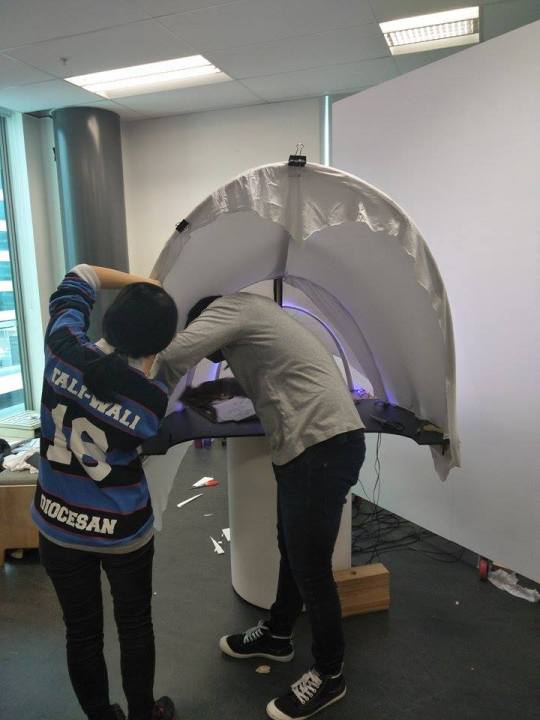
Despite the worst setback being on Sunday morning with one of our tent poles breaking, we still managed to push through and finish the project.
I’m not even going to talk about what could have been done better because the actual construction was so ambitious I’m not worried about the smaller things. Could it have taken less time so we could work on the academic idea for longer? Absolutely. But despite this, it remains to me, a shining example of so many components and inner workings of wires, code, and construction to come together so cleanly, and remains something I am most proud of (other than the code of course);
0 notes
Text
Final Processing Sketch
After all that work in creating the processing file, I was finally able to put the completed touches on the UI and gameStates. Fortunately, this was about the time that daniel was able to finish his push buttons so it was a very simple matter of remapping the correct keys to enter the new gamestates. Remapping:
A -> H & M.
B -> B & T.
C -> V & X.
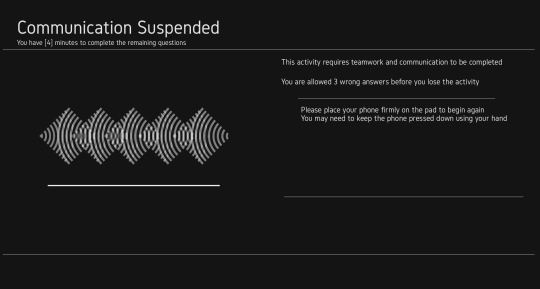
I had also made the decision to impement variable that count up whenever a wrong answer is given and displaying the notification at the top of the screen. The player also now loses once it reaches 3 wrong asnwers as opposed to exiting immediately after 1.
A few other additions being the new timer, which is now represented by a rectangle at the bottom of the screen that decreases in size with the less time remaining.
There is also a prompt that opens when only one person has their phone on the pad. This was done with the intention of being more forgiving in case someone merely slips and now has to start all over again.
If the gamer is in the menu, pressing one down will “attempt to call” other player. if it is in the middle of the game then it merely displays a warning that one phone has been lifted.
Finally, I had made the decision to replace any camera feed displaying when either in the win, loss, or menu state, it would be better to display a simple .jpg. This was done after a complain when someone would win or lose in a COLLABORATIVE game, yet only one player was unfrozen as if for some reward.
This is the final UI design of the game menu:
The text that is read for both the game over and game win screens we’re collaboratively written between me and Talia.
PRESS ‘READ MORE” to see the rest of my UI designs. There like 10 images so I didn’t want to destroy peoples tumblr feeds:
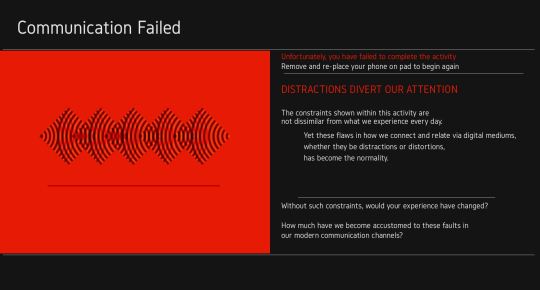
Game over State
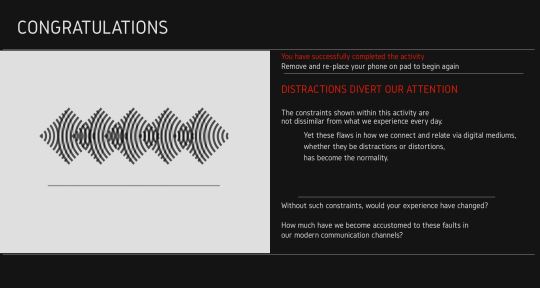
Game won State
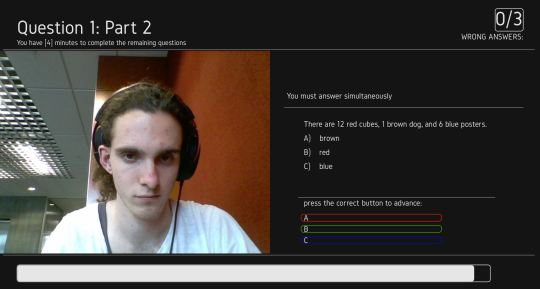
Question 1: part 2
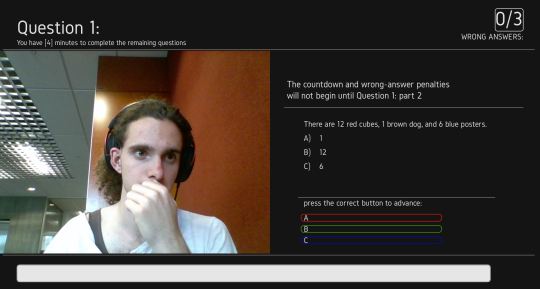
Question 1:
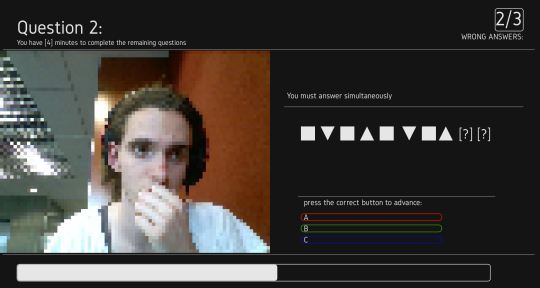
Question 2 (you can see the gradual pixelation);
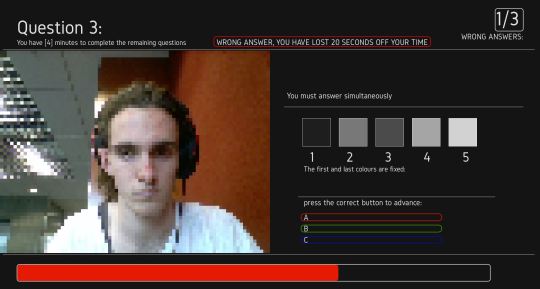
Question 3, but with a wrong anwer entered:
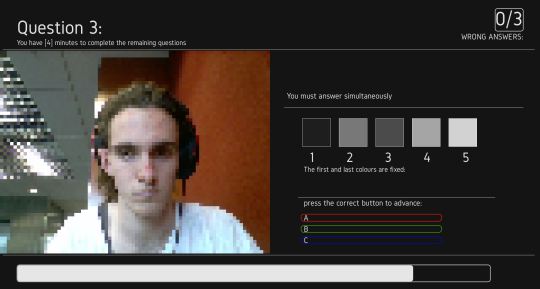
Regular question 3
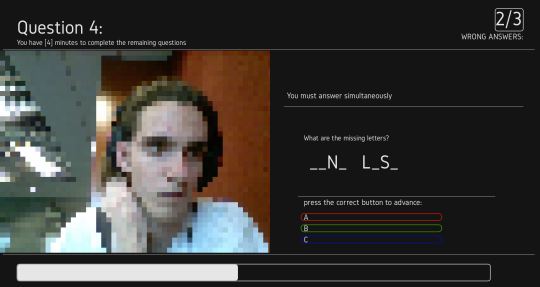
Question 4
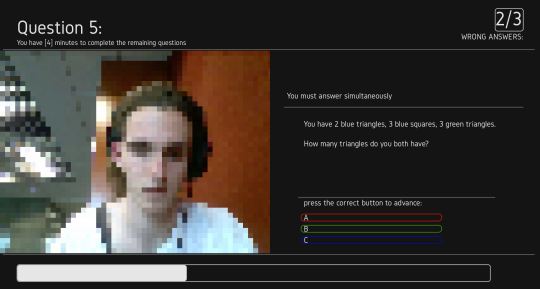
question 5
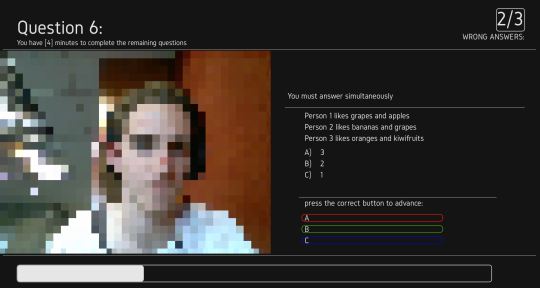
Question 6
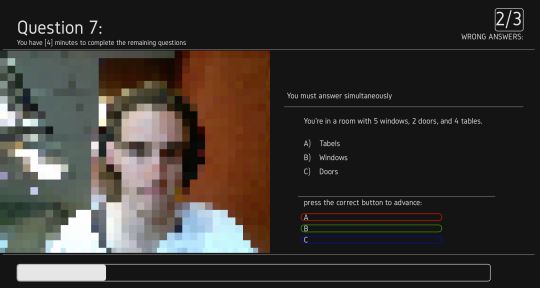
Then question 7:
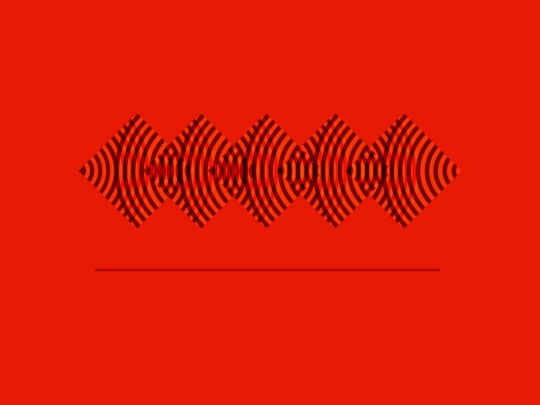
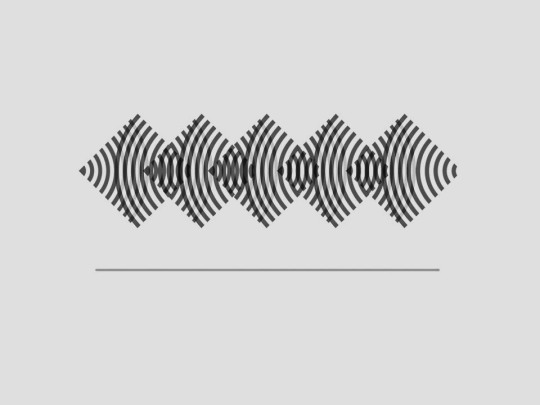
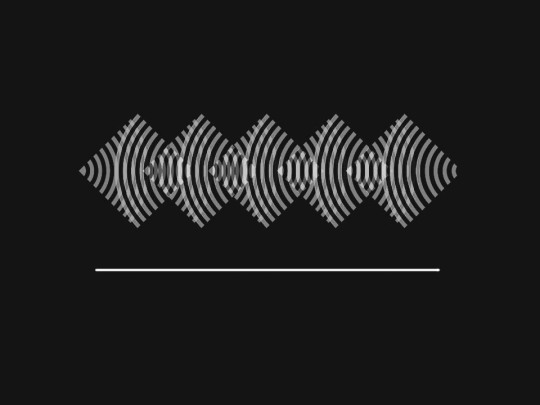
Also, here the straight .jpg images used in the titlecards: The pattern is some simple design by sheena while trying out designs that I had repureposed to a simple blank design.
0 notes
Text
The physical computing side of this project:
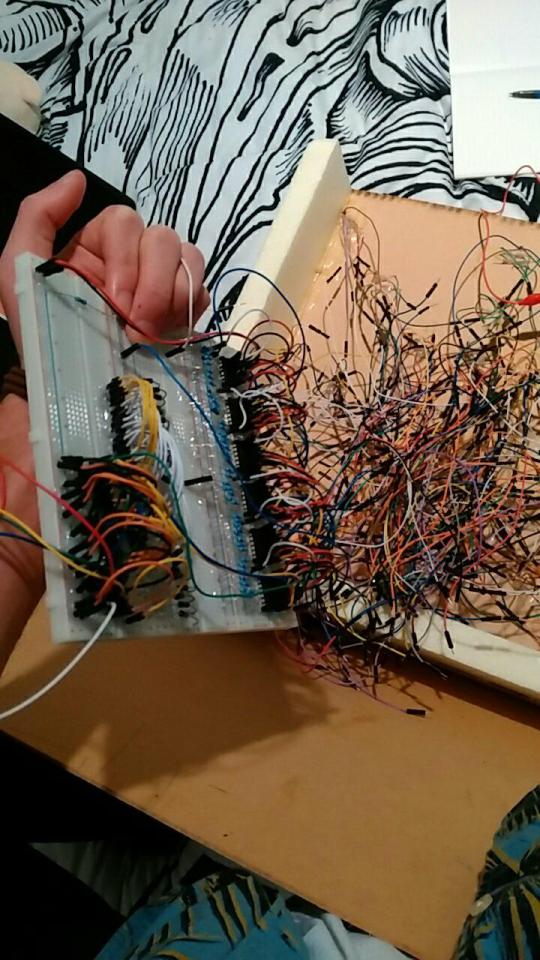
In the cases of Arduino and processing, much of our original Arduino code had been done collaboratively, where Talia would build the basic setup for the functionality of the push buttons, LEDs for both the notification and the LED strips, and the motors. The circuitry itself was also aided by Samy in many aspects involving transistors like the ones used in the LED Strips and vibration motors to emulate a phone vibration.
I would then be tasked with organising the codes integration with processing (which I had primarily worked on). Mostly working collaboratively with Talia in the serial communication between devices. We also had a problem when it came to the fade ins and fade outs for the LEDs that Samy could solder. As the fade in and fade out required PWM pins, and one Arduino was already currently using two; we did the only sane thing you could do and wired up a second Arduino instead. The code itself for the fading was relatively simple. Merely using a for{} loop to cycle up and down the intensity of the LEDs. The problems came when we really wanted the speed and number of LEDs to be increasing or decreasing depending on how through the game you currently were. In theory, this could be achieved by connecting the Arduino and simply transmitting an byte whose value is dependent on the gameState. Where the value would then work to change the speed/number of LED/s currently flashing or not.
The problem was that we were currently using the other Arduino for communication of whether the button is pressed or when to turn on the motors. And writing to two at once does not work because processing is unable to distinguish what bytes to send where.
Instead, we tried printing al bytes to one Arduino, then have it slave write to the one controlling the LEDs. Unfortunately, despite my best efforts in trying to get it to work. I was unable. So, in defeat, I hung my head and went along with simply having the fading LED states be constant and unchanging.
0 notes
Text
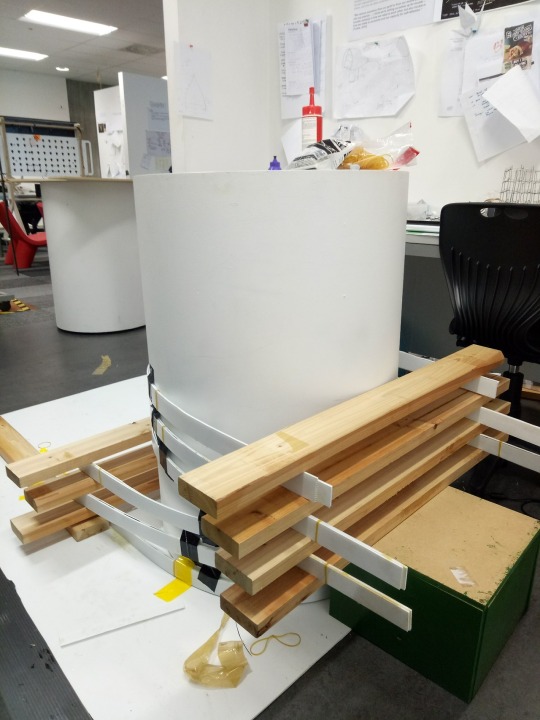
Week of reflections and iterations:
This post acts as a reflection of the past week of general play testing and bug fixing after getting the skeleton made of corflu strips which me and Talia had glued together earlier in the week.
So, first things first, I believe it is time to admit that our current concept as it stands isn’t really going to work. By this I mean our entire project being hinged on getting people to lift the phone from the sensor pad. Which has two main problems with it. The first being that our entire message is hinged on whether the participant even lifts the phone. As of right now there is nothing to connect this to the use of cell phones outside of placing the pad down with it. The second reason this wouldn’t work because people are simply too courteous to check their phone if they are fooled by our fake notifications because we will be expressly telling them to keep their phone down.
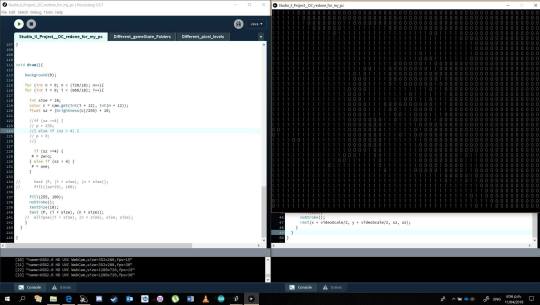
Because of this, I had suggested to the team that we change direction slightly once more; moving the emphasis of the display to be all about how many layers of digital distortion and distractions we can use in this program to throw them off their game. Presenting the argument of how phone can be a distraction by actually distracting the players rather than draw their attention to their phone until they figure out our gimmick. As such, I decreased the delay between the random notification outputs, and increased the frequency notification by running after every transition to a new gameState.
Another alteration came from me trying to think of ways to add to this distortion. Where I came to the decision to now reverse the current order of pixelization in the camera feed to go from clear to pixelated as opposed from pixel to clear. I chose to do this because our current system acted a reward for doing well. The screen gets clearer and communication becomes easier. The original intention of this was for it to be a metaphor for the participants communication getting better as they ignored the fake communications. Now however, the gradually increasing levels of pixilation act to further distort between the two characters as the game progresses. Now becoming a kind of metaphor for the intrusive nature of our devices to make general discussions and dialog more difficult.
This final change did not actually come about intentionally, instead, this form of distortion is the result in a bug in processing. Where basically, processing un unable to ��process’ two video camera feeds from the usbA inputs at the same time. I had spent two days experimenting with different library folders to no luck at all. So as a compromise to not have half a display broken, I am able to run both if I alternate between the two cameras with each question. While this was originally a very frustrating compromise to what had been working earlier, it does however, now act as one more layer of distortion to be added in this processing sketch.
While it isn’t quite operating the way I had intended for it to, it does ultimately work in our favour with our new focus on distorting this activity to convey our message.
0 notes
Text
Prototype display and plan code:
Another update on the general design. Which had been drafted out and 3d modelled by Daniel.
The idea behind it being to represent two individual booths with obvious connects between them to join. For this connection, we had decided to Have a wave LED travel through the cones from one side to each other. While the original intent was to have these LEDs triggered whenever audio would reach over a certain limit (Making use of my previous Processing sketch when visualising soundwaves). However, unfortunately in practice, such a thing would not be possible as it would be far too inconsistent to properly map or trigger. Instead, what would be far easier to do is have the rate of change scale up or depending on what question the person is on. This being a lot easier as we already have the code integrated for the button pressing and false notifications thanks to Talia previously helping with the Processing to Arduino communication.

While I worked on the Processing and Arduino Sketches, my team also set about doing a quick prototype for what the display would eventually come to look like.

The design of the LEDs is currently intended to the connection between the two parties and provide visuals for by-standers. -The idea of creating something for other people to look at while they wait as the game only facilitates two people at a time was brought up by Ricardo in a daily meeting.
0 notes