#i still love that impulse accidentally killed scott and became yellow again
Photo
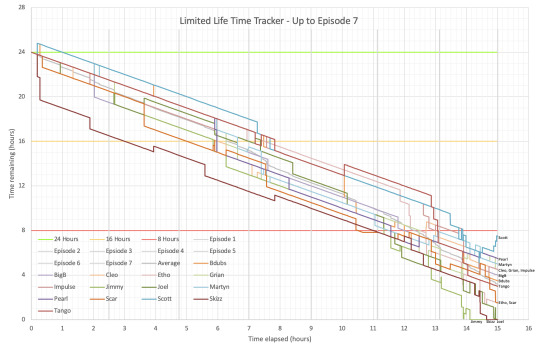
Life Tracker updated for Episode 7! This one is much quicker than Episode 6 on account of not being on holiday at the time, even though there were two thirds more deaths this time. Previous posts: Session 6, Session 5, Session 4. Also Session 8 (finale) post!
As usual, close ups and commentary below the cut. I’ve also added another graph for the average time of each team, which will also be below the cut.
There was so much carnage! 45 whole deaths in a single session! Not all deaths were awarded time during the session, but Scott’s video advised that it would be added by next session, so I have taken the liberty to add all the time as I see fit, hence why Scott is back to 7.5 hours. I haven’t seen every episode yet (in fact, other than Scott, I’ve only seen those that have perma-died), so I’m not sure if anyone else’s time is a mismatch, but if so I’m happy to explain where I’m getting my time additions and subtractions from!
Now for some close ups.
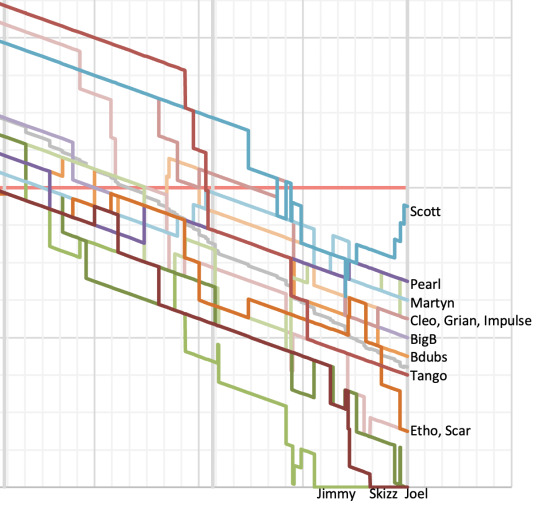
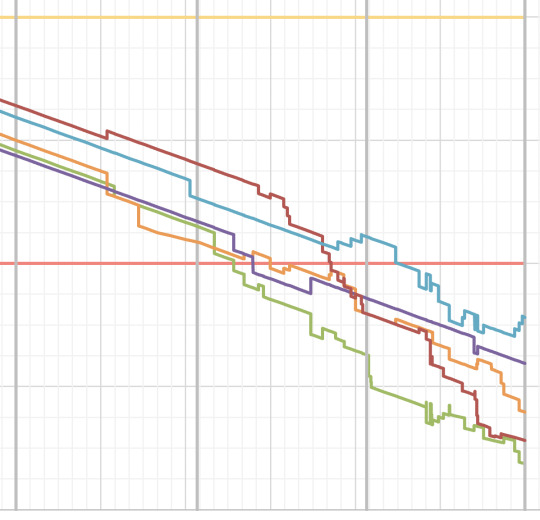
First, there was enough chaos that I decided to take a close up of Session 6 and 7 together so we can properly appreciate it:
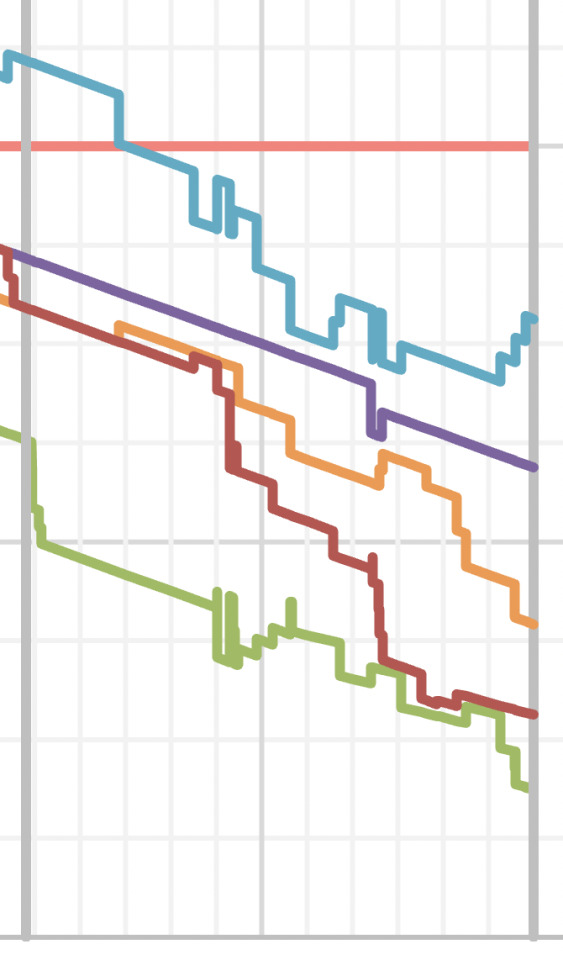
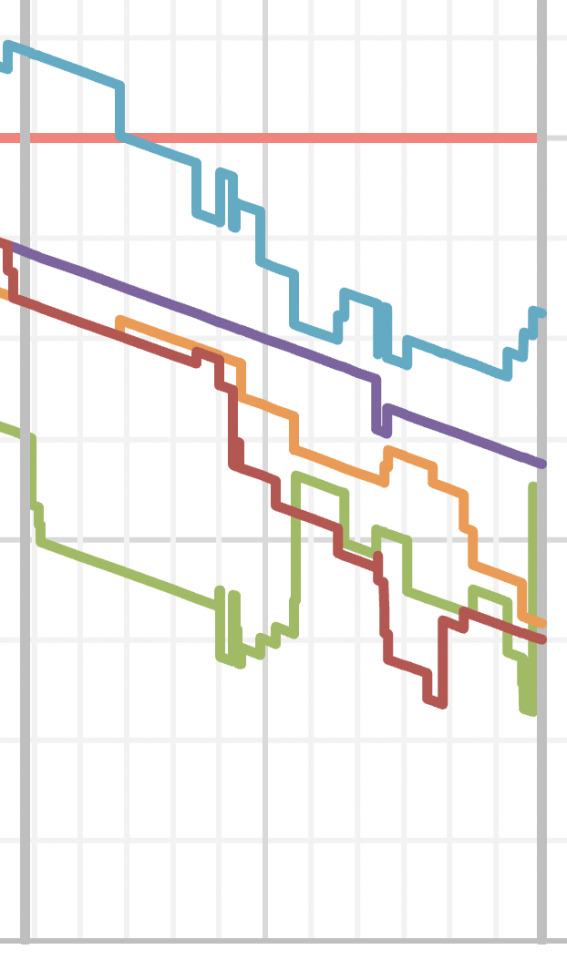
And a close up of Session 7 by itself:
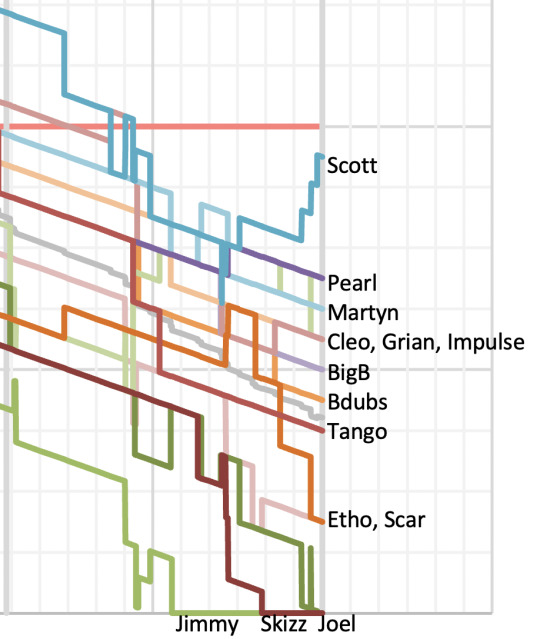
So many people lost major time, so it’s interesting to see Scott’s uptick of time at the end - he ended on only 30 minutes less than he would have been if he hadn’t died at all this session. Pearl didn’t die at all, and got the kill credit for Martyn blowing himself up in a trap, so she actually ended the session 30 minutes better than she started it. Grian also did very well for himself - he killed and died so many times, but somehow ended on the exact time he would have been on if he had experienced a peaceful deathless session.
BigB, Cleo, and Martyn all ended the session 1 hour poorer than they started, and Bdubs and Scar ended 1.5 hours below where they would have been. Nosy Neighbours are thus doing super well, with Mean Gills and Clockers not too far behind, in terms of maintaining position from the start of the session.
TIES had an awful time this session, with Impulse and Tango both losing a net 2 hours, and Etho and Skizz losing a net 2.5 hours - and obviously Skizz entirely died.
Joel possibly had the worst time, losing a net 3.5 hours this session - though it didn’t help that 5 of his 7 deaths were all caused by the one person. Technically Jimmy didn’t do too badly, given he only lost a net 1.5 hours... but given that he was out of the series only an hour into the session, and also the first out entirely... it really didn’t go well for him either
I also find it interesting the sheer number of vertical lines this graph, the ones representing a death immediately followed by a kill or vice versa. I would love to figure out a way to show only one line at a time on the graph, so we can more easily see someone’s journey, but I haven’t had time to look into it yet.
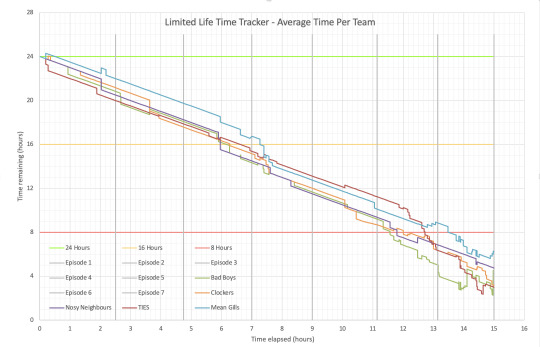
Now onto the graph of the average times per team.
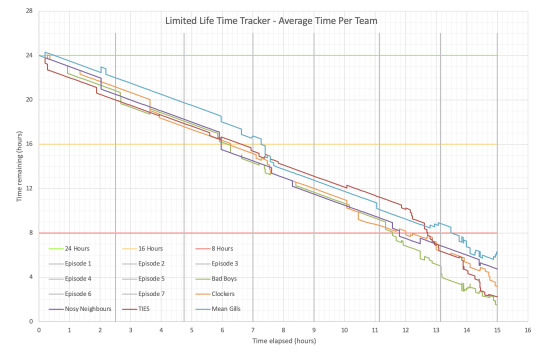
This one is super interesting to me, especially TIES’s line - they had the lowest average life right from the start, but somehow by Session 4, through Session 5, and for most of Session 6, they were the team with the highest average time, and then it quite literally went downhill from there. The only thing saving them from being last now is the fact that the Bad Boys are down to only a single living player, and even then Grian is doing far better than most of TIES.
It’s also interesting to me how Mean Gills had a significant time uptick at the end of both Session 6 and Session 7 (the first due to Martyn and the second due to Scott). Scott’s time was so high that it kept Mean Gills’ average time as yellow for all of Session 6 despite Martyn being red for most of it... and Martyn then got enough kills to keep it there. Mean Gills is also the only team in the entire graph to anywhere gain such consistent significant time.
These averages also coincide with the comments I made above about the time offset difference for each player from the start to end of the session. Mean Gills are doing well, but they’ve been doing well for so long that I’m sure most players are aware that they need to be a target. Nosy Neighbours are also doing well but I feel like they’ve flown under the radar, and are not a significant target right now.
Here is a close up of this graph with Sessions 1-4:

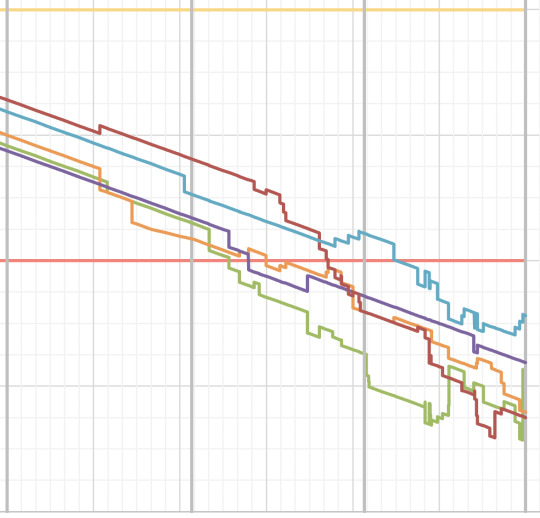
And the close up for Session 5-7:
And the Session 7 only close up:
I kept the dead players in the teams’ averages, since I think it is a better reflection of the teams’ strength as a whole, but I also created a version that excluded dead players. In those screenshots you can really see Bad Boys’ and TIES’ time jumping up at a death, instead of falling as it did here.
Here are the alternate averages graph:
And close ups:
This makes Bad Boys look a lot better, because Grian does have a lot of time... but he is also alone. And there is definitely strength in numbers. Two players at an hour and a half each can fend off an attacker more easily than a single player at three hours can... unless nerves and panic get to them, as we definitely saw this session.
Wow and I almost forgot to include the raw data for this session!
The first hour of the session:
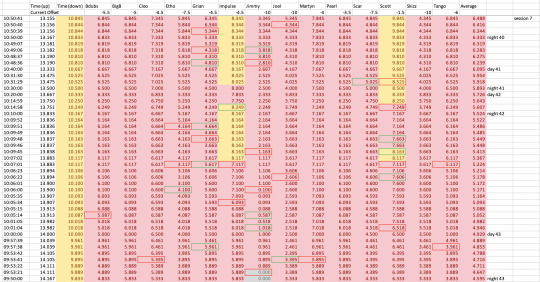
The second hour of the session:

There is just so much death! Look at all the box outlines!! I could barely fit this data on two screens on the zoom I was on, and I did not want to zoom out further.
I also obviously have data for the averages, but it was too far away from the column with the times on it that I wasn’t sure if it would still be useful on its own? Let me know if you want to see it!
This has once again been fascinating to see, and I cannot wait to see how Session 8 will go. Will it be the last session? Will they go until everyone is dead? Will they somehow have enough people with enough time to get to Session 9? Will Mean Gills be the final two and get to play fun relaxing games like Scott was suggesting?
Only time will tell.
#limited life smp#24lsmp#limlife#once again i hate trying to work out what tags for a post#i got to this point in the tags before i realised i forgot to add the number data#i still love that impulse accidentally killed scott and became yellow again#and that scott also became yellow again#so there was less than 14 minutes between there still being two yellows on the server... and jimmy permadying#thirteen minutes and 41 seconds exactly by my calculations#which is crazy given we had whole sessions of yellows only#which meant it was hours between last green and first red#so less than a quarter of an hour between last yellows (and two of them!) and first permadeath is crazy#i always ramble in the tags bc i dont know how to wrap the post up#why do i always post these as im going to bed#its after midnight and im yawning now#anyway enjoy!#very glad i got to post this before the weekend ended this time#well it was still sunday when i started writing the post#its 12:15am on monday now. technically#my spreadsheets
280 notes
·
View notes
Last Seen Blogs

bzedan
From the Observatory


richtearex
Rich T(ea)-Rex

lalafell-princess
* Brave Little Spark *

la-j-suprema
La J Suprema