#eBPF
Text
If you are a performance engineer/network engineer or even security engineer, the chance of you encountering eBPF technology in the future is very high.
0 notes
Text
Go eBPF Unleashed: Amplifying Your Control Over Linux Kernel
Introduction
In the dynamic landscape of software development, three key concerns reign supreme: performance optimization, in-depth system observation, and fortifying security. In the realm of Extended Berkeley Packet Filters (eBPF), Go is emerging as a powerhouse language, transforming how we analyze and manipulate network traffic, system calls, and other facets of application performance. Today, we embark on an exhilarating journey into the universe of Go eBPF, uncovering its vast potential and myriad applications.
Demystifying eBPF
eBPF, short for Extended Berkeley Packet Filter, is a virtual machine residing within the Linux kernel. This ingenious creation allows you to securely run custom programs within a confined, safeguarded environment. These eBPF programs can be attached to various hooks within the kernel, opening the gateway to powerful and efficient monitoring, analysis, and manipulation of critical events such as system calls, network packet handling, and beyond.
What makes eBPF particularly captivating is its ability to extend the capabilities of the Linux kernel without the need to write and load complex kernel modules, which can be cumbersome and error-prone. eBPF programs are penned in a restricted subset of C and are executed within the kernel's own virtual machine, offering a marriage of safety and efficiency that is crucial for low-level operations.
Go and eBPF: A Match Made in Developer Heaven
Go, colloquially referred to as Golang, is a statically typed, compiled language renowned for its elegance, efficiency, and rock-solid support for concurrency. The burgeoning synergy between Go and eBPF has not gone unnoticed. Here's why Go makes a compelling choice for eBPF development:
Safety First: Go is a memory-safe language, effectively guarding against common memory-related pitfalls that can otherwise lead to security vulnerabilities. This safety is an absolute necessity when writing code that operates within the kernel, where even minor mistakes can have catastrophic consequences.
Performance Par Excellence: Go's performance is right up there with languages like C and C++, making it an ideal candidate for crafting eBPF programs that need to execute swiftly and with the utmost efficiency.
Robust Ecosystem: The Go ecosystem is vast and vibrant, featuring an array of libraries that cater to network programming, an invaluable resource for those venturing into eBPF applications.
Developer-Friendly: Go's hallmark simplicity and readability mean that it's accessible to a broad spectrum of developers, including those who may not have extensive experience in systems programming.
Crafting Go eBPF Programs
To venture into the domain of Go eBPF, you'll need a few fundamental tools and components:
A Go Environment: Ensure that you have Go installed on your development machine.
The Power of libbpf: libbpf is a library that streamlines the interaction between Go and eBPF programs. It provides an array of helper functions and abstractions that simplify working with eBPF in Go. You can find libbpf on GitHub and install it to bolster your projects.
BPF Toolchain: This includes tools like Clang and LLVM, essential for compiling eBPF programs written in Go.
The Go eBPF Library: This gem of a library offers Go bindings for libbpf and facilitates the development of eBPF programs in Go.
Applications Galore
Now that you're all set up with Go and the necessary tools, let's delve into the captivating array of applications that Go eBPF opens up:
Network Wizardry: Go eBPF programs can capture and dissect network traffic like never before. This superpower is a game-changer for diagnosing network performance bottlenecks, conducting robust security monitoring, and performing deep packet analysis.
Guardian of Security: With Go eBPF, you can craft robust intrusion detection systems capable of real-time monitoring of system calls and network events, alerting you to potential threats and allowing you to take immediate action.
Profiling and Tracing Mastery: When it comes to profiling and tracing applications to pinpoint performance bottlenecks and optimize execution, Go eBPF shines like a beacon. It offers an insightful window into code execution, revealing avenues for significant performance enhancements.
System Call Firewall: By attaching eBPF programs to system call hooks, you can enforce security policies, control the behavior of specific processes, and fortify your system against malicious activities.
Conclusion
Go eBPF is more than just an innovative intersection of two powerful technologies. It is the gateway to secure, efficient, and developer-friendly expansion of Linux kernel capabilities. With its safety features, competitive performance, and extensive ecosystem, Go has rightfully earned its spot as a premier choice for crafting eBPF programs. As the eBPF ecosystem continues to evolve, Go eBPF is poised to play a pivotal role in redefining the future of system monitoring, security, and performance optimization in the dynamic world of software development. If you're passionate about maximizing performance, enhancing observability, and safeguarding systems, it's high time you embark on the mesmerizing journey into the world of Go eBPF and uncover its boundless potential.
0 notes
Text
Empowering Keployment with Go eBPF: The Ultimate Guide

Introduction
In today's fast-paced world of IT and cloud computing, deploying and managing applications is a crucial task. The ability to adapt to changing conditions and ensure top-notch performance and security is vital. Enter eBPF (extended Berkeley Packet Filter), a groundbreaking technology that, when paired with the Go programming language, opens up new frontiers for your deployment needs. In this article, we'll delve into the world of Go eBPF and explore how it can help you "keploy" your applications with unmatched confidence. We'll also provide practical examples of Go eBPF code to demonstrate its capabilities.
Understanding eBPF
eBPF, originally designed for packet filtering, has grown into a versatile framework that allows you to extend and customize the Linux kernel in unprecedented ways. It enables the attachment of small programs to various hooks within the kernel, enabling real-time inspection, modification, and filtering of network packets, system calls, and more. eBPF's flexibility has resulted in a wide range of applications, including monitoring, security, networking, and performance optimization.
The Power of Go
Go, often referred to as Golang, is a statically typed, compiled language developed by Google. Renowned for its simplicity, efficiency, and comprehensive standard library, Go is a popular choice for building scalable, high-performance applications. Its support for concurrent programming, combined with a strong focus on simplicity and efficiency, makes it an excellent language for developing networking tools and applications.
Go eBPF: A Potent Alliance
The synergy between Go and eBPF is a game-changer for creating, deploying, and managing applications. Here's how Go eBPF can revolutionize your deployment process:
Enhanced Performance: Go's efficiency and concurrent programming capabilities make it ideal for managing eBPF programs that analyze, optimize, and filter data in real-time. This ensures that your applications run smoothly and efficiently.
Security and Monitoring: eBPF offers powerful tools for network and system monitoring, and Go can be used to build user-friendly interfaces for visualizing the collected data. This is crucial for maintaining a secure and compliant deployment environment.
Real-time Responsiveness: eBPF enables real-time responses to network events and system issues. Go's speed and simplicity allow developers to build and deploy solutions that react to changing conditions, guaranteeing high availability and performance.
Cross-Platform Compatibility: Go's ability to compile code for multiple platforms and eBPF's integration with the Linux kernel make it possible to create cross-platform networking solutions that can be keployed across various cloud providers.
Keployment with Confidence
As a developer or system administrator, the concept of "keployment" encapsulates the idea of continuously deploying, managing, and optimizing your applications. Here's how Go eBPF empowers you to keploy your applications with confidence:
Dynamic Load Balancing: With Go eBPF, you can implement dynamic load balancing strategies that distribute incoming traffic evenly across multiple servers. This ensures high availability and optimal performance, while the dynamic nature allows you to adapt to changing traffic patterns.
Auto-Scaling: Go eBPF helps you build auto-scaling solutions that automatically adjust the number of server instances based on real-time demand. This means your deployment can handle fluctuations in user activity without manual intervention.
Distributed Monitoring: eBPF, when paired with Go, allows you to create distributed monitoring solutions that provide real-time insights into your infrastructure's health. Detect anomalies and address issues before they impact your users.
Security and Compliance: eBPF's capabilities for inspecting and filtering network traffic and system calls, along with Go's flexibility, enable you to build custom security monitoring and compliance tools. These tools help you ensure your application's security and adherence to regulatory requirements.
Customization: The flexibility of Go and eBPF empowers you to tailor your deployment to your specific needs. You can create custom modules and extensions that address the unique challenges of your application.
Practical Examples of Go eBPF
Let's dive into some practical examples of how Go eBPF can be applied to enhance your deployment strategy:
Dynamic Load Balancing:
package main
import "fmt"
func main() {
// Go eBPF code to implement dynamic load balancing
fmt.Println("Dynamic Load Balancing code goes here.")
}
Auto-Scaling:
package main
import "fmt"
func main() {
// Go eBPF code for auto-scaling
fmt.Println("Auto-Scaling code goes here.")
}
Distributed Monitoring:
package main
import "fmt"
func main() {
// Go eBPF code for distributed monitoring
fmt.Println("Distributed Monitoring code goes here.")
}
Security and Compliance:
package main
import "fmt"
func main() {
// Go eBPF code for security and compliance
fmt.Println("Security and Compliance code goes here.")
}
Custom Modules:
package main
import "fmt"
func main() {
// Go eBPF code for creating custom modules
fmt.Println("Custom Modules code goes here.")
}
These code snippets serve as a starting point for implementing Go eBPF in your deployment strategy. You can tailor and expand these examples to meet the specific needs of your application.
Conclusion
In the rapidly evolving world of application deployment, Go eBPF emerges as a game-changer. It empowers developers and system administrators to "keploy" applications with confidence, leveraging dynamic load balancing, auto-scaling, distributed monitoring, security, and customization. The practical examples provided here demonstrate the power and flexibility of Go eBPF, offering a glimpse into the possibilities it unlocks for your deployment needs. As you continue to evolve your application infrastructure, consider the advantages of Go eBPF for seamless, efficient, and secure keployment.
0 notes
Text
Native Spectre v2 Exploit (CVE-2024-2201) Found Targeting Linux Kernel on Intel Systems

Cybersecurity researchers have unveiled what they claim to be the "first native Spectre v2 exploit" against the Linux kernel on Intel systems, potentially enabling the leakage of sensitive data from memory.
The exploit, dubbed Native Branch History Injection (BHI), can be used to extract arbitrary kernel memory at a rate of 3.5 kB/sec by circumventing existing Spectre v2/BHI mitigations, according to researchers from the Systems and Network Security Group (VUSec) at Vrije Universiteit Amsterdam.
The vulnerability tracked as CVE-2024-2201, was first disclosed by VUSec in March 2022, describing a technique that can bypass Spectre v2 protections in modern processors from Intel, AMD, and Arm.
https://www.youtube.com/watch?v=24HcE1rDMdo
While the attack leveraged extended Berkeley Packet Filters (eBPFs), Intel's recommendations to address the issue included disabling Linux's unprivileged eBPFs. However, the new Native BHI exploit neutralizes this countermeasure by demonstrating that BHI is possible without eBPF, affecting all Intel systems susceptible to the vulnerability.
The CERT Coordination Center (CERT/CC) warned that existing mitigation techniques, such as disabling privileged eBPF and enabling (Fine)IBT, are insufficient in stopping BHI exploitation against the kernel/hypervisor. "An unauthenticated attacker can exploit this vulnerability to leak privileged memory from the CPU by speculatively jumping to a chosen gadget," the advisory stated.
The disclosure comes weeks after researchers detailed GhostRace (CVE-2024-2193), a variant of Spectre v1 that combines speculative execution and race conditions to leak data from contemporary CPU architectures. It also follows new research from ETH Zurich that unveiled a family of attacks, dubbed Ahoi Attacks, that could compromise hardware-based trusted execution environments (TEEs) and break confidential virtual machines (CVMs) like AMD Secure Encrypted Virtualization-Secure Nested Paging (SEV-SNP) and Intel Trust Domain Extensions (TDX).
In response to the Ahoi Attacks findings, AMD acknowledged the vulnerability is rooted in the Linux kernel implementation of SEV-SNP and stated that fixes addressing some of the issues have been upstreamed to the main Linux kernel.
Read the full article
2 notes
·
View notes
Text
I had the idea to set up a tally light for my screen recorder, I was about to do it with external hardware when I remembered that for some bizzare reason the back of my motherboard has like four RGB LED's, and that's the side that faces me. It's supported in OpenRGB, so a moment of scripting and systemd timers later and it automatically flips to red when my screen recorder is on, and back to orange when it's off.
It not perfect system. I'm sure there's a better way to watch for the recorder process starting than just having a systemd timer run a script every couple seconds. There's probably some kind of internal notification i could hook into. eBPF probably has a solution to this. I don't know how to write eBPF. This is relevant to my dayjob too so I should probably learn eBPF.
Probably the correct-correct thing would be to have a service get inotified on a pidfile for the recorder. I don't know if it has a pidfile but I could patch it in easily. Or maybe watch /proc? Never thought about this before. If I'm patching the recorder I could just make it run openrgb but then if it crashes it might not flip back. I'd have to put actual work into teardown.
The developer does actually recommend setting the recorder up as a systemd service so I mean there's that option too, you can just get systemd to handle it then.
Systemd does some fuzzy matching with timers to try and batch executions together to reduce power consumption. It's quite a long period by default so the timer was taking forever to go off. You have to override it with AccuracySec=X in the timer to force it to execute within X seconds of the intended time. This is a desktop so the extra power is probably less than changing the brightness on my display.
Things like this also make me want to start using execline. sh is so much.
4 notes
·
View notes
Text
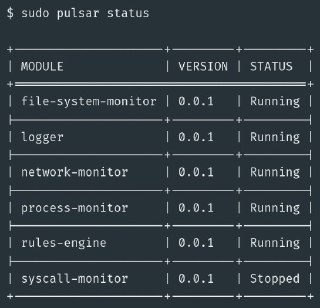
[Media] Pulsar
Pulsar
Event-driven modular security framework for monitoring the activity of Linux devices at runtime, powered by eBPF.
https://github.com/exein-io/pulsar
Details:
https://blog.exein.io/pulsar-tutorial
2 notes
·
View notes
Text
Process behaviour anomaly detection using eBPF and unsupervised learning
https://www.evilsocket.net/2022/08/15/Process-behaviour-anomaly-detection-using-eBPF-and-unsupervised-learning-Autoencoders/
Comments
1 note
·
View note
Text
Retina: Kubernetes Network Observability platform
Kubernetes Network Observability
The Retina platform, which is cloud-native and allows Kubernetes users, administrators, and developers to visualize, observe, debug, and analyze Kubernetes workload traffic regardless of the Container Network Interface (CNI), operating system (OS), or cloud, is being released by the Microsoft Azure Container Networking team with great excitement. They are thrilled to make Retina available as an open-source repository that supports networking scenarios relating to DevOps and SecOps for your Kubernetes clusters. They cordially urge the open-source community to collaborate with us on future innovations.
Microsoft AI technology is shown in photography, which foretells a student’s likelihood of dropping out of school in order to support teachers proactively.
A framework for cloud-native container networking observability
Cloud native technologies such as Kubernetes have simplified the process of developing mobile apps. Simultaneously, a lot of apps have grown in complexity, making cloud management them harder and harder. Network-related observability, troubleshooting, and debugging have become harder when businesses create cloud-native apps made up of linked services and then deploy them to several public clouds in addition to their own infrastructure.
Retina aims to provide actionable network insights, such as how containerized micro-services interact, in a non-intrusive manner without requiring changes to the applications themselves, thanks to the extended Berkley Packet Filter (eBPF). Retina will emphasize application developers’ experience in a new way, democratizing network observability and debugging. Retina relieves developers of the burden of having to manage the intricate details of the underlying network architecture and transformations by giving them easy tools to monitor and debug their apps for problems like packet loss and latency.
They are eager to expand on this partnership and interact with more communities, as well as to strengthen their good community experience with eBPF and Cilium. We think that by making Retina available to the community, Azure will be able to gain from well-informed criticism, creative suggestions, and teamwork that will help us improve and broaden Retina’s capabilities.
Retina capabilities and solutions
Azure discovered significant gaps in network monitoring, or the gathering of network metrics and traces from Kubernetes clusters, by utilizing our vast expertise administering several container networking services for the Azure Kubernetes Service (AKS). Retina is a state-of-the-art solution that bridges these gaps by addressing the intricate problems associated with maintaining and sustaining Kubernetes networks. It offers site- and infrastructure-reliability engineers thorough understanding of cluster networking. Additionally, Retina offers comprehensive traffic analysis inside the framework of Kubernetes, converting measurements into network flow logs or the industry-standard Prometheus.
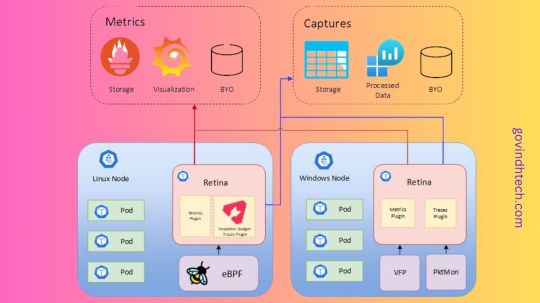
The usability and adaptability of existing open-source solutions are typically limited by their close coupling to certain CNIs, OSs, or data planes. Retina is a useful complement to any current toolkit as it was created to be a highly flexible, adaptive, and extendable framework of plugins that can function flawlessly with any CNI, OS, or cloud provider. Supporting both Linux and Windows data planes, Retina maintains a small memory and CPU footprint on the cluster, this is true even at scale while meeting the various demands of infrastructure- and site-reliability engineers. Azure can quickly modify and customize Retina to suit new use cases without relying on any particular CNI, OS, or data plane because to its pluggability design ethos.Image credit to Azure
Deep network traffic insights, including Layer 4 (L4) measurements, DNS metrics, and distributed packet captures, are one of Retina’s primary features. The Kubernetes app model is completely integrated, providing pod-level data along with comprehensive context. It provides node-level metrics (like forward, drop, Transmission Control Protocol (TCP), User Datagram Protocol (UDP), and Linux utility) and pod-level metrics (like basic metrics, DNS, and API server latency) with actionable networking observability data that is emitted into industry-standard Prometheus metrics.
Label-driven distributed packet captures in Retina let users choose what, where, and from whom to collect packets. It also offers sophisticated debugging tools and historical context for network flow logs, which improve network troubleshooting and performance optimization.
Azure’s plans for the retina
Many businesses use several clouds and want solutions that function well on Microsoft Azure as well as other clouds and on-premises. From the start, Retina is multi-cloud and open-source. They want to educate the larger cloud-native community about their expertise and ambition for Kubernetes networking observability by making Retina open-sourced. Through cooperation with other developers and organizations who have similar experiences and aspirations in this industry, we hope that Retina will continue to grow and expand.
Extensibility has always been important in architecture and will continue to be so. With Retina, data gathering is extensible, making it simple for users to add additional metrics and insights. Additionally, it provides flexibility in exporters, allowing users to interact with other tools and monitoring systems. Because of its adaptability to various use cases and circumstances, Retina is a strong and flexible platform for Kubernetes networking observability.
Finally, Azure will see Retina as a platform that everyone can use to contribute, expand, and develop, eventually leading to the creation of a reliable, well-thought-out, all-inclusive solution for Kubernetes networking observability.
Overview of Retina
Retina: What Is It?
Retina is an open-source, cloud-independent Kubernetes Network Observability platform that supports compliance, DevOps, and SecOps use cases. It serves as a single portal for cluster network administrators, cluster security administrators, and devops engineers to monitor the security and health of applications and networks.
Retina gathers telemetry that is configurable and can be exported to various storage platforms (like Prometheus, Azure Monitor, and other vendors) and displayed in many ways (like Grafana, Azure Log Analytics, and other vendors).
Features
Network Observability platform for Kubernetes workloads based on eBPF.
Both configurable and on-demand.
Industry-standard Prometheus metrics that are actionable.
Simplified Packet Captures for In-depth Analysis.
Multi-OS support (such as Windows, Linux, and Azure Linux) and independence from cloud providers.
For what reason is Retina?
With Retina, you can keep an eye on your clusters and look into network problems whenever you choose. Here are a few situations where Retina excels, reducing trouble spots and research time.
Examining: Troubleshooting Network Connectivity
Why are my Pods no longer able to interact with one another? A typical inquiry takes a lot of time and entails doing packet captures, which need access to each node, identification of the nodes involved, running of tcpdump commands, and exporting of the data from each node.
With only one CLI command or CRD/YAML file, you can use Retina to automate this procedure. It can:
Perform captures on every Node that is home to the relevant Pods.
Upload the output from every Node to a storage blob.
Keeping an eye on the network Actionable insights are supported by Health Retina via Grafana dashboards, Prometheus alerts, and other features. As an example, you can:
Track lost connections inside a namespace.
Notify me when production DNS error rates increase.
Assess the scalability of your application while monitoring variations in API Server latency.
Should a Pod begin to transmit excessive amounts of traffic, notify your security team.
Metrics and captures are the two forms of telemetry that Retina employs.
Metrics Retina metrics provide ongoing observation of:
Traffic moving in and out
Packets dropped
TCP/UDP
DNS
API Server latency
Statistics for nodes and interfaces
Retina offers the two
Advanced/Pod-Level metrics (if enabled) and
Basic metrics (default, Node-Level metrics).
Takes Pictures
Network traffic and information for the designated Nodes/Pods are recorded in a Retina capture.
The ability to output captures to numerous destinations is available on demand. See Captures for more details.
Read more on govindhtech.com
0 notes
Text
0 notes
Photo

Эксперименты Linux Scheduler на Rust
Инженер Canonical экспериментировал с реализацией планировщика Linux на языке программирования Rust. Его первые результаты интересны и ��селяют надежду на потенциал планировщика на базе Rust, который работает через sched_ext для реализации планировщика с использованием eBPF, который может быть загружен во время выполнения. Первые эксперименты разработчика обещают многообещающие результаты для производительности в играх! В своем видео он демонстрирует практически удвоение производительности в игре Terraria.
https://www.gamebuntu.ru/news/eksperimenty-linux-scheduler-na-rust/
1 note
·
View note
Text
Cisco to acquire cloud-native networking and security startup Isovalent | TechCrunch
Cisco announced this morning that it intends to acquire Isovalent, a cloud-native security and networking startup that should fit well with the company’s core networking and security strategy. The companies did not share the purchase price.
Isovalent has helped develop eBPF, a key open source technology that gives developers deep insight into the operating system layer, typically Linux, but also…
View On WordPress
0 notes
Text
2023年12月19日に発売予定の翻訳書
12月19日(火)には22冊の翻訳書が発売予定です。
おかえり、オオカミ
レイチェル・ブライト/著 ジム・フィールド/イラスト 安藤サクラ/翻訳
トゥーヴァージンズ
パティさんの編み物知恵袋 : もっとかんたん、きれいに編める
パティ・ライオンズ(Patty Lyons)/著 西村知子/翻訳
朝日出版社
メタゾアの心身問題 : 動物の生活と心の誕生
ピーター・ゴドフリー=スミス/原著 塩﨑香織/翻訳
みすず書房
不自然な自然の恵み : 7つの天然素材をめぐる奇妙な冒険
エドワード・ポズネット/原著 桐谷知未/翻訳
みすず書房
WEIRD「現代人」の奇妙な心理(上) : 経済的繁栄、民主制、個人主義の起源
ジョセフ・ヘンリック/著 今西康子/翻訳
白揚社
WEIRD「現代人」の奇妙な心理(下) : 経済的繁栄、民主制、個人主義の起源
ジョセフ・ヘンリック/著 今西康子/翻訳
白揚社
官僚制・家産制・封建制
マックス・ウェーバー/著 野口雅弘/翻訳
岩波書店
人類歴史哲学考 (二)
ヘルダー/著 嶋田洋一郎/翻訳
岩波書店
ナイチンゲールが歌ってる
ルーマー・ゴッデン/著 脇明子/翻訳 網中いづる/著
岩波書店
ママたちが言った
アリシア・D・ウイリアムズ/著 ブリアナ・ムコディリ・ウチェンドゥ/イラスト 落合恵子/翻訳
クレヨンハウス
シェイクスピアの記憶
ホルヘ・ルイス・ボルヘス/著 内田兆史/翻訳 鼓直/翻訳
岩波書店
ヒューマンボディ 原著第7版
Barbara Herlihy/著 坂井建雄/監修 大久保暢子/監修 工藤宏幸/監修
エルゼビア・ジャパン
中世の写本の隠れた作り手たち : ヘンリー八世から女世捨て人まで
メアリー・ウェルズリー/著 田野崎アンドレーア嵐/監修 和爾桃子/翻訳
白水社
入門 eBPF : Linuxカーネルの可視化と機能拡張
Liz Rice/著 武内覚/翻訳 近藤宇智朗/翻訳
オライリー・ジャパン
[図説]世界の水の神話伝説百科
ヴェロニカ・ストラング/著 角敦子/翻訳
原書房
アガサ・クリスティー とらえどころのないミステリの女王
ルーシー・ワースリー/著 大友香奈子/翻訳
原書房
小麦の地政学 : 世界を動かす戦略物資
セバスティアン・アビス/著 児玉しおり/翻訳
原書房
ホビットの料理帳
ロバート・トゥーズリー・アンダーソン/著 川添節子/翻訳
原書房
コロナワクチン その不都合な真実 : 世界的権威が明かすmRNAワクチンの重大リスク
アレクサンドラ・アンリオン・コード/著 鳥取絹子/翻訳
詩想社
オー・ヘンリー ショートセレクション 賢者の贈り物
オー・ヘンリー/著 千葉茂樹/翻訳 ヨシタケシンスケ/イラスト
理論社
静かな働き方 : 「ほどよい」仕事でじぶん時間を取り戻す
シモーヌ・ストルゾフ/著 大熊希美/翻訳
日経BP 日本経済新聞出版
地盤工学の実務におけるコーン貫入試験
石原研而/監修 齋藤邦夫/編集 深沢健/編集
CPT技術協会
0 notes
Last Seen Blogs

qwerty22122
Untitled

langverse
I can barely speak my mothertongue

lifechange
Untitled

mslizshowbizrant
Liz

disappointingsince2001
ur mum