#american journal of biomedical science & research
Text
A Brief Overview on the Methods of Impact Evaluation of Public Policies

A Brief Overview on the Methods of Impact Evaluation of Public Policies in Biomedical Journal of Scientific & Technical Research
https://biomedres.us/fulltexts/BJSTR.MS.ID.006047.php
Impact assessment is an important tool for the formulation and implementation of evidence-informed public policies. The primary objective of this article is to present a brief review of the methods most commonly used in evaluating the impact of public policies, and the secondary objective is to present examples of the application of these methods in the evaluation of programs to promote physical activity. Quasi-experimental methods are configured as an important alternative for the construction of causal inferences about the impact of policies and programs, especially when it is not possible to participate in these interventions and do not happen randomly. In this sense, we highlight the propensity score matching method and the difference-in-differences estimator, which can be used alone, combined with each other or with other methods to generate valid and robust estimates of the causal effect. At the end of the article, the application of these methods in evaluating the impact of physical activity programs in Brazil and the United States is presented, emphasizing the versatility of these methods to assess the impact by comparing groups of aggregated units (such as municipalities), either to verify the effect of an intervention on groups of individuals.
For more articles in Journals on Biomedical Sciences click here bjstr
Follow on Twitter : https://twitter.com/Biomedres01
Follow on Blogger :https://biomedres01.blogspot.com/
Like Our Pins On : https://www.pinterest.com/biomedres/
#American medical journal#Journals on Biomedical Engineering#Journals on Biomedical Science#Journal of Biomedical Research and Review#Biomedical Open Access Journals
0 notes
Text
Biomed Grid | Antihypertensive Peptides in Dairy Products
Introduction
Milk and dairy products are rich in protein content, and main proteins in milk casein and whey proteins are the principle bioactive peptide precursors [1]. Although there are numerous studies on bioactive peptides, the first discoveries of bioactive peptides from foods are dairy products. These bioactive peptides have different functions such as antihypertensive, opioid, immune-modulatory, antimicrobial, and antioxidant [2, 3, 4, 5]. Hypertension is a condition in which the blood vessels have persistently raised pressure [6]. It affects approximately 30% of the adult population worldwide [7]. It is a prominent risk factor for cardiovascular diseases such as coronary heart disease, peripheral artery disease, and stroke. Even though it is a controllable disease high prevalence, and serious consequences make hypertension an important comprehensive health threat [7]. ACE (peptidyldipeptide hydrolase, EC 3.4.15.1) is an exopeptidase which splits various peptides from C-terminal and forms dipeptides. ACE performs a critical role in regulating the blood pressure by the renin-angiotensin and bradykinin pathways. Angiotensin I is a decapeptide and inactive in its intact form. ACE catalyzes hydrolyzation of angiotensin I to the potent vasoconstrictor octapeptide angiotensin II[8]. Bradykinin, a vasodilator, is involved in the blood pressure system. ACE also controls the blood pressure by degrading bradykinin. Thus, inhibition of ACE results in an antihypertensive effect. Consequently, synthetic ACE inhibitors such as captopril and enalapril, are used in the treatment of hypertension and other related heart diseases [9]. However, they can cause adverse effects such as hypotension, cough, altered taste, rash and angioedema [10]. Bioactive peptides are natural and healthier alternatives to synthetic ACE inhibitors without side effects [11]. Although there are many different protein sources of ACE inhibitor peptides, milk proteins are accepted as the primary sources [12]. Chemical structures of peptides are important for binding to the catalytic sites of ACE [13, 14]. The presence of aromatic or branched hydrophobic structures in the tripeptide structure at the carbon end of the peptide is necessary for binding [13, 15]. Several functional dairy products are present in the market comprising antihypertensive peptides. Calpis sour milk in Japan (Calpis Co Ltd, Tokyo, Japan) cultured via Saccharomyces cerevisiae and Lactobacillus helveticus poses two potent ACE inhibitory peptides, Val-Pro-Pro and Ile-Pro-Pro [15]. These two peptides are also present in calcium-enriched fermented milk drink in Finland [16]. In short- and long-term human studies have shown that IPP and VPP peptides decrease blood pressure [4]. BioZate contains β-lactoglobulin fragments as functional bioactive peptides [16]. This paper will review studies on antihypertensive especially, ACE inhibitor peptides and their production in dairy products.
Factors Affecting Occurrence of Bioactive Peptides in Dairy Products
The bioactive peptide profile of a dairy product is tightly dependent on processes used such as thermal processes, homogenization, pressure applications, coagulation of milk, fermentation, and ripening [17]. Thermal processes are essential in the production of almost all dairy products. Reactions that occurred during thermal processes can affect the structure of proteins and the bioactive peptide content of the product [17, 18]. Thermal processes affect activities of natural enzymes found in milk, thus affect the peptide profile of the last product. Caseins are hydrolyzed through the action of enzymes from different sources such as casein residue coagulants, natural milk enzymes, starter culture enzymes, enzymes of seconder cultures and non-starter lactic acid bacteria [5].
ACE Inhibitor Peptides Naturally Found in Milk and Dairy Products
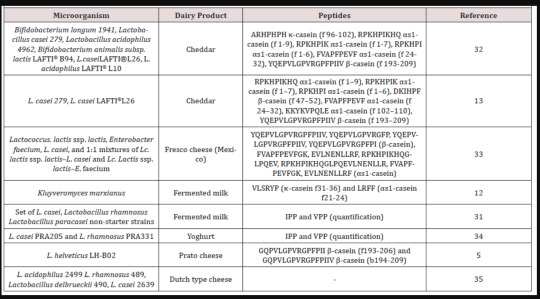
In general, dairy products, in particular, fermented dairy products, are the most popular foods for the intake of bioactive peptides with their sensory properties and high levels of consumption favored by consumers [1]. Some of these studies summarized in (Table 1). Among the dairy products, ripened cheeses contain numerous peptides, affecting the properties of the final product such as taste, odor, and texture due to the variety and complexity of the production methods. ACE inhibitor peptides in Spanish cheeses (Cabrales, Idiazábal, Roncal, Manchego, Mahón and goat’s milk) are identified [14]. In this study, researchers confirmed ACE inhibition effect of 8 synthetic peptides (VRGP, PFP, QP, DKIHP, PKHP, FP, PP, and DKIHPF). Since proteolysis and peptide formation continue during cheese ripening, the ACE inhibitor effect may alter during the cheese maturation period. Further proteolysis during ripening may cause hydrolyzation of bioactive peptides and inactivation of them. Gomez-Ruiz et al. [19] determined the ACE-inhibitor peptides in Manchego cheese. The antihypertensive activity reached the maximum level after eight months of maturation and decreased again after twelve months of maturation. Likewise, Gouda ripened for 8 months decreased more strongly the blood pressure of spontaneously hypertensive rats than 24-month-old Gouda, although they have a similar ACE inhibitor activity in vitro [3]. In view of composition rich in proteins, cheese whey can be considered as a valuable source of bioactive proteins [20]. Alongside studies on bioactivities of cheese varieties some researchers identified ACE inhibitor peptides (FVAPFPE, NLHLPLPLLQ, FVAPFPEVFG, NLHLPLPLQ originated from αs1-casein, β-casein, αs1-casein, β-casein, respectively) in a liquid waste deriving from Ricotta cheese production [21]. Probiotic fermented milk beverage from milk of different species also have antihypertensive activity [22, 23]. Caseins are the best precursors for the production of angiotensin I am converting enzyme (ACE) [de Gobba et al. 2014].
Table 1: Antihypertensive peptides found in dairy products.
Production of ACE Inhibitor Peptides from Milk Proteins
Basically, there are two approaches to generate ACE-inhibitor peptides from milk proteins. One approach is to utilize the proteolytic enzymes of lactic acid bacteria in fermented dairy products. The other approach is to hydrolyze milk proteins in vitro by one protease or a combination of various proteases or peptidases.
Production of ACE Inhibitor Peptides with Enzymes
Most of the researches about the production of bioactive peptides with enzymes have utilized digestive enzymes, and commercial dry cheese whey, purified whey proteins or microfiltration permeates as a substrate [27]. Besides, other digestive enzymes from different sources and various milk protein preparations have been studied to generate antihypertensive peptides (Table 2). Different bioactive peptides are produced from caseins of milk from different species, which implicates the sequence and conformation of the caseins affect the bioactive peptide yield [28]. Minervini et al. [29] used a proteinase from Lactobacillus helveticus PR4 to obtain ACE inhibitor and antimicrobial peptides from casein of milk from six different species (bovine, sheep, goat, pig, buffalo, and human). Abdel-Hamid et al. [29] identified new peptide sequences (FPGPIPK, IPPK, QPPQ) showing ACE inhibitor activity generated from buffalos’ skim milk hydrolyzed with papain.
Table 2: Using proteases to generate ACE inhibitor peptides from milk proteins.
ACE inhibitor and antioxidant capacity of 6 synthetic peptides (WY, WYS, WYSL, WYSLA, WYSLAM, WYSLAMA) deriving from β-lactoglobulin were evaluated [30]. Dipeptide WY β-lactoglobulin fragment f (19-20) showed potent ACE inhibitor activity. ACE inhibitor activity depends on the amino acid sequence in the C-terminus of the peptide, and the amino acid Ser at the C –terminus showed a potential decreasing effect on ACE inhibitor activity. Sheep cheese whey hydrolyzed using proteinase from Bacillus sp. P7 to generate ACE inhibitor peptides [20]. ACE inhibitor activity was dependent on hydrolysis time. In a recent work, trypsin from bovine pancreas employed to hydrolyze whey from the production of panela cheese to generate bioactive peptides [27]. The researchers found a significant correlation between antioxidant and ACE inhibitor activity.
Production of ACE Inhibitor Peptides through Fermentation
In the dairy industry mainly highly proteolytic starter cultures are preferred. Bioactive peptides can be generated by the starter culture or non-starter bacteria added as an adjunct culture (Table 3).
Table 3: Obtaining ACE inhibitor peptides by using adjunct culture and fermentation.
Ahtesh et al. [1] produced a new fermented functional dairy product with combination of L. helveticus and Flavourzyme® using a bioreactor. They have achieved to obtain an acceptable product with high ACE inhibitor activity. L. helveticus is a highly proteolytic bacterium, thus, there are many studies on both fermentation with this bacterium and hydrolysis with proteinases of this bacterium [22, 28].
Similarly, researchers utilized L. helveticus LH-B02 strain in order to improve the ACE inhibitor activity in Prato cheese [5]. They observed that levels of ACE inhibitor peptides β-casein (f193-206) and β-casein (f194-209) increased while relative intensity of αS1- casein (f1-9) reduced. Gonzalez Gonzalez et al. [25] isolated highly proteolytic lactic acid bacteria from Chiapas cheese and evaluated tendency of releasing bioactive peptides of selected strains. They employed four selected strains for fermentation of milk and observed that most proteolytic strain has lowest ACE inhibitor activity, presumably according to further breakdown peptides to inactive amino acids. Solieri et al. [31], fermented bovine milk with non-starter lactic acid bacteria (Lactobacillus casei, Lactobacillus paracasei and Lactobacillus rhamnosus strains) to evaluate their potential to produce fermented milk with enhanced ACE inhibitor activity [32, 34, 35]. They concluded that the strains used in the study especially L.casei PRA205 can produce high amounts of VPP and IPP peptides.
Conclusion
In recent years, the tendency to consume functional health-promoting foods has increased the interest in bioactive peptides. There are numerous studies on bioactive peptides in foods in the literature. Dairy products, which are an indispensable part of a healthy and balanced diet, are considered as ideal sources for bioactive peptides and natural alternatives to therapeutic drugs due to their high protein content and technological processes in production. However, the mechanism of action of bioactive peptides is not fully described. Molecular studies employing new technologic enhancements and peptidomics approach are necessary to understand the mechanisms of antihypertensive peptides as well as to design functional products.
Read More About this Article: https://biomedgrid.com/fulltext/volume7/antihypertensive-peptides-in-dairy-products.001139.php
For more about: Journals on Biomedical Science :Biomed Grid | Current Issue
#biomedgrid#american journal of biomedical science & research#american medical journal#open access clinical and medical journal
0 notes
Text


How can medicinal mushrooms support your mood and emotions?👀
[Hit SAVE so you can get these little miracle workers later!]
🍄Lion’s Mane: In a study of 30 women who were randomly assigned a snack of cookies containing Lion’s Mane or placebo cookies for 4 weeks, the Lion’s Mane group reported a significant reduction in feelings of helplessness, irritability and anxiety (Biomedical Research, 2010).
🍄Maitake: Researchers in 2017 found that Maitake had promising effects on mood and suggested it could be “a safe medical food supplement for the patient with depression” (Pharmaceutical Biology, 2017). This mushroom also acts as an adaptogenic food and can lower the stress hormone cortisol (Northern American Journal of Medical Sciences, 2011).
🍄Poria: Researchers in 2020 discovered that by calming the overreaction of the immune system and regulating our important neurotransmitters, including feel-good hormones serotonin and dopamine, Poria had a positive effect on mood. They also suggested that it could be “a traditional herbal
potential medicine for the treatment of depression.” (Journal of
Enthnopharmacology)
🍄Reishi: This powerful mushroom has been shown to reverse the decline in serotonin in the brain, meaning more of this happy hormone is circulating the brain to keep a positive mindset (Applied Microbiology and Biotechnology, 2021). Additionally, Reishi can help avoid low blood sugar, a common trigger for bad moods.
24 notes
·
View notes
Text
The University of Groningen | Bachelor's & Master's programs

After completing the Master's, you can decide to continue your studies and get a doctoral degree. Therefore, it does not always mean that you have to go to any undergraduate or postgraduate program for studying abroad. The students can always choose to move to a foreign university for research work. In this process, they will get ample resources to study and advanced equipment.
The University of Groningen is famous for its amazing research ambiance, infrastructure, and Master's degree programs. For more than 100 years, this institute has been standing with great glory and is the reason behind the success of millions of aspirants. You can get your hands on all the internal information about the university from the best study abroad consultants in Delhi. Moreover, it is at a high rank among the influential educational institutions of the world. So, your career will surely reach a fabulous stage after completing any course from this university.
Current Status Of The University Of Groningen
The current statistics tell that more than 34,000 students are a precious part of Groningen University. In the global rank, the position of this university is 64. Thus, it will be a fabulous opportunity for any aspirant to join such a reputed university occupying a place in the top 100 universities worldwide. If you have any doubt regarding the admission procedures or academic background, the study abroad consultants in Delhi can help you.
The University of Groningen knows how to pick the most deserving candidate for the seat. Moreover, it considers the academic prospects, achievements, and talent for choosing the right candidate. Although the institution offers Bachelor's degree programs, the popularity arises for postgraduation degree courses.
In 2021, the university received a precious award for the outstanding performances of its students in various fields. It was the winner of the Global Student Satisfaction Awards. Therefore, it shows how students feel happy and secure after studying in such a high-standard college. You will surely get favorable feedback from the best overseas education consultants in Delhi about Groningen University.
List Of Various Courses and Study Programs
The Master-degree programs are enlisted below;-
Business and Management
Social Sciences
Engineering and Technology
Natural Sciences and Mathematics
Computer Science and IT
Arts, Architecture, and Designs
Training and Education
Law
Media and Journalism
Agriculture and Forestry
Medicine and Health
Hospitality, Leisure, and Sports
Applied Sciences and Professions
Now it is time to take a glance at the Bachelor's degree programs;-
Dutch Language and Culture
Media Studies
Tax Law
American Studies
Archaeology
Artificial Intelligence
Arts, Culture, and Media
Middle Eastern Studies
Business and Regular Economics
Medicines
Human Movement Sciences
Life Science and Technology
Liberal Arts and Sciences
History
Minorities and Multilingualism
Global Responsibility and Leadership
Industrial Engineering
Applied Physics
Biology
Biomedical Engineering
Information Science
Chemistry
Classics
Religious Studies
Sociology
Data Science and Integrity
Computer Sciences
Theology
Dentistry
Psychology
Pharmacy
Communication and Information Studies
Law and ICT
Business Administration
Notarial Law
Human Geography and Planning
Several other programs also form part of the entire study curriculum of the university. Therefore, you will have ample choices while selecting the course. Please enter all your details beforehand and consult the experts. Quick suggestions can help you understand the process well. Please ensure that you have complete knowledge about the university and the course structure to avoid any kind of discrepancies in the future. Of course, the best Netherland consultants in Delhi will support you in going ahead.
All You Need To Know About Admissify
It is time to end all your searches for the best overseas education consultant in Delhi for the Netherlands. Click and visit admissify.com, and all your answers will be satisfied one by one. Furthermore, you can also ring 09999-127085 or Whatsapp on the number to connect with the executives. The Live Chat option is also present on the web portal of Admissify. Recently, the launch of the mobile app made it one of the most preferable and dependable platforms for immigration purposes. So, make the plan and connect with the right person to fulfilling your dreams.
#studyabroad#abroad consultant delhi#abroad study scholarship#study abroad#ielts online coaching in delhi#uk scholarships for indian students#best overseas education consultant in delhi#canada study visa#scholarship to study in uk for indian students#admissify#science#sports
2 notes
·
View notes
Text
Close up shot of Ginkgo Biloba
mindful advantage comprises 17 science-backed ingredients that will effectively improve your brain vitality, reverse brain aging to some extent, and improve the
brain’s ability to stay productive and avoid procrastination.
The pine bark extract also has powerful antioxidant and anti-inflammatory properties and may improve skin health and circulation.
Huperzia Serrate
Close up shot of Huperzia Serrate
A study in the Journal of Ethnopharmacology showed that huperzia serrata extract, which contains the active ingredient Huperzine A, can have a neuroprotective effect
and may benefit individuals with Alzheimer's disease [9].
The clubmoss is traditionally used in Chinese medicine and can also aid memory, learning enhancement, and alertness.
L-Carnitine
According to a study in the American Journal of Clinical Nutrition, L-carnitine supplementation can support cognitive function in older adults [10].
A naturally occurring amino acid derivative, L-carnitine is often used for its potential to aid in weight loss and enhance physical performance.
Lion’s Mane
A study in biomedical research indicated that lion's mane mushroom can enhance cognitive function [11].
This edible mushroom is used in gourmet cooking and traditional Chinese medicine. It is also suggested to support nerve growth, immune health, and mood.
mindful advantage Benefits
People outside doing yoga poses together on yoga mats
As indicated by its many different and effective ingredients, mindful advantage has multiple health and brain-related benefits.
Based on our tests, below are the most notable benefits you will experience upon regularly consuming mindful advantage.
All-In-One Formula
mindful advantage contains all the potent ingredients you need to achieve better cognitive functioning and eliminate procrastination.
It is a powerful all-in-one formulation containing up to 17 effective nootropic ingredients offering various health benefits.
When combined into a single product, we concluded after our testing that these ingredients will provide convenience and cost-effectiveness for users seeking cognitive
enhancement.
Science-Backed Ingredients
A scientist looking at the ingredients of mindful advantage
All ingredients contained in the powerful mindful advantage formulation were previously researched and tested to ensure all the benefits they claim to yield.
When you combine all these well-researched and backed-up science ingredients into a single product, the outcome can only be positive.
Lion's mane, ashwagandha, and Rhodiola rosea will improve your overall brain functioning while improving your information processing speed, concentration, and ability
to focus for prolonged periods.
1 note
·
View note
Text
Journal of Medical Case Reports

Journal of Medical Case Reports accepting case reports in medical science journal, medical case reports journal, journals accepting medical case reports, journals publishing medical case reports etc. Journal publishes methods of diagnosis, treatment, and prevention of diseases. The practice of medicine involves multidisciplinary study and application of concepts of several branches of biomedical sciences, genetics, microbiology, immunology etc. Furthermore, practice of medicine also requires a thorough knowledge of pharmaceutical sciences and surgery. It also takes the help of other therapies like physiotherapy, psychotherapy and preventive medicine. Medicine research is therefore, an intricate subject that has multiple facets, each of which needs to be addressed in great detail before a specific diagnostic or therapeutic method is standardized for large scale application.
Journal Homepage: https://www.literaturepublishers.org/
Manuscript Submission
Authors are requested to submit their manuscript by using Online Manuscript Submission Portal:
(or) also invited to submit through the Journal E-mail Id: [email protected]
American Journal of Phytomedicine and Clinical Therapeutics: American Journal of Phytomedicine and Clinical Therapeutics is an open access peer reviewed and monthly published research journal that publishes articles in the field of Phytomedicine and Clinical Therapeutics. It is an international journal to encourage research publication to research scholars, academicians, professionals and students engaged in their respective field.
Related Journals: Herbal Medicine: Open Access, Natural Products Chemistry & Research, American Journal of Drug Delivery and Therapeutics
Translational Biomedicine
Translational Biomedicine: Translational Biomedicine is an international open access, peer-reviewed academic journal. The Journal publishes original science-based research that advances communication between the scientific discovery and health improvement. Translational Biomedicine publishes Original research and/or commentary on diseases with implications for treatment Clinical translation where scientific ideas are translated into clinical trials or applications, Nutrition research: the interaction and validation between research and application Perspectives and Reviews on current basic science or clinical science research topics Survey of recent significant published findings. Journal Highlights Includes: Translational Biomedical Research, Translational Research and Clinical Intervention, Translational Stroke, Translational Neurology, Translational Oncology, Translational imaging, Translational Psychiatry, Orthopedic Translation, Stem Cell Translation Medicine, Translation Proteomics, Translational Neuroscience, Translational Cancer Research, Discovery Biology, Medical Biotechnology.
0 notes
Text
Journal of Medical Case Reports

Journal of Medical Case Reports accepting case reports in medical science journal, medical case reports journal, journals accepting medical case reports, journals publishing medical case reports etc. Journal publishes methods of diagnosis, treatment, and prevention of diseases. The practice of medicine involves multidisciplinary study and application of concepts of several branches of biomedical sciences, genetics, microbiology, immunology etc. Furthermore, practice of medicine also requires a thorough knowledge of pharmaceutical sciences and surgery. It also takes the help of other therapies like physiotherapy, psychotherapy and preventive medicine. Medicine research is therefore, an intricate subject that has multiple facets, each of which needs to be addressed in great detail before a specific diagnostic or therapeutic method is standardized for large scale application.
Journal Homepage: https://www.literaturepublishers.org/
Manuscript Submission
Authors are requested to submit their manuscript by using Online Manuscript Submission Portal:
https://www.literaturepublishers.org/submit.html
(or) also invited to submit through the Journal E-mail Id: [email protected]
American Journal of Phytomedicine and Clinical Therapeutics: American Journal of Phytomedicine and Clinical Therapeutics is an open access peer reviewed and monthly published research journal that publishes articles in the field of Phytomedicine and Clinical Therapeutics. It is an international journal to encourage research publication to research scholars, academicians, professionals and students engaged in their respective field.
Related Journals: Herbal Medicine: Open Access, Natural Products Chemistry & Research, American Journal of Drug Delivery and Therapeutics
Translational Biomedicine
Translational Biomedicine: Translational Biomedicine is an international open access, peer-reviewed academic journal. The Journal publishes original science-based research that advances communication between the scientific discovery and health improvement. Translational Biomedicine publishes Original research and/or commentary on diseases with implications for treatment Clinical translation where scientific ideas are translated into clinical trials or applications, Nutrition research: the interaction and validation between research and application Perspectives and Reviews on current basic science or clinical science research topics Survey of recent significant published findings. Journal Highlights Includes: Translational Biomedical Research, Translational Research and Clinical Intervention, Translational Stroke, Translational Neurology, Translational Oncology, Translational imaging, Translational Psychiatry, Orthopedic Translation, Stem Cell Translation Medicine, Translation Proteomics, Translational Neuroscience, Translational Cancer Research, Discovery Biology, Medical Biotechnology.
Related Journals: Translational Cancer Research, Orthopedic Translation, Translational Proteomics, Translational Biomedical Research, Translational Neuroscience, Clinical and Translational Gastroenterology, Molecular Therapy, Stem Cell Translation, Translational Biomedical Research, Translational Clinical Research
American Journal of Ethnomedicine
American Journal of Ethnomedicine: American Journal of Ethnomedicine is an open access, peer-reviewed, bimonthly, online journal that aims to promote the exchange of original knowledge and research in any area of ethnomedicine.
American Journal of Ethnomedicine invites research articles and reviews based on original interdisciplinary studies on the inextricable relationships between human cultures and nature/universe, Traditional Environmental/Ecological Knowledge (TEK), folk and traditional medical knowledge, as well as the relevance of these for environmental and public health policies.
Specifically, the journal will cover the following topics: ethnobotany, ethnomycology, ethnozoology, ethnoecology (including ethnopedology), ethnometereology/ ethnoclimatology, ethnoastronomy, ethnopharmacy, ethnomedicine, ethnoveterinary, traditional medicines, traditional healthcare in households and domestic arenas, migrant healthcare/urban ethnobiology, pluralistic healthcare in developing countries, evidence-based community health, visual ethnobiology and ethnomedicine, gender studies and ethnobiology, as well as other related areas in environmental, nutritional, medical and visual anthropology. Botanically-centered manuscripts must clearly indicate voucher specimens and herbaria.
Journal of Biomedical Sciences
Journal of Biomedical Sciences: Journal of Biomedical Sciences is an international, peer reviewed journals which publishes high quality of article and novel research contribution to scientific knowledge. The Journal of Biomedical Sciences is an open access, peer-reviewed journal that encompasses all fundamental and molecular aspects of basic medical sciences, emphasizing on providing the molecular studies of biomedical problems and molecular mechanisms. The Journal of Biomedical Sciences gives an area to share the information among the medical scientists and researchers
Journal highlights includes: Cognitive and neurosciences, Biochemical engineering, Molecular biology, Gas transport and metabolism, Cardiac assist devices, Vascular autoregulation, Protein science, Structural biology, Biomedical ultrasound, Neuroengineering, Heart mechanics, Biomedical science, Genetics
Related Journals: Biomedicine Journal, Biomedical Science and Engineering Journal, Medicine Journal, Journal of pharmaceutical and biomedical sciences, Journal of Biomedical sciences and Research, Journal of Biomedical Research, Neurology Journal, Biomedical Engineering Journal, Cellular Biology Journal, Alzheimer?s Disease Journal, Clinical Immunology Journal, Genetics and Genomics Research Journal, Archives of Medicine Journal, Journal of Clinical & Biomedical Sciences, Journal of Cognitive Neuroscience, Neuroscience Journals, Behavioral Sciences journal, Journal of Neuroscience & Cognition, Journal of Psychology, Journals of Gerontology
Journal of Regenerative Medicine
Journal of Regenerative Medicine: Regenerative Medicine journal covers wide range of topics such as regenerative medicine therapies, stem cell applications, tissue engineering, gene and cell therapies, translational medicine and tissue regeneration etc. The journal provides hybrid access platform to publish the original research articles, review articles, case reports, short communications, etc and provides the rapid dissemination of significant research in various disciplines encompassing all areas of stem cells and regenerative medicine.
Journal Highlights: Cell and Organ Regeneration, Cell Engineering, Cellular Therapies, Diagnostics and Imaging, Ethical and Legal Issues, Gene Therapies, Human Pathological Conditions, Immunotherapy, Models of Regeneration, Nanoscaffolds in Regenerative Medicine, Regenerative Biology, Rejuvenation, Stem Cell Transplantation, Stem Cell Treatments, Stem Cells, Tissue Engineering, Tissue Repair and Regeneration, Translational Medicine, Translational Medicines, Translational Science, etc.
Related Journals: Journal of Tissue Engineering and Regenerative Medicine, Journal of Regenerative Medicine & Tissue Engineering, International Journal of Stem Cells, Stem Cell Research, Journal of Stem Cell Research & Therapy, Stem Cell Biology and Research, Biomaterials, Cardiovascular Journals, Cell Biology Journals, Hematology Journals, Liver Journals
0 notes
Text
Study sheds light on how IBD can develop
The intestinal epithelium, made up of a layer of cells that lines the intestine, plays an important role in IBD because it can be easily disrupted during gut inflammation. A specialized type of epithelial cells are Paneth cells. The antimicrobial peptides these cells produce help regulate the gut microbiota, or the community of microorganisms that exist in the gut.
A research team led by Declan F. McCole, a biomedical scientist and IBD expert at the University of California, Riverside, reports in their mouse study that reduced activity of the IBD risk gene PTPN2 in intestinal epithelial cells can lead to a decrease in the production of Paneth cell antimicrobial peptides.
The study, published in the journal Cellular and Molecular Gastroenterology and Hepatology, establishes a critical link between PTPN2 and Paneth cells that plays a major role in maintaining normal gut microbe properties.
“This study develops our focus on improving personalized medicine approaches in IBD by understanding how patients with variants in the PTPN2 gene develop IBD,” said McCole, a professor of biomedical sciences in the School of Medicine. “Loss of PTPN2 can lead also to selective loss of Paneth cells in the intestinal epithelium. This loss of PTPN2 causes significant changes in the gut microbiota and increases a particular E. coli.”
Escherichia coli, or E. coli, are bacteria found in the environment, foods, and intestines of people and animals. McCole explained that the E. coli in question, the adherent-invasive E. coli, or AIEC, is increased in IBD and worsens inflammation. First identified in Crohn’s disease patients, AIEC can adhere to and invade epithelial cells as well as immune cells called macrophages.
“AIEC are the strongest candidate for a causal role for bacteria in IBD,” he said.
According to McCole, Paneth cells do not function properly in many patients living with IBD, and this can serve as a marker of disease. The antimicrobial peptides these cells produce are crucially relevant to the intestine’s protective barrier for regulating the relative proportions of bacteria and their interactions with each other. They also help neighboring intestinal stem cells function better.
“We know that in IBD, Paneth cells are often unable to produce sufficient antimicrobial peptides or respond appropriately to gut bacteria,” McCole said. “These functional defects can also be associated with changes in the structure of Paneth cells that reduce their ability to secrete the protective antimicrobial peptides, leading to increases in the populations of bacteria associated with IBD, such as AIEC. These structural changes in the appearance of Paneth cells can also serve as a marker of disease in IBD, especially Crohn’s disease.”
McCole was joined in the study by Vinicius Canale, Marianne R. Spalinger, Rocio Alvarez, Anica Sayoc-Becerra, Golshid Sanati, Salomon Manz, Pritha Chatterjee, Alina N. Santos, Hillmin Lei, Sharon Jahng, Timothy Chu, and Ali Shawki of UCR; Elaine Hanson and Lars Eckmann of UC San Diego; and André J. Ouellette of the University of Southern California.
The study was supported by the Crohn’s and Colitis Foundation; Swiss National Science Foundation; American Gastroenterological Association; Science Without Borders Program; and California Institute of Regenerative Medicine.
“This work sets the foundation for our new research project that will identify pharmacologic agents capable of rescuing Paneth cell function and reducing the contributions of microbes to intestinal inflammation,” McCole said.
0 notes
Text
Gary Null’s Show Notes
04 03 23
If you listen to Gary’s show, you know that he begins with the latest findings in natural approaches to health and nutrition. Starting this week, we will make some of those findings available each weekday to subscribers to the Gary Null Newsletter.
Exercise has a direct role in fighting breast cancer
L-citrulline may enhance time trial performance for cyclists: Kyowa study
Too much salt could potentially contribute to liver damage
Monday Recipe
Exercise has a direct role in fighting breast cancer
Texas A&M University, March 6, 2023
While it is generally accepted that exercise can benefit a person's overall health, a recently published paper has found a direct link between muscle contraction and a reduction in breast cancer.
In the paper, published in the journal Frontiers in Physiology, a team of Texas A&M researchers concludes that a currently unspecified factor released during exercise suppresses signaling within breast cancer cells, which reduces tumor growth and can even kill the cancerous cells.
"For this study, we took a deeper look into the relationship between people who exercise more and have less of a risk of cancer; previously, it was believed that there wasn't anything mechanistically linked. Rather, it was just the general benefits seen in your body because of a healthy lifestyle," said Amanda Davis, first author on the paper and a clinical assistant professor at the Texas A&M School of Veterinary Medicine & Biomedical Sciences (VMBS). "These data are exciting because they show that during muscle contraction, the muscle is actually releasing some factors that kill, or at least decrease the growth of, neoplastic (abnormal, often cancerous) cells."
The researchers also found that the factors inherently reside in muscle and are released into the bloodstream no matter what a person's usual activity level is or how developed their muscles are.
"Our results suggest that whether you consistently exercise or you just get up and walk when you're not used to working out, these factors are still being released from the muscle," Davis said. "Even simple forms of muscle contraction, whether it be going on a walk or getting up to dance to your favorite song, may play a role in fighting breast cancer.
"The big message is to get up and move," she continued. "You don't have to be an Olympic-level athlete for these beneficial effects to occur during muscle contraction; being physically fit doesn't make you more likely to release this substance."
Based upon the study results, her general advice for promoting the release of the factors is to follow the protocols recommended by the American College of Sports Medicine—namely, 30 minutes a day of moderate intensity exercise for at least five days a week. This could include brisk walking, dancing or biking, according to the American Heart Association.
Regular exercise could not only lead to disrupted communication in the cancerous cells to stop their growth, but the factors released by exercise may also play a role in preventing breast cancer's development in the first place.
"The decreased risk of breast cancer with exercise comes from the idea that if you have pre-neoplastic cells and you're exercising a lot and slowing their growth, maybe those precancerous cells can be destroyed by the body before they start taking over," Davis said.Further studies are being conducted to determine the exact identity of the factors being released by muscle. Davis suggests that they could be peptides called myokines released by muscle fibers, and researchers currently in the Department of Kinesiology at Texas A&M are looking into the possibility of the factors being microRNAs or other novel molecules.
L-citrulline may enhance time trial performance for cyclists: Kyowa study
Kyowa Hakko and Kitasato Universities (Japan), March 4, 2023
Supplementation with the amino acid L-citrulline may reduce time trial completion times by about 10 seconds, says a new study from Kyowa Hakko.
The amino acid L-citrulline is said to play an important role in nitric oxide (NO) metabolism and regulation. L-Citrulline is converted to L-Arginine in the body to support L-Arginine and NO levels. Increased production of NO promotes vascular dilation which improves oxygen and blood circulation throughout the body.
New data published in the Journal of the International Society of Sports Nutrition indicated that daily L-citrulline intake for seven days boosted L-citrulline and L-arginine levels and enhanced performance in a time trial.
Researchers from Kyowa Hakko and Kitasato University also report significant improvements in the feelings of muscle fatigue, and concentration, right after the time trial for people consuming L-citrulline.
Danielle Citrolo, Pharm.D, stated "In this study an increased arginine level from oral supplementation with L-citrulline showed a reduction in completion time by 1.5% a valuable decrease for those trained athletes that are participating in long distance cycling exercise. Not only did it improve performance, but the subjects reported feeling less muscle fatigue and an improved concentration using L-citrulline."
Results showed that, compared with placebo, men taking the L-citrulline supplements finished the time trial an average of 9 seconds faster.
In addition, power output was found to be 2% greater in the L- citrulline group, but there were no significant differences in VO2 response between the groups.
Finally, subjective feelings of muscle fatigue and concentration were also significantly improved immediately after exercise for men taking the L-citrulline supplements, compared with the placebo group.
Too much salt could potentially contribute to liver damage
American Chemical Society, February 28, 2023
A sprinkle of salt can bring out the flavor of just about any dish. However, it's well known that too much can lead to high blood pressure, a potentially dangerous condition if left untreated. Now scientists report a new animal study that found a high-salt diet might also contribute to liver damage in adults and developing embryos. It appears in ACS' Journal of Agricultural and Food Chemistry.
Our bodies need a small amount of salt -- the U.S. government recommends one teaspoon per day if you are a healthy adult. Among other functions, the sodium ions from the savory mineral help regulate water movement within the body and conduct nerve impulses. But most Americans eat too much salt. Some research indicates that in addition to high blood pressure, overconsumption of sodium can damage the liver. Xuesong Yang and colleagues wanted to explore the potential effect at a cellular level.
The researchers gave adult mice a high-salt diet and exposed chick embryos to a briny environment. Excessive sodium was associated with a number of changes in the animals' livers, including oddly shaped cells, an increase in cell death and a decrease in cell proliferation, which can contribute to the development of fibrosis. On a positive note, the researchers did find that treating damaged cells with vitamin C appeared to partially counter the ill effects of excess salt.
Monday Recipe
About Gary Null
An internationally renowned expert in the field of health and nutrition, Gary Null, Ph.D is the author of over 70 best-selling books on healthy living and the director of over 100 critically acclaimed full-feature documentary films on natural health, self-empowerment and the environment. He is the host of ‘The Progressive Commentary Hour” and “The Gary Null Show”, the country’s longest running nationally syndicated health radio talk show which can be heard daily on here on the Progressive Radio Network.
Throughout his career, Gary Null has made hundreds of radio and television broadcasts throughout the country as an environmentalist, consumer advocate, investigative reporter and nutrition educator. More than 28 different Gary Null television specials have appeared on PBS stations throughout the nation, inspiring and motivating millions of viewers. He originated and completed more than one hundred major investigations on health issues resulting in the use of material by 20/20 and 60 Minutes. Dr. Null started this network to provide his followers with a media outlet for health and advocacy. For more of Dr. Null’s Work visit the Gary Null’s Work Section or Blog.GaryNull.com In addition to the Progressive Radio Network, Dr. Null has a full line of all-natural home and healthcare products that can be purchased at his Online Store.
Find articles, videos, back radio broadcasts, books, and more at GaryNull.com.
https://garynull.com
Find Gary's vitamins and other supplements at Gary's Vitamin Closet.
https://www.garysvitamincloset.com
Hear Gary's radio show weekdays at noon Eastern Time on PRN.live
Disclaimer
While we have thoroughly researched the information we provide, and indicate its sources, information in this Gary Null Newsletter, and all Gary Null Newsletters, is for educational and informational purposes only, and is not intended to diagnose, treat, cure or prevent any disease or other condition. Consult your medical professional before choosing any treatment or course of action. Gary Null Newsletters are not liable for risks or issues associated with using or acting upon the information it provides.
Let us know what you would like to see in Gary's newsletter. Email us at [email protected]
If you are not subscribed, go to: https://garynull.substack.com to subscribe.
0 notes
Text
Home-Based Mirror Therapy with Individual Set of Exercises Improves Phantom Limb Pain and Phantom Limb Sensation of Lower Extremity Amputees

Home-Based Mirror Therapy with Individual Set of Exercises Improves Phantom Limb Pain and Phantom Limb Sensation of Lower Extremity Amputees in Biomedical Journal of Scientific & Technical Research
https://biomedres.us/fulltexts/BJSTR.MS.ID.005967.php
Lower limb amputation could be the final decision to solve uncurable disorders due to trauma, infection and other general diseases [1,2]. However, the amputees might suffer lasting phantom limb phenomenon (PLPh) (including phantom limb pain (PLP) and phantom limb sensation PLS [3]) with many negative impacts on their life such as the increasing demand of pain killer, depression and impairment of daily activities and social functions [4]. The rate of PLPh is about 85% [5,6]. A study found that more than 50% of patients with PLP suffered daily pain with the significant intensity rated from moderate to severe [7]. The treatment mainly includes three main groups: pharmacology, non-pharmacology and surgery. Each approach has its own advantages and disadvantages relating to complications and cost benefit. Recently, mirror therapy is emerging and considered as a safe, economic and effective procedure in treatment of PLPh [9-11], although it was first used by Ramachandran VS in 1996 [8].
For more articles in Journals on Biomedical Sciences click here bjstr
Follow on Twitter : https://twitter.com/Biomedres01
Follow on Blogger :https://biomedres01.blogspot.com/
Like Our Pins On :https://www.pinterest.com/biomedres/
#American Medical Journal#medical and medicinal journal#Journal on Medical Genetics#journal of biomedical research and review#open access journals of biomedical science
0 notes
Text
Biomed Grid | Assessment of Brain Metabolic Score (BMS) In Vivo Based on Mitochondrial Activity in Neuropathology
Introduction
The discovery of oxygen occurred toward the end of the 18th Century (1771-1775) by three scientists including Carl Wilhelm Scheele, Joseph Priestley and Antoine de Lavoisier. It took more than 100 years to discover the intracellular organelle, named mitochondrion by Carl Benda in 1898 [1], that utilized 90-95% of the oxygen taken up and consumed by the body of patients as summarized by Waltemath in 1970 [2].
The aim of the current review is to describe the historical R&D process of using light in order to study brain biochemical and physiological activities. I will deal with the function and regulation of oxygen in supplying energy to this unique central organ of the body. The relationship between the activities of the brain and using optical technologies are presented in (Figure 1). Most of the information on mitochondrial function has been collected using in vitro studies. Small portion of publications dealt with monitoring in vivo of brain mitochondrial function in real-time. Prof. Britton Chance was the leader in the field of using the light, seen in (Figure 1) in studying mitochondrial function (Figure 1) especially the brain under in vivo conditions. The study of mitochondrial function in vivo was expanded later by our group that developed the multiparametric monitoring system used as seen in (Figure 1) [3, 4, 5]
Historical Overview
The functional capacity of any tissue, and especially the brain, is related to its ability to perform its work. The assessment of this ability could be done by checking tissue oxygen balance, i.e. the ratio of oxygen supply to demand. As seen in (Figure 2) a similar description was made by Barcroft 105 years ago [6].
He showed the relationship between tissue activity, oxygen consumption as well as increase in blood supply serving as a compensation mechanism. This observation that was published in 1914 was and is supported by many studies published since then. Presentation of the balance between tissue oxygen supply and demand in a typical organ is shown in (Figure 2). Oxygen supply is dependent upon the microcirculatory blood flow (TBF), blood volume (TBV) and the hemoglobin saturation level (HbO2) in the small blood vessels, namely, the microcirculation. The saturation of the hemoglobin in the microcirculation is affected by 2 factors, namely, oxygen consumption by the mitochondria and the microcirculatory blood flow. The demand for oxygen is affected by the specific activities taking place in each organ as seen in the right side of the figure. The mitochondrial NADH (the reduced form) level is a parameter directly related to the oxygen balance.
Figure 1: The story of brain bio-photonics. A - Citation regarding the creation of light. B - The use of the UV part of the spectrum as a tool for the monitoring of mitochondrial function (C). D - Schematics of the elements that represent part of the brain tissue seen in part E.
Figure 2: The “hypothesis” formulated by Barcroft in 1914 regarding the connection between organ activity, oxygen consumption and blood flow (6). B - Presentation of tissue oxygen balance related to the energy supply and demand. Oxygen supply could be evaluated by measurement of tissue blood flow (TBF), blood volume (TBV) and hemoglobin saturation (HbO2). Oxygen demand varies between different tissues and include Ionic Homeostasis, Signal Conduction, Glandular Secretion, Muscle Contraction, and G-I tract and kidney function. Mitochondrial NADH serve as an indicator for tissue oxygen balance (16).
(Figure 3) shows the gradient of oxygen levels between air inspired to the lungs, heart, large arteries and small arterioles to the brain intracellular compartment and finally the mitochondria. The various points of patients’ clinical monitoring are shown. As seen the largest gradient of oxygen occur between the oxygen level in the large arteries and the microcirculation. The delivery of oxygen is done in the microcirculation, therefore the level of oxygen in large arteries is very high (about 100 mmHg). The last usual parameter, in the oxygen gradient, that is monitored clinically is the pulse oximeter that measures the saturation of hemoglobin in the systemic arteries. At this point the HbO2 is highly saturated as indicated in point 1 at part A of the figure. The saturation of the HbO2 at the microcirculation is depending on the organ that is evaluated. In the brain, heart or kidney (very active organs), the saturation will be in the range of 50%-60% and in the resting muscle it will be around 80%. Monitoring of the microcirculation and especially mitochondrial function in vivo is not a standard approach in daily clinical activities.
Figure 3: The gradient of O2 from air to the mitochondria in nervous system. Monitoring of patients include various parameters along the oxygen gradient (96). In the insert A, the dissociation curve of O2 and hemoglobin is presented.
The historical milestones in the development of mitochondrial NADH monitoring after its discovery in 1906 by Harden and Young are listed in (Table 1). Most of the milestones were achieved by Prof. Chance. The collaboration with the physiologist, Prof. Jobsis, led to many studies where various organs in vitro or in vivo were monitored. Most of the studies published in this field were expanded by the team working with Prof. Chance in Philadelphia and then moved to other universities around the world.
Table 1: The main Milestones in NADH Measurements.
(Figure 4) shows the pictures of the 5 scientists who affected significantly the development of the theoretical and experimental technology for the monitoring of mitochondrial NADH function in vitro and in vivo.
Figure 4: The scientists contributed significantly to our knowledge on mitochondrial function and NADH monitoring under in vitro and in vivo conditions.
Figure 5: A - Mitochondrial metabolic state, defined in vitro, by Chance and Williams, and opened up a new era in measurements of respiratory chain enzyme’s redox state in vitro as well as in vivo (43). B - The fluorescence emission spectrum showing the difference between an anaerobic an d an aerobic suspension of liver mitochondria) .The excitation wavelenght was 353nm (97). C - The emission spectra of rat cerebral cortex under aerobic conditions (lower trace) and under anoxic conditions (upper trace) (98).
It is now more than 60 years since the pioneering work of Chance & Williams on mitochondrial metabolic state in vitro shown in (Figure 5), was published [7, 8, 9, 10]. Harden & Young described the pyridine nucleotides almost 110 years ago [11, 12] followed by the description of its full structure by Warburg and collaborators 30 years later [13]. All those studies initiated the first detailed experiments, by Chance et al. [14], in which NADH (Nicotine amide adenine dinucleotide) fluorescence, was used as a marker of mitochondrial function of the brain and kidney in vivo in the anesthetized animals.
Principles of Monitoring NADH Fluorescence
Monitoring of NADH by the difference in the absorption spectrum of its reduced form, led to a limitation of that technique to the study of mitochondria in vitro, and in very thin tissue samples (e.g. muscle) or in cell suspension. More specific and better method is fluorescence spectrophotometry in the near-ultraviolet range (UVA).
The discovery of the optical properties of reduced Nicotineamide Adenine Dinucleotide – NADH (earlier names: DPNH - diphosphopyridine nucleotide, or PN - pyridine nucleotide), led to an intensive research activity since the early 1950’s. The reduced form of this molecule, NADH, shown in Figure 6A1 & 6A2 [15], absorbs light at 320-380 nm (Figure 6) and emits fluorescent light at 420-480 nm range (Figure 6) [16]. The oxidized form NAD+ does not absorb light in the UV range, therefore it was possible to measure the redox state of the mitochondria by monitoring the UV absorbance or Blue fluorescence of NADH. (Figure 6) present NADH fluorescence spectra monitored from the brain of anesthetized rat exposed to anoxia as described in detail [17].
Figure 6: A. The structures of NAD+. The nicotinamide group (broken ring) is the “functional” part of both molecules (A1) i.e. the portion of the molecules where oxidation and reduction take place (15,99). A2. The transition between oxidized and reduced NADH. A3. Excitation and emission spectra of NADH (16). B. Emission spectra of the brain under excitation of 366 nm light (A1, B2, B1, B2, and C1) or laser 324 nm light (C2). C1 and C2 were measured from a dead brain (23).
Figure 7: A. Apparatus for measurement of “fluorescence spectra”. The wavelength drum was driven by a synchronous motor. A sectioned disc d, mounted on another synchronous motor, modulated the incident light. The a.c. component of the current, caused by the light falling on the iP 21 multiplier, was amplified, rectified and fed into the recorder. B. Fluorescence spectra of NADH. The open circles are for excitation by wavelength 313 mμ, the black ones for excitation by 366 mμ. The spectrum for 313 mμ has been multiplied by a certain factor to make its maximum of equal height as the maximum of the spectrum excited by 366 mμ. The spectra appear to be identical; the maximum is at about 462 mμ (22).
The first model of fluorescence recorder was described by Theorell & Nygaard [18, 19] and Theorell, Nygaard and Bonnichsen [20]. Boyer & Theorell in 1956 showed that the fluorescence of DPNH was shifted and the intensity was increased upon combination of DPNH and liver alcohol dehydrogenase-ADH [21]. The 1st study using fluorescence spectrophotometry of NADH in intact Baker’s yeast cells and Algae cells, was published in 1957 [22] as seen in (Figure 7) .
The features of NADH fluorometers consist of the 4 components:
a. A light source (including appropriate filters).
b. An optical path to the monitored object and back to the detection unit.
c. Signal detection and processing units.
d. Signal recording and data storage units.
In our 1984 review, we specified the light-guide-based fluorometry used in our studies [23]. Ince et al. [24], included many other technical aspects of the methodology in their review. Duysens & Amez [22] schematized the first fluorescence spectrophotometer used for intact cells. They utilized the “classical” light source – the mercury arc – providing a very strong band at 366 nm, even though not at the maximal NADH absorption peak of NADH (340 nm). Using a monochromator, they were able to obtain the NADH fluorescence spectrum in baker’s yeast cells and photosynthesizing cells. They concluded that “the fluorescence excited by 366 nm can be used for measuring reduced pyridine nucleotide in vivo”.
Chance & Legallais [25] described a differential fluorometer that opened a new era in monitoring NADH fluorescence in vivo. They used a microscope, serving as the fluorometer basis, with two light sources: tungsten and mercury lamps with appropriate filters. Chance & Jobsis [26] and Chance [27] showed that mechanical muscle activity ends up with NADH oxidation measured in excised muscle. This study was the bridge from the subcellular (mitochondria) and cellular (intact cell) monitoring approaches toward actual in vivo applications.
Figure 8: 1 - Microspectrofluorometer developed and used in the 1960’s. In addition to the interference filter, a Wratten type 2C filter is also placed in the back aperture of the objective. The wave-length-range of the interference filter is 400-700 mμ, and the specification on its spectra interval is 30-40 mμ. Other features of the high pressure mercury arc excite the fluorescence of the specimen at 366 mμ by means of an ‘Eppendorf’ primary filter. Fluorescence excitation and emission pass through the Leitz Ultrapak objective and a ocular (98). 2 – Experimental setup for microfluorometry of brain and kidney cortex in the rat measured simultaneous. Two microfluorometers were focused on the exposed surfaces of the 2 organs. The oxidation-reduction level of the intracellular pyridine nucleotide was altered by changes in ventilation and the corresponding fluorescence changes was recorded by the two microfluorometers. For the kidney fluorometer, the water-cooled lamp housing attached to the Leitz “Ultrapak” illumination system is shown. 3 –Recordings of the kinetics of increases in fluorescence observed in oxygennitrogen transition for kidney (A) and brain (B) cortex of anesthetized rats. The increases in fluorescence are recorded as a downward deflection. The times when gas in the tracheal cannula was changed from oxygen to nitrogen and the times when breathing stopped and started again are indicated.
The in vivo NADH monitoring system was introduced during in the late 1950’s and early 1960’s. The effects of scattered light and tissue absorption due to blood were not evaluated or measured when NADH fluorescence was measured. The first results of in vivo NADH fluorescence measurements appeared in 1962 [14]. These “classical” papers described two microfluorometers that were modifications of previous designs [25, 28]. This micro fluorometer (Figure 8) type employed Leitz “Ultrapack” illumination, which had been used for many years until the development of UV transmitting optical fibers. To avoid movement artifacts, rats were deeply anesthetized, and their heads were fixated in a special holder on the operation table. The same instrumentation was used in other in vivo studies, including those of Chance’s group and other investigators cited in a previous review [17].
The effect of blood on NADH fluorescence was discussed early by Chance et al. [14]. In order to monitor NADH in vivo, it was necessary to avoid large blood vessels in the monitored area which interfere with the emission and excitation light. The monitoring of a second parameter in tissue fluorometry in vivo was reported in 1963 [29]. It was shown that “changes due to the deoxygenation of oxyhemaglobin do not interfere with measurement of the time course of fluorescence changes in the tissue studies”. The addition of a second monitoring signal, namely, tissue reflectance at the excitation wavelength was reported in 1968 [30]. It was based on a previous model described by Jobsis et al. in 1966 [31]. In another two papers [32, 33] , the measurement of 366 nm reflectance was used for the correction of the NADH fluorescence signal from the brain. The reflectance signal was subtracted from the fluorescence signal. The same type of fluorometer was used in by Gyulai et al. [34].
In studies of the cerebral cortex the skull was removed carefully in order to minimize bleeding; about 25 square millimeters of the cortex was exposed. The dura was left intact. The head was held similarly to that used in stereotaxic studies of the brain and was kept sufficiently motionless for continued observation of a small area between major blood vessels. In a few studies, measurements were made simultaneously on the cortex of the brain and on the kidney by means of two independent microfluorometers. In such cases the kidney was held in a clamp on the back of the animal. The apparatus is seen in Figure 8-1 & 8-2.
Areas of the brain and kidney were selected which showed a bright and uniform distribution of fluorescent material. Areas containing large blood vessels were avoided. On the brain cortex a field was selected in which the number of visible capillaries was minimal. Since continuous viewing is possible during photoelectric measurement of the fluorescence, these positions were monitored to make sure that mechanical artifacts were avoided. Figure 8A (lower left side) show the response of the kidney. The increase in fluorescence observed at the time respiration ceases is 11 percent of the total increase during anoxia. As soon as a plateau is reached, the lungs are ventilated with oxygen three times. Three seconds after ventilation is ended an abrupt decrease in fluorescence is observed and breathing starts as the decrease reaches its peak. Irregularities in the extent of oxidation in the fluorescence signal are observed for the next 0.5 minute, but the fluorescence remains above the initial value for 2½ minutes.
A Figure 8B illustrates the response of the brain cortex. No fluorescence changes are observed for 30 seconds after the inspired gas is changed from oxygen to nitrogen. A small but consistently observed diminution of fluorescence occurs, and 10 seconds thereafter hyperventilation was observed. After a plateau is established, ventilation with oxygen is commenced, and 3 seconds thereafter an abrupt decrease in fluorescence reaches its plateau, breathing commences.
These results indicate that similar fluorescence changes under anoxia in vivo, were observed in excised slices, and in isolated mitochondria.
Fiber Optic based Fluorometer/Reflectometer
A flexible means was needed to connect the tested brain to the fluorometer in order to monitor of Brain NADH fluorescence in intact anesthetized or unanesthetized animals. This happened in 1972, when UV transmitting quartz fibers became available (Schott Jena Glass, Germany). The light-guide-based fluorometer for in vivo monitoring of the brain [35, 36] subjected to anoxia or cortical spreading depression was developed and used.
Laboratory device
The development of light-guide-based fluorometry-reflectometry is shown in (Figure 9). The original fluorometer reflectometer was based on the time-sharing principle (Figure 9). Four filters were placed in front of a 2 arms light guide. Filters 1 and 3 enabled the measurement of NADH fluorescence, while filters 2 and 4 were used to measure tissue 366nmreflectance. The reflectance trace was used to correct the NADH signal for possible hemodynamic artifacts, and to indicate relative changes in the blood volume of the monitored tissue.
In this system, one photomultiplier tube was used to detect the two signals namely fluorescence and reflectance. Figure 9B presents the first in vivo brain monitoring time sharing setups, connected to the brain [36]. In order to simplify the system, the time-sharing approach (AC mode) was replaced by splitting the light emitted from the tissue into two unequal fractions for the measurement of fluorescence and reflectance signals. This was achieved by using 2 photomultipliers. This device, named the DC fluorometer, contained two arms light guide probe. In the two configurations, the reflectance signal was used for the correction of the fluorescence signal (see details [17]). This model was used in studying the brain [46, 47, [48, 49, 50], the kidney [41] and the heart [42].
The responses of the rat brain to anoxia using two size diameters of the fiber optic bundle are shown in (Figure 9) . When the brain was exposed to concentrated KCl solution, repeated cycles of NADH oxidation (decreased signal) as seen in (Figure 9). The MitoViewer Another type of fluorometer/reflectometer device (MitoViewer) was developed in 2007 by - Prizmatix Ltd as seen in (Figure 10) & B.
Another type of fluorometer/reflectometer device (MitoViewer) was developed in 2007 by - Prizmatix Ltd as seen in (Figure 10) & B.
The MitoViewer
Figure 9: The time sharing fluorometer reflectometer and B - The brain of a small animal connected to this time sharing device. Ex - Excitation, Em - Emission optical fibers for the monitoring of NADH redox state. H.V. - high voltage, PM-photomultiplier. C - The effect of the monitored tissue volume (the diameter of the fiber optic probe) was tested under anoxia as shown in C upper 3 traces (2 mm diameter) and C lower 3 traces (1 mm diameter). (A+C - (23), B - (47), D - The responses of NADH fluorescence and reflectance to cortical spreading depression initiated by exposing the cortex to 0.3M KCl (39).
Figure 10: A. The MitoViewer fluorometer uses 365 nm UV LED for excitation of the NADH fluorescence (Fluor signal). This excitation wavelength is also used for the correction of hemodynamic artifacts by measuring the reflection light intensity (the Refl signal). The light is transmitted from and to the device by means of a flexible fiber optic bundle. The software displays the Reflectance, Fluorescence and the NADH corrected fluorescence signal B. The view of the MitoViewer.
System overview
The MitoViewer device comprises the following subunits:
Light Source Unit: Provides UV light at 365nm for NADH excitation and tissue reflectance measurements. Also included is a reference photodiode that enables correction of signals in cases of intensity changes of the LED during measurement.
Fiber Optic bundle: Transmits the UV light from the Light Source to the measured tissue and transmits the collected light (the reflection (Refl) and the fluorescence (Fluor) from the tissue, to the Detection Unit.
Detection Unit: Provides detection to transform the Refl and Fluor light into electrical signals which are transmitted to the electronics circuit for amplification.
Detection Unit: Provides detection to transform the Refl and Fluor light into electrical signals which are transmitted to the electronics circuit for amplification.
USB-6009 module: Provides A/D conversion for the Refl and Fluor signals and D/A conversion for control signals sent from a PC to control the function of the MitoViewer.
PC: Personal Computer controlling of the MitoViewer operation using the MitoViewer software.
Power Adaptor: Provides the DC voltage for operation of the MitoViewer.
The fiber optic probe of the MitoViewer is connected to the surface of the brain via an appropriate holder cemented to the skull with acrylic cement. Rats (200-250 grams) anesthetized and operated as discussed in our various papers cited in the attached list.
Typical responses of the brain to oxygen depletion by exposing the rat to 100% nitrogen are presented in (Figure 11) . The Fluor signal (blue) is elevated due to inhibition of the respiratory chain activity. The Refl signal (green) is decreasing, as expected under this anoxic condition, due to the elevation in blood volume in the monitored tissue. The corrected NADH (black) shows a symmetrical increase and decrease signals during the anoxic cycle. The effects of the increase in energy utilization, were induced by exposure of the brain to Cortical Spreading Depression (by high level of potassium.) as seen in (Figure 11) . Since the oxygen supply is not limited, the Fluor (blue) and the NADH (red) decreased due to the oxidation of NADH. Under this stimulation the ATP turnover was dramatically increased, and the extra oxygen supply was provided by an increase in microcirculatory blood flow (not measured in this animal). The effects of hypoxia (6% oxygen) and hyperoxia (100% oxygen) are presented in(Figure 11).
Figure 11: Typical responses to metabolic perturbations measured in the rat brain using the MitoViewer. A - Responses to Anoxia; B - Effects of cortical spreading depression; C –The effect of hypoxia (6% oxygen) and hyperoxia (100% oxygen) on the measured signals.
Animal Preparation for NADH monitoring
An operation table and probe holding device was used to perform brain as well as other body organs preparation for the measurement period. The table for the operation procedure is shown in (Figure 12). The head is connected to a special head holder for the period of the brain operation (20-30 minutes) and then could be released, for the monitoring period, as shown in (Figure 12) . If needed, the other monitored organs i.e. muscle, kidney or liver, must be held by a micromanipulator during the measurement period. The cerebral cortex was the main organ monitored by other investigators as well as in our group.
Figure 12: A –The surgical system used to prepare and measured up to 4 organs simultaneously including the brain. The same system enables to perform a craniotomy while the animal is connected to a special head holder. B+C Stages in the preparation of the rat brain for NADH monitoring. B – The location of screws needed for the fixation of the light guide holder to the skull by dental cement. C - The view of the head at the end of the operation. D - The fiber optic probe is inserted to its holder and the animal is ready for monitoring (16).
The entire protocol of the preparation of the rat is given here. Adult male Wistar rats (180–250g) were anesthetized by intraperitoneal (IP) injection of Equithesin solution (each ml contains: Pentobarbital 9.72 mg, Chloral Hydrate 42.51 mg, Propylene Glycol 44.34%, Magnesium Sulfate 21.25 mg, Alcohol 11.5% water) 0.3 ml/100g body weight. A midline incision is made in the skin in order to expose the skull. Three holes were drilled in the skull and appropriate screws were inserted to the skull as shown in (Figure 12) . The craniotomy (3-5 mm in diameter) was drilled in the right or left parietal bone for the fixation of a light guide holder. The light guide holder and the 3 screws were then fixated to the skull using acrylic cement (Figure 12) . Ten minutes later the head was released from the holder and the fiber optic probe was inserted to the appropriate depth and fixed by a set screw (Figure 12) .
From Single Parameter to Multiparameter Monitoring Approach
(Figure 13) illustrates the various experimental and clinical perturbations used in our laboratory during the last 45 years. (Table 2) lists the studies published by Mayevsky and his collaborators on brain NADH fluorescence. The papers are classified according to the type of perturbation used. In all those papers published in the period of 1973 and 1978 we monitored the mitochondrial NADH as a single parameter monitoring system. For the physiological interpretation of the changes in NADH measured in vivo, it was necessary to move from a single parameter monitoring system to the multiparametric monitoring approach) MPA).
Table 2: Classification of the papers on brain NADH monitoring published by Mayevsky et al (1973-2017).
As described in (Figure 25) the redox state of NADH represent also the balance between oxygen demand and supply. Therefore, the multiparametric monitoring system results could provide better understanding of the pathophysiological processes developed. The term “Brain physiological mapping” based on the various parameters that could be monitored in vivo using a minimally invasive techniques presented in (Figure 14)(Figure 15) [5].
Figure 13: Presentation of the various perturbations used in monitoring brain NADH fluorescence in experimental animals and patients.
Figure 14: The technology developed for real time evaluation of energy metabolism at the tissue level. Part A shows the coupling between the macro-circulation measured by Pulse oximetry and the microcirculation. B-D The main monitoring technique of cellular and intracellular compartments (16).
Figure 15: Schematic presentation of the “basic building stones” of a typical cerebral cortex tissue. During an ischemic or other 3 events shown, the sequence of the 8 early responses developed are presented in numbered circles.
The aims are to monitor, a small volume of the cerebral cortex containing all the tissue elements that are part of a typical functioning brain tissue. The interest is in the microenvironment of the brain tissue containing neurons, glial cells, synapses and the microcirculatory elements (small arterioles and capillaries). During the process we pursued the goal of being minimally invasive to the cortical tissue itself. It was obvious that the various probes could not monitor the same volume of tissue due to the size of each probe used. Therefore, we minimized the diameter of the various probes placed in the multiparametric assembly (MPA) that had a 5-6 mm contact area with the cerebral cortex. In many perturbations used, (global ischemia, anoxia, hypoxia or hemorrhage), most of the areas in the cortex will respond in the same way. The development of the MPA after the establishment of the fiber-optic-based NADH monitoring system in 1972 when the first UV transmitting fibers appeared [36]. The connection of the brain to the fluorometer via optical fibers enabled us to monitor, for the first time, the monitoring unanesthetized brain. The initial data using this technology appeared in 2 papers [35,36]. All details of the technological aspects and animal preparation appear in the original relevant publications; our approach was to develop a new upgraded version of the monitoring system and present initial preliminary results. In the next step a large well-designed study on few groups of animals were done and the data was analyzed for its statistical significance.
Responses of Brain NADH Fluorescence to various Experimental Conditions
In the current section, the effects of various experimental treatments in animal models on brain NADH will be describe in detail. It is important to note that most of the published data on NADH monitoring, have been accumulated from the cerebral cortex.
Changes of Oxygen supply in vivo
Introduction: Chance and Williams [9, 43], found that the complete depletion of O2 from the mitochondria inhibits oxidative phosphorylation terminates ATP production. This situation affects the normal function of the tissue, and cell death can ensue. We defined anoxia as a complete deprivation of O2 caused by breathing 100% N2. Under Hypoxia the deprivation of O2 from the breathing mixture is partial and ranges between 21% (normal air) and 0% (anoxia). Under Ischemia the decrease in O2 supply is due to a decrease in blood flow to the monitored organ. The level of ischemia can vary from a full absence of flow (complete ischemia) to different levels of blood flow (partial ischemia). Although oxygen deficiency is the main event in each of the three experimental conditions (anoxia, hypoxia and ischemia), other physiological factors may differ as well. For example, brain microcirculatory blood flow is decreased under ischemia, but increases under brain hypoxia. Thus, changes in the tissue due to other blood flow related factors are not identical.
Hypoxia and Anoxia: The responses to hypoxia and anoxia are very similar; therefore, they will be discussed together. According to Chance & Williams [8, 9], a shift toward State 5 in the metabolic state of the mitochondria, involves an increase in NADH proportional to a decrease in O2 supply. Figure 16A shows the response of the brain NADH to anoxia in vivo [44, 45]. At those days the fluorescence was measured and displayed without correction for hemodynamic artifacts which was developed later in time. A clear increase in NADH fluorescence was recorded under the deprivation of oxygen. Similar responses of the kidney to anoxia are presented in the lower part of A.
In 1972, we used UV transmitting optical fibers and applied the quartz fibers to the in vivo monitoring of NADH fluorescence in the brain. It was assumed that the response of NADH fluorescence to hypoxia or anoxia, induced in vivo, should be very similar to the response of isolated mitochondria that were investigated until those days.
(Figure 16) presents an interesting two responses of the brain to anoxia. NADH and the electrical activity of the brain were measured [37]. In these experiments the rats were slightly anesthetized by Equithesin. The nitrogen was applied via a nasal mask. In part B1, the duration of the anoxia was 70 sec and in part B2, 100 sec. (Figure 16)1 shows the effect of N2 on the NADH fluorescence, reflectance, EEG and blood pressure. The top trace shows the reflectance which in all animals decreases during the N2 cycle. This decrease of reflectance was in two phases. The first decrease was small (in comparison to the second one) and occurred while the animal was breathing spontaneously. A second decrease occurred after the animal stopped breathing (SB). The recovery of the reflectance to the baseline occurred about 10 min after the rat started breathing again. The second trace from the top, the fluorescence, shows a large increase in NADH fluorescence during the first phase of the N2 cycle. In order to correct for hemodynamic artifacts induced by various treatments, we used the correction technique suggested by Jobsis et al. [32, 33] and Harbig et al. [46]. The reflectance signal at 366 nm was subtracted from the fluorescence signal at 450 nm at a 1:1 ratio. The difference between the fluorescence and reflectance signals is shown in the third trace, the ‘corrected’ fluorescence. After the cessation of respiration, a large decrease in reflectance occurs; an apparent decrease in fluorescence (oxidation) is observed which is almost undetectable in the corrected trace. The small decrease shown in the corrected trace is due to imperfection of the correction factor in this special animal. After the N2 administration had been discontinued (SN), artificial respiration (AR) was applied to induce spontaneous breathing. After the animal started breathing, a fast decrease of NADH is observed in the uncorrected fluorescence as well as in the corrected fluorescence signal. The recovery of the NADH level to the baseline was very fast in comparison to the recovery of the reflectance. The EEG of both hemispheres reaches low amplitude when the NADH level reaches 80-90% of the maximum increase during the N2 cycle. The response of the two hemispheres was identical. The recovery of the EEG follows the NADH recovery to the normoxic level. (Figure 16) shows the response of the same animal to a longer N2 cycle. The animal was exposed to N2 for 100 sec. The main differences between the two cycles are that after the recovery of the NADH to the normoxic level a further decrease in NADH occurred (third trace) and at this time the EEG was depressed and recovered to normal only later. This oxidation of NADH following the N2 cycle was observed in many animals after exposure to a long N2 cycle. The pattern of changes in reflectance, fluorescence and the corrected traces were similar to those observed in the cortical spreading depression (SD) elicited by KCl as shown also in (Figure 9)(Figure 11).
Figure 16: A - Simultaneous recordings of fluorescence changes in rat brain and kidney in the same cycle of anoxia. Fluorescence increases are indicated in a downward direction (45). B1+B2 - The effects of anoxia on brain NADH fluorescence, 366 nm reflectance, EEG, and blood pressure. SB, the animal stopped breathing; SN, stop nitrogen; AR, short artificial respiration (37).
(Figure 17) shows the responses of a dog/puppy brain to graded hypoxia (A-C) and to brain anoxia (D) [17]. As seen, the changes in the corrected fluorescence signals (CF), which represent the NADH redox state, were inversely correlated to the decrease in FiO2 levels (from 6% to 0% O2). In four records, the intensity of the decrease in the reflectance trace was also correlated with the level of hypoxia.
Figure 17: A - Simultaneous recordings of fluorescence changes in rat brain and kidney in the same cycle of anoxia. Fluorescence increases are indicated in a downward direction (45). B1+B2 - The effects of anoxia on brain NADH fluorescence, 366 nm reflectance, EEG, and blood pressure. SB, the animal stopped breathing; SN, stop nitrogen; AR, short artificial respiration (37).
The correlation between the NADH fluorescence and the FiO2 levels are presented in (Figure 17) . It was found that the FiO2 had a significant effect on the NADH redox state (F = 113.6, df = 6, p < 0.0001). However, age did not significantly affect the NADH response (F = 0.25, df = 4, p < 0.91). The NADH response of the puppies to various oxygen concentrations could be divided into four levels of hypoxia which are statistically different from each other:
In order to understand better the response of the mitochondrial NADH to anoxia/hypoxia it was necessary to monitor more physiological parameters from the same brain simultaneously. The results obtained when the multiparametric monitoring system was used are presented in (Figure 18) . The effects of complete deprivation of oxygen (anoxia) on the brain were detected when the animal was exposed to hypoxia as shown in Figure 18B [23]. The rat was exposed to 10%, 5% or to 100% N2. The decrease in oxygen supply resulted in a gradual decrease in brain pO2, as well as in an increase in NADH. The ECoG showed a clear response only to 100% N2. This response corresponded to a slight increase in extracellular K+.
Figure 18: A – The Multiprobe Assembly (MPA) used in hyperbaric chamber. The relative location of various probes above brain are in the lower part of A. Ref, reference; Ag-AgCl electrode; f, refill tube for Ref or DC electrode; c, Lucite cannula; s, Plexiglas sleeve; L, light guide; h, cable holder; Ek, K+ electrode; DCk, DCL, Ag-AgCl electrode; PO2, O2 electrode; ECoG, electrocorticography electrode (91). B - The effects of hypoxia (10% O2, 5% O2) and anoxia (100% N2) on the metabolic, ionic and electrical activities of the rat brain. In this animal the oxygenation of the brain responses to breathing air as compared to 95% O2 are shown (23).
Partial and complete Ischemia: Under partial or complete ischemia, blood flow to the monitored organ is decreased and, as a result, O2 delivery is limited or even abolished. The use of ischemia in animal models provides information relevant to clinical situations such as brain stroke. The primary factor starting the pathological state is the decrease in O2 supply, making the tissue energy balance negative.,
In the early 1960’s, Chance [45] tested the effect of irreversible ischemia on brain NADH using the decapitation model. As shown in (Figure 19), about 8 secs were required between the start of NAD reduction and the attainment of half-maximal reduction. In an attempt to observe the time for NAD reduction in ischemia, we have employed a decapitation technique with the mouse; the optical system is arranged so that the slight mechanical artifact occurring on decapitation would not disturb the fluorescence excitation.
Using the fiber optic based fluorometer, we measured, in 1976, the effect of decapitation on NADH and ECoG in the awake rat and typical response is shown in (Figure 19) [47].
Figure 19: A. Fluorescence changes of the mouse brain cortex in ischemia caused by decapitation. (45). B – Metabolic, reflected-light and electrical responses to decapitation (measured bilaterally). The upper four traces were measured from the right hemisphere and the lower four from the left hemisphere. R = reflectance; F = fluorescence; CF = corrected fluorescence (F –R); ECoG = electrocorticogram.
Later, we tested the effects of age on NADH redox state in the awake and anesthetized rat exposed to decapitation [48]. The NADH was monitored from the two hemispheres of the rat brain. Here we are presenting the four upper traces that were measured from the right hemisphere. The differences in the responses between the two hemispheres were insignificant in most cases. The 366 nm reflected light (R) shows a very small initial response to the decapitation (Figure 19) . However, a very large secondary reflectance increase was recorded
1-2 min after ECoG = 0 when NADH reached its maximal level. The uncorrected (F) and corrected (CF) 450 nm fluorescence signals were like those described previously. In order to analyze the effects of age on the responses to decapitation, various parameters were measured and calculated from the analog signals, as shown in Figure 19B.
The definitions for the various parameters are as follows:
T0 = Time (sec) when electrical activity was very low and close to 0.
T1 = Interval between decapitation and the point when corrected fluorescence started increasing.
T2 = Time when the maximum level of NADH was reached after decapitation.
T3 = Time when NADH reached a level which is half of its maximum increase (CFmax/2).
T4 = Time when a large increase of the reflectance was measured (SRI = secondary reflectance increase).
CFmax = Maximum percentage increase of NADH above baseline after decapitation.
CFo = Percentage increase of NADH above baseline when ECoG = 0.
= Percentage of NADH increase when ECoG = 0 in proportion to the maximum increase measured in the same rat.
CFN2 = Percentage increase of NADH above baseline in nitrogen environment (anoxia).
The same type of data analysis could be used in other models of ischemia such as blood vessel reversible occlusion. It was clear that under severe ischemia a hemodynamic response was measured after reaching the maximal level of NADH. We named it “Secondary Reflectance Increase” (SRI), which appears at time T4 shown in Figure 19B.
In the late 1980’s a new technique enables the monitoring of microcirculatory blood flow (laser Doppler flowmetry) was incorporated into our MPA monitoring system as seen in Figure 20A [49].
Figure 20: A - The experimental setup used. LG - Light guide for the monitoring the NADH redox state and CBF (LDF), ECoG - Electro Corticography electrodes, K, Ca, - Minielectrodes for Potassium and Calcium monitoring, To - Thermistor probe, DC - DC steady potential electrodes, DA - Dental acrylic cement, Ref - Reference electrode, KCI - cannula for KCI application. ), Ex, Em - Excitation and Emission fibers of the fluorometer, LDin, LDout - Fibers connected to the Laser Doppler flowmeter, C - Plexiglass probe holder, h - connectors holder, s - Plexiglass sleeve, f - feeling tube of reference electrode. B - The effects of unilateral (Roccl) and bilateral (Loccl) carotid occlusion on the metabolic, hemodynamic, ionic and electrical activities in the gerbil brain. R 366 nm reflectance F -450 nm fluorescence CF -NADH corrected fluorescence, LDF LDvol LDvel - Laser Doppler flow, volume and velocity. K+e(1), K+e(2), Ca2+e - Extracellular potassium and calcium electrodes. DCK+l DCK+2, DCCa2+ - DC steady potential measured concentric to the three electrodes, ECoG – Electrocorticogram (49).
(Figure 20) shows typical responses to unilateral (ROCCl) and bilateral (LOCCl) in CBF (LDF) and an increase in NADH levels (CF). During the period of ischemia, accumulation of K+ in the extracellular space was recorded (K1+, K2+) but the DC steady potential and the Ca2+ levels remained unchanged during the occlusion period. The ECoG reached the isoelectric level very soon after the second occlusion. During the reopening of the carotid arteries a fast reperfusion was recorded together with the oxidation of NADH. A spontaneous wave of SD was developed during the recovery phase, characterized by a large increase in K+e and a decrease in Ca2+e together with a negative shift in the DC steady potential. During the recovery from the SD wave a large increase in CBF (300%) was recorded accompanied by an oxidation wave of the NADH.
Hyperoxia (increase in FiO2): In order to expose an organ in vivo to elevated oxygenation
hyperoxia, it is possible to use one of the two options:
a. Normobaric hyperoxia the animal breathes elevated FiO2, between 21% O2 to 100% O2 at atmospheric pressure.
b. Hyperbaric hyperoxia (HBO) A hyperbaric chamber, in which oxygen pressure is elevated while the animal is located in the chamber, was used.
Providing animals or man with elevated oxygen will lead to the development of “oxygen toxicity.” The development of this toxic event is inversely proportional to the level of oxygenation, namely the higher the pO2, the shorter the time. Providing more O2 may be beneficial in conditions such as carbon monoxide toxicity, body oxygenation pathology. Therefore, it became necessary to understand the relationship between the level of oxygenation and the function of the mitochondria in vivo. Chance and collaborators [50, 51, [52, 53, 54] developed the setup that enabled the exposure of various types of mitochondria or the entire small animal to the hyperbaric chamber. They found that the NADH of the brain, liver and kidney became more oxidized under hyperbaric oxygenation, and this effect was correlated with a decrease in NADH measured by biochemical analysis of fixed tissue. Figure 21A shows the system that enabled the monitoring of NADH under in vitro or in vivo exposure to hyperbaric oxygenation. This technique was used also when various organs of the rat were exposed in vivo to HBO as seen in (Figure 21) [52].
Figure 21: A - Apparatus for the fluorometric measurement of changes in NADH redox state in the organs of an anesthetized rat. The fluorometer components are mounted on the top of the window of the hyperbaric chamber. The compensating photomultiplier is show in the left, center is the excitation lamp, and right is the measuring photomultiplier (52). B - Responses of rat liver to repetitive compression and decompression with oxygen. The sensitivity for measuring fluorescence changes is also indicated (52).
Rat Liver in vivo. As found previously, the fluorescence of reduced NADH observed at the surface of the rat liver decreased at high oxygen pressures. In further support of No distinctive plateau in the relationship between fluorescence decrease and oxygen pressure was observed up to oxygen pressures of 10 atm. When pressurization was rapid, the tank artifact mentioned earlier became apparent and was followed by the slower biochemical response of the liver. More satisfactory results were obtained with pressurization through a needle valve. With this method of pressurization, the oxidation of the nucleotides appeared to “keep pace” with the increase in pressure, so that little further effect was observed after final pressure was reached.
(Figure 21) demonstrates that the cycle of oxidation of the pyridine nucleotides is reversible and can be repeated. This pressurization technique was used in later experiments where the effects of uncoupling agents or amobarbital on the hyperbaric response were studied. Depending upon the susceptibility of the animal to irreversible oxygen poisoning and the final pressure of the exposure, two to four such reversible cycles can be obtained. Analyses of results for 14 animals in which such compression cycles were obtained gave decreases of 13±1% of the initial fluorescence level at pressures of 120-150 psi. The response to anoxia in rat livers, also shown in (Figure 21) , was transient, and the maximum fluorescence increase was approximately 60% of the anoxic response in this preparation.
Using the light-guide-based fluorometry, we exposed an awake brain to hyperbaric oxygenation as seen in (Figure 22) .
Results recorded from the unanesthetized rat brain exposed to 75 psi (6ATA) of oxygen are shown in (Figure 22) [55]. The reflectance at 366 nm increases during the pressure elevation period, and a few minutes later a large decrease of reflectance was recorded. The third trace from the top-the corrected fluorescence – represents the difference between the fluorescence emission at 450 nm and the reflectance at 366 nm. This correction technique is now used by several investigators [36, 39, [46, 56, 57]. During the compression, an oxidation of NADH of 10% of the normoxic fluorescence level is observed, which is maintained for 15 min. A series of oxidation-reduction cycles of NADH were recorded. About ten minutes before the animal stops breathing, the NADH increased by 50-60% at the end.
The fourth and fifth traces of Figure 22B present the EEG measured from the two hemispheres. The two hemispheres of the brain respond to HBO in the same way. A few minutes after compression, the EEG changes from the typical ‘awake’ pattern to the activated pattern, and then the seizures activity appear. The number of bursts of convulsive activity differs between animals. The EEG becomes flat just before the animal stops breathing, and the increase of NADH was recorded.
A quantitative analysis of the signals was made as seen in Figure 22C including the number of convulsions and oxidation cycles. The three parameters shown in Part B left side [55] are probably connected to each other and in most conditions occurred in the same order Between 30 and 60 psi the slopes of the changes of all three parameters were very sharp, whereas between 60 and 150 they were moderate. Thus, the 60-psi pressure is a breaking point of the line. The other three parameters shown in part C right side, are affected differently by the pressure. The maximum effect was observed at 60 psi, and the curves had a bell shape. The differences between the 60-psi point and the 30- or 150-psi level are statistically significant (P<0.005), as calculated by the Student’s t test.
Figure 22: A – The Time-sharing fluorometer/reflectometer is attached to the hyperbaric chamber for the measurement of NADH from the cortex of the awake rat exposed to HBO (40). B - Effects of pressure level during hyperbaric oxygenation on hemodynamic, metabolic, and electrical activity of the brain. C - Effects of pressure level on electrical activity and its concomitant phenomena of convulsions and spreading depression (55).
Responses of NADH Fluorescence to Increase in Energy Consumption
Chance and Williams showed that the activation of the mitochondria by increased ADP is coupled with oxidation of NADH (decreased NADH levels) and is known as the State 4 – State 3 transition in isolated mitochondria [15, 31]. As shown in (Figure 2) , the demand for energy (ATP) by various tissues is dependent on the specific tasks of each organ or tissue. Nevertheless, the stimulation of mitochondrial function is common in all tissues in the body. The effects of tissue activation on NADH fluorescence under normoxic conditions as well as during limitation of O2 supply (hypoxia, ischemia) is presented.
Effects of Cortical Spreading Depression (CSD): Brain Cortical Spreading Depression [58] was
Figure 23: A - The first publication described the development of cortical spreading depression. Gradual spread of depression from A to F. Electrodes arranged as shown in the inset. A. Before stimulation L. 7 min after K. Unless otherwise mentioned, the stimuli were induction shocks at “tetanizing” frequency, applied for 3 to 5 sec. through electrodes S (58). B - Repetitive responses of the cerebral cortex to spreading depression evoked by application of 0.4 M KCI on the dura. The third trace is on an expanded amplitude scale. The arrow direction shows an increase in the optical signals. (39).
discovered by Aristides Leao in 1944 (Figure 23), After cortical electrical stimulation he recorded a wave of EEG depression propagated from the stimulation point to the rest of the hemisphere. In parallel to the EEG depression, the steady electrical potential shows a negative shift [59]. I The wave of depolarization passing through the tissue increases energy consumption [58]. In another study Leao described the effects of CSD wave on the diameter of the blood vessels on the brain surface [59]. The involvement of the microcirculation in the response to CSD was described by Van Harreveld et al few years later [60, 61]. In other studies, the The PO2 in the brain had indicated that demand for energy and oxygen consumption increased during the CSD wave [62, 63, 64]. Bures and Krivanek [65] used a special approach to check ion shift in the rat cortex and showed that extracellular potassium is elevated [66]. In the early 1970s, Vyskocil et al. used a potassium-selective microelectrode and showed clearly that extracellular K+ was elevated significantly and lead to increase in oxygen consumption [67].
When dealing with CSD and hypoxia or ischemia it is important to define the situations clearly. The discovery of the CSD event happened when rabbits’ brain was exposed to electrical stimulation in order to elicit “experimental epilepsy”. Oxygen supply to the brain was normal. Under ischemia, the EEG is also depressed as soon as the oxygen supply to the brain is limited but the mechanism behind the EEG depression is different from that operated in CSD (Figure 31).
The effects of CSD on brain mitochondrial NADH was first described in 1973, by Rosenthal and Somjen, where a clear oxidation wave was recorded [68]. In the same year [36] our team showed the same NADH oxidation response to CSD in the rat brain (Figure 09). A year later, we demonstrated the coupling between the elevated extracellular K+ induced by CSD and the NADH oxidation needed to recover the normal ionic homeostasis by the mitochondria [38]. Also, we studied in detail the nature of the NADH response to CSD as seen in (Figure 23) [39]. In order to initiate a wave of spreading depression (SD), KCl solution was passed through one of the pairs of tubes located above to the Dura mater. At threshold (~0.1 M KCl) only one wave of SD developed, while at maximum (~0.4 M KCl) many cycles were recorded. (Figure 23) represents the latter condition, in which six SD waves developed by 0.4 M KCl were terminated by washing the brain surface with 0.9% NaCl. The oxidation of NADH is corresponding to states 4-3-4 transitions and are related to the changes in energy demand during the SD cycle.
In order to show that the CSD wave recovery is dependent on the availability of oxygen another experiment performed and the results appear in (Figure 24). If energy production is in the normal range, the pumping of potassium into the cells starts immediately and its level recover back to the normal value- 3 mM. When energy production is inhibited, the pumping of K+ is inhibited, as shown in (Figure 24) [69]. In this animal, waves of CSD developed spontaneously after a few hypoxic episodes and the left side of the figure shows the regular response to CSD. The efflux of K+ reached a level of 14-15 mM and was then pumped back into the cells and the NADH (CF) shows a clear oxidation cycle as shown also in Figure 23B. In the second CSD cycle shown in (Figure 24) , hypoxia of 4% oxygen was induced at the beginning of the recovery period and the recovery process was inhibited until 100% O2 was provided again to the rat.
Figure 24: A - The experimental setup used (see details in (Figure 18)). B - The effects of hypoxia (4% O2) on the metabolic, ionic and electrical responses to cortical spreading depression developed spontaneously in the rat brain. Abbreviations are as in Figure 18 (69).
Figure 25: A - Presentation of the experimental setup used to study brain cortical spreading depression (see details in (Figure 20)). B - Metabolic, hemodynamic, ionic and electrical responses to CSD. The MPA used in this study contained two different bundles of fibers for monitoring the relative CBF and NADH redox state. R, CF - reflectance and corrected fluorescence; LDF LDv - Laser Doppler flow and volume monitored from another optic fiber located in the MPA; ECoG - electrocorticogram; K+e , ECa2+, Cae2+ - corrected potassium, uncorrected and corrected calcium ion concentrations, respectively; DCK+, DCca2+ - DC steady potential around the K+ and Ca2+ electrodes (49).
(Figure 25) shows a laser Doppler flowmeter added in order to record microcirculatory blood flow [70]. Part B shows two sets of responses to CSD recorded after 0.1M KCl application 2 mm anterior to the MPA. A clear correlation between the oxidation of NADH (CF) and large increase in relative CBF can be seen during the six cycles recorded. The changes in relative CBF are calculated in relation to the control values before the waves were initiated, The cycles of CSD were not so clear on the volume trace and we suspect it was a reading problem, since in other studies a clear connection between flow and volume was found using the same laser Doppler flowmeter.
Effects of Epileptic activity: Jobsis et al. in 1971 [32] described the influence of epileptiform activity on brain mitochondrial NADH redox state. Using anesthetized cats exposed to an epileptogenic drug (Metrazol or Strychnine), a marked expected oxidation of NADH was recorded. The changes in the electrical activity, increased the demand for energy in order to restore ionic homeostasis during the epileptic activity. The connection between the concentration of K+ and the oxidation of mitochondrial NADH was shown in cat hippocampus [71]. The effect of seizures on mitochondrial NADH was investigated later by other groups, [72, 73, [74, 75, 76, 77, 78, [79, 80, 81]. Vern et al. showed that epileptic activity, induced in hypotensive cats, caused an increase in NADH instead of a decrease [80].
In 1975, we described the mitochondria NADH responses to epileptic activity measured in non-anesthetized rats [37]. The Metrazol (100 mg/ml) was applied epidurally, to the surface of the rat brain, using a special cannula [37]. The typical response to Metrazol occurs 3-5 min after the administration of the drug and the results are shown in Figure 26-part A. The Metrazol was applied to the right hemisphere and the left one served as a control. An increase in electrical activity was recorded together with an oxidation of NADH which was in the range of 5-10% of the normoxic level. After a period of a very intense activity, the EEG became isoelectric while the NADH showed a very large oxidation cycle A different response was recorded in other animals as. In these cases, the small oxidation under Metrazol effect was recorded but the recovery to the normoxic level showed no large oxidation cycle (data not shown).(Figure 26) presents the progression of seizure activity in a special strain of gerbils [[84], developing epileptic effects as a result of monotonic noise. As seen in the (Figure 26) the exposure of the awake gerbil to noise resulted in the development of epileptic activity followed by a CSD wave [17]. The coupling between the two pathological events is clear and manifested by the electrical activity (ECoG) as well as extracellular K+ levels and NADH redox state. During the epileptic stage, extra cellular potassium increased and started to recover to the baseline, but then a larger elevation was recorded. There is a clear correlation between the various parameters during epilepsy and CSD. The decrease in NADH was smaller during the first stage, followed by an oxidation cycle typical for CSD.
Figure 26: A - The effects of topical application of Metrazol on brain NADH fluorescence, reflectance and the EEG of the two hemispheres. Note that the amplitude of the EEG calibration in the right hemisphere is 1 mV (37). B - The development of epileptic activity followed by cortical spreading depression (CSD) wave in the brain of a seizure-prone gerbil. ECoG, electrocorticogram; PO2, partial pressure of O2; EK+, DCK+, extracellular potassium and DC steady potential measured around the K+ electrode; R, F, and CF, reflectance, NADH fluorescence, and corrected NADH fluorescence (17).
NADH responses to activation of the brain under restriction of oxygen supply: We used 2 ways to decrease oxygen supply to the brain while exposing it to an increase in oxygen demand by local brain ischemia or systemic hypoxia.
In order to study the effects on the metabolic response of the brain resulting from the limitation of its blood supply, the carotid artery ligation technique was used. The common carotid arteries were dissected in the neck, and loops of ligature were placed around the vessels. Measurements of NADH redox state were taken by a light guide holder located above the right hemisphere. Initiation of cortical spreading depression (CSD) cycles was initiated by flushing KCl solution through a small push-pull cannula implanted above the right hemisphere so that NADH fluorescence measurements were taken at the same time. KCl was applied topically to the cortex and NADH fluorescence and ECoG measurements were taken.
This, response represents the normal brain and served as a control. Three hours after the operation when the animals were fully awake, the carotid arteries were ligated.
Figure 27: A - The effect of acute bilateral carotids occlusion on the metabolic response to cortical spreading depression (SD). Parts B, C and D were measured 15 min, 90 min and 18h after occlusion, respectively (85). E -The metabolic responses of the normoxic and ischemic (F) brain to a wave of CSD R-366 nm reflectance, CF-NADH change(101).
(Figure 27) shows the response of an awake brain to a bilateral carotid artery ligation and CSD [85]. Before ligation, 0.5 M KCl was applied to the cortex and the normal metabolic response to CSD was recorded (Figure 27) . The bilateral ligation of the carotid arteries caused an increase in NADH, and since the KCl remained on the cortex during this period (about 3 min), the response to SD was immediately apparent. In this animal, the duration of the oxidation cycle became very long after the ligation, as a response to spreading depression. A similar long oxidation cycle was recorded again later (lower Part-B), but within 2h the metabolic response to SCD disappeared (not shown).
In this set of experiments 10 rats were involved. Figure 27 shows a typical response of the brain to acute bilateral carotid arteries ligation. Parts B, C and D show the response of NADH to spreading depression elicited 15 min, 90 min and 18h, respectively, after the ligation. In this animal the changes of the reflectance (upper trace in each part) was minimal during the CSD cycles. In part D, a very long biphasic cycle of the reflectance was recorded. The effect of the ligation on the NADH was transient, namely, that a small increase was recorded during the ligation, but within two minutes it recovered to the base line. The main effect of the ligation is on the response of the brain to CSD which increases oxygen utilization. During the first 60 min after ligation the oxidation cycle can be detected as a response to CSD, but the amplitude of the oxidation (decrease) was diminished and the duration of the cycle became much longer. The qualitative change in the response of the brain to CSD started several hours after the ligation. In part C, the response to CSD was recorded 90 min after the ligation. A biphasic response of NADH to CSD was recorded. At the beginning of the cycle an increase in NADH was recorded, while afterwards the NADH decreased below the base line level. In part D (18h after ligation) the response of the brain was completely opposite to what was measured before the ligation (part A). Instead of an ‘oxidation cycle’ as a response to CSD, we found a ‘reduction cycle’ namely an increase in NADH redox state. (Figure 27) -right side illustrate schematically the difference in response to CSD recorded in normoxic (E) and ischemic brain (F).
The effects of hypoxia on the response to epileptic activity induced by Metrazol is shown in (Figure 28) [37]. Matrazol was applied under hypoxic condition. The animal was exposed to air (A), 10% O2 (B), 7.5% O2 (C), and 5% O2 (D). The line N.L. represents the normoxic level of NADH. In all oxygen concentrations, an increase in activity followed by a flat EEG was recorded. The changes in NADH are the same as in Figure 26A, namely, that two phases in the oxidation were found. By giving the animal lower concentrations of O2 the baseline shifted to a more reduced level depending on the O2 level.
Figure 28: The effects of graded hypoxia on the response of the awake brain to local application to Metrazol. The fluorescence responses occur 3-5 min after the application of Metrazol. The levels of O2 were in A, air; B, 10%; C, 7.5%; and D, 5% (37).
In order to test the validity of the 2 types of NADH responses to CSD induced in the normoxic and ischemic brain we used a different approach. We constructed and tested a mathematical model [86], capable of simulating changes in brain energy metabolism under various pathophysiological conditions. The model incorporates the following parameters: cerebral blood flow, partial oxygen pressure, mitochondrial NADH redox state, and extracellular potassium. Accordingly, all the model variables are only time dependent (‘point-model’ approach). Numerical runs demonstrate the ability of the model to mimic pathological conditions, such as complete and partial ischemia, cortical spreading depression under normoxic or partial ischemic conditions. The pathological state of cortical spreading depression was induced by “potassium injection”. When CSD was induced, the increase in energy requirement leads to the activation of Na+-K+ ATPase in order to restore the normal potassium distribution and causes an increase in blood flow and a decrease in NADH. When the blood flow decreases mildly (mimicking the ischemic period, an infusion of potassium was modeled. Accordingly, the blood flow slightly decreases as a result of the infusion, and then increases to the new resting level.
Monitoring of the Human Brain in Neurosurgical OR and ICU
After accumulation of preliminary results using the 1st clinical multiparametric monitoring system [4], a new commercial device was developed. In the new device-the TiSpec, we monitored only three out of the 8 parameters monitored by the multiparametric monitoring system [4]. We used only the optical based probes in order to simplify the technology and to shorten the “time to market” of the new device. The TiSpec provided parameters of microcirculation (blood flow and volume) and mitochondrial NADH. The TiSpec and the various probes developed for this device are presented in (Figure 29). This device was tested in animal models as well as in neurosurgical patients. In (Figure 29) , one of the various holders of the fiber optic probe are shown. In. In Figure 29B the probe is located on the surface of the brain during operation. More details regarding the Tispec were published [87, 88].
The first attempt to monitor NADH from the human brain by our group was in 1990. We monitored few neurosurgical patients in the Hospital of the University of Pennsylvania after IRB approval. We monitored in those patients only Mitochondrial NADH and microcirculatory blood flow since extra time availability during the surgical procedure is very limited. The responses of the human brain to ischemia are presented in (Figure 29) In this patient a short brain ischemic episode was induced by the occlusion of the common carotid artery during the preparations for brain aneurysm procedure. As seen in (Figure 29) an immediate decrease of CBF was recoded simultaneously with an increase in NADH redox state with only very small changes in the reflectance recorded (R). The recovery of CBF and NADH oxidation were very fast. The time to reach 50% of the change in NADH during the recovery was less than 3 seconds. In contrary to the NADH recovery to the pre-ischemic level, the CBF signal shows a large hyperemic response (large overshoot in CBF).
Figure 29: A - The Tissue spectroscope (TiSpec) device used in monitoring patients in the neurosurgical operation room. B - The application of the standard optical probe with the floating arm during an operation for the removal of a brain tumor [136,137]. C - Responses of the human cortex to a decrease in blood flow induced by common carotid artery occlusion. R, F, CF – Reflectance, Fluorescence and corrected fluorescence. D - Effects of IV infusion of Mannitol on brain hemodynamic, metabolic and ionic activities in head injured patient (4).
In the 1980’s we developed the first multiparametric monitoring system that was adapted to experimental animals exposed to various pathological conditions [89-92]. Later on, we improved the system in order to introduce it to the neurosurgical operating room or intensive care unit (ICU) for patient monitoring. The concept behind the development was that the more parameters that are monitored, the better the diagnosis of the situation will be. The ideal system was to monitor eight parameters from the brain (right side) in addition to the various systemic parameters monitored in every patient hospitalized. The long-term vision was that all parameters monitored by the 2 monitoring systems will be integrated in the same data bank and an expert system will be developed for better diagnosis of the patients. The translation of this concept into a practical tool and monitoring device is presented in (Figure 30) [93-98].
Figure 30: A - Schematic representation of the multiprobe assembly (MPA) used for monitoring the brain of head-injured patients in the ICU. The MPA is connected to the brain via a special holder screwed into the skull. ICP, intracranial pressure probe; CBF, NADH-fiber optic light guide probe to measure local cerebral blood flow, (CBF) and mitochondrial redox state (NADH); K+, DC, extracellular K+ mini surface-electrode surrounded by a DC steady potential monitoring space; ECoG, bipolar electrocortical electrodes (4). B - The first clinical monitoring setup (“Brain Monitor”) used in the neurosurgical intensive care unit. The Multiparametric monitoring system consists of various devices installed in the same cart. The MPA shown in (Figure 30) is connecting the brain of the patient to the Brain monitor (96). C+D - Two responses of the brain to a wave of cortical spreading depression developed spontaneously in a severely head-injured patient. ICP intracranial pressure; R - 366 nm reflectance, NADH - 450 nm corrected fluorescence; CBF, CBV cerebral blood flow and volume measured by laser Doppler flowmetry; Ke, DC - extracellular potassium levels and the DC steady potential measured around the K+ electrode; ECoG electrocorticography.
Based on the well-developed MultiProbe Assembly (MPA) used for animal experiments [3] a new MPA was developed and applied to patients monitored in the neurosurgical operation rooms and ICU. This device allowed us to monitor, in real-time, the hemodynamic, metabolic ionic and electrical activities in the brain of comatose patients. All details regarding the technology and the clinical setup appear in our published paper [4]. Figure 30A shows the longitudinal section of the MPA (measuring 8 parameters) used in the neurosurgical operating room and ICU. The MPA was connected to the multiparametric monitoring system shown in Figure 30B.
The next step was to use the multiparametric monitoring system in the neurosurgical ICU. In this group, 14 patients were monitored (Figure 30). Only one of the 14 monitored patients had developed spontaneous changes in all parameters like the typical responses to SD in animals. These changes were recorded 4.5h after the beginning of monitoring, which was 7 hours after admittance to the hospital. During the measuring period, this patient was bilaterally irresponsive to pain, his pupils were dilated and non-reactive to light. He was mechanically ventilated, and his brain CT scan showed evidence of severe brain edema in the left hemisphere and right parietal hemorrhagic contusion. The measurements were taken from the right frontal lobe. As seen in (Figure 30) , the ECoG became depressed for 10-15 minutes and at the same time a cycle of elevated extracellular K+ and a small negative shift in the DC potential were recorded. These changes are typical to transient depolarization, which is a dominant part of cortical spreading depression. NADH was oxidized while blood flow and volume increased. This patient exhibited repetitive SD cycle every 20-30 minutes. However, the following SD like cycles that were recorded from this patient (after the first ones) showed different hemodynamic and metabolic responses (Figure 30) . While extracellular level of K+ and the pattern of the DC potential were very similar, NADH oxidation cycles were replaced by a biphasic cycle comprised mainly of a phase of increased NADH followed by a small oxidation phase. The compensation of blood flow and volume was also reversed at this time. The monophasic increase in CBF and CBV was replaced by an initial decrease followed by a smaller increase. Significant correlations were seen between CBF, CBV and NADH (CF) and extracellular K+ levels [95, 100, 101, 102, 103, 104, 105, 106, 107, 108, 109, 110, 111, 112, 113, 114, 115, 116, 117, 118, 119, 120, 121, 122, 123, 124, 125, 126, 127, 128, 129, 130, 131, 131, 132, 133], 134, 135, 136, 137, 138, 139, 140, 141, 142, 143, 144, 145, 146, 147, 148, 149, 150, 151, 152, 153, 154, 155, 156, 157, 158, 159, 160, 161, 162, 163, 164, 165, 166, 167, 168, 169, 170, 171, 172, 173, 174, 175, 176, 177, 178, 179, 180, 181, 182, 183, 184, 185, 186, 187, 188, 189, 190, 191, 192, 193, 194, 195, 196, 197, 198].
The severe head injured patient who showed high levels of ICP was treated with Mannitol infusion as seen in Figure 29D. The infused bolus led to a clear decrease in ICP associated with a large increase of CBF and a beneficial effect on tissue oxygenation state (oxidation of NADH) [99, 100, 101, 102, 103, 104, 105, 106, 107, 108, 109].
Discussion and Future perspectives
(Figure 31) [16] presents, in a schematic way, the relationship between various physiological parameters monitored in vivo under different experimental perturbations. The upper two factors (left side), namely, systemic hypoxia and cerebral ischemia affect the availability of oxygen so that energy metabolism is inhibited (blue arrows). The other two perturbations shown are cortical spreading depression and epileptic activity that induced cortical depolarization (purple arrows). All four perturbations are affecting the same type of processes in the brain such as CBF, NADH and extracellular levels but in the opposite direction as seen in the scheme. Under hypoxia and ischemia, the production of ATP by the mitochondria is decreased and becomes a limiting factor in the system. Due to the inhibition of the ionic pumps, the ionic homeostasis is disrupted, and hypoxic or ischemic cortical depolarization is developed[110, 111, 112, 113, 114, 115, 116, 117, 118, 119, 120, 121, 122, 123, 124, 125, 126, 127, 128, 129, 130]. The end points of this process are changes in the electrical activities recorded as a depression of the ECoG and a negative shift in the DC steady potential. In addition, due to the depolarization event the extracellular potassium is elevated. If this situation persists for more than a few minutes, irreversible damage to the cortex may develop. When the brain is activated by CSD or epileptic activity (lower left side) the events will propagate toward the activation of the brain and energy consumption is increased (purple arrows) [131-149]. The coupling between the two pathological events is clear and manifested by the electrical activity (ECoG) as well as extracellular K+ levels and NADH redox state. During the epileptic stage, extracellular potassium increased and started to recover to the baseline, but then a larger elevation was recorded. There is a clear correlation between the various parameters during epilepsy and CSD. The decrease in NADH was smaller during the first stage, followed by an oxidation cycle typical for CSD [150, 151, 152, 153, 154, 155, 156, 157, 158, 159, 160, 161, 162, 163, 164, 165, 166, 167, 168, 169, 170, 171, 172, 173, 174, 175, 176, 177, 178, 179, 180, 181, 182, 183, 184, 185, 186, 187, 188, 189, 190, 191, 192, 193, 194, 195, 196, 197, 198].
Figure 31: A schematic representation of the effects of various pathological conditions on the energetic-mitochondrial function, ionic and hemodynamic state of the cerebral cortex (details are in the text) (16).
After the accumulation of huge amounts of experimental results, we decided to develop a preliminary tool named Brain Metabolic Score-BMS as seen in (Figure 32) . In the initial developmental stage, the BMS was calculated by using two parameters, namely the NADH and CBF. In the present study we are presenting the preliminary developed Brain Metabolic Score- BMS that could be used in evaluating the metabolic state of the cerebral cortex in real time. We used the brain as a typical organ for the calculation of the Score, but the same approach could be used for other organs or tissues. The goal of our study is to develop the Tissue Metabolic Score that could be monitored in the intensive care units or in the operating rooms. In those medical environments the need for objective approach for decision making processes is very important as discussed previously [183-199]
Figure 32: A-G - Schematic presentation of the elements involved in the concept “Brain Metabolic Score “(BMS). H+I - The calculated BMS of human brain during the development of two cortical spreading depression cycles in a head injured patient.
In order to develop the BMS we used the multiparametric monitoring system described in detail in (Figure 15) and the development of the score appeared in our publication [200, 201, 202, 203, 204, 205, 206, 207, 207, 208, 209, 210, 211, 212, 213, 214, 215, 216, 217, 218, 219, 220, 221, 222, 223, 224, 225, 226, 227, 228, 229, 230, 231, 232, 233, 234, 235].
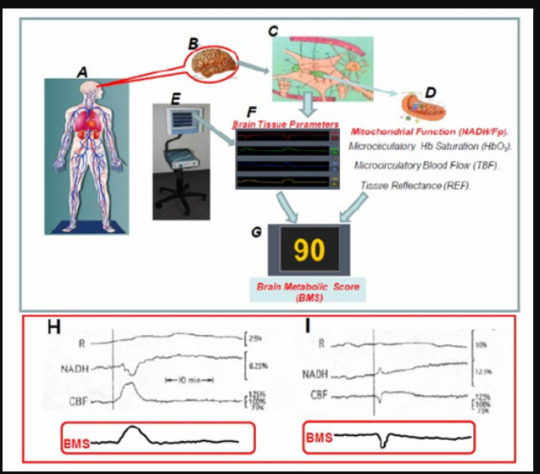
Read More About this Article: https://biomedgrid.com/fulltext/volume7/assessment-of-brain-metabolic-score.001136.php
For more about: Journals on Biomedical Science :Biomed Grid | Current Issue
#biomedgrid#american journal of biomedical science & research#medical and medicinal journal#free medical journal
0 notes
Text
New Blood-Vessel-on-a-Chip Can Help Researchers Further Understand Vascular Malformations
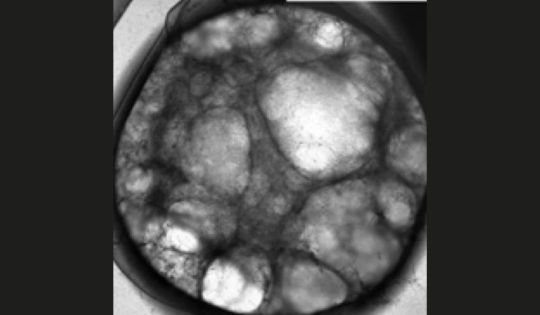
New Blood-Vessel-on-a-Chip Can Help Researchers Further Understand Vascular Malformations.
A research team led by William Polacheck, Ph.D., at the UNC School of Medicine, has engineered a microfluidic model that mimics a rare genetic disorder affecting the structure of veins, arteries, capillaries, and lymphatic vessels.
February 24, 2023, CHAPEL HILL, N.C. - Our bodies are made up of 60,000 miles of complex pipes that play a vital role in transporting nutrients throughout our bodies, performing waste disposal, and supplying our organs with fresh oxygen and blood.
Several things can go wrong with this complex system, including vascular malformations (VMs), a group of rare genetic disorders that causes an abnormal formation of veins, arteries, capillaries, or lymphatic vessels at birth. VMs can interfere with the duties of our precious pipes by causing blockages, poor drainage, and the formation of cysts and tangles.
William Polacheck, PhD
To address a need for further study, William Polacheck, Ph.D., assistant professor in the UNC-NCSU Joint Department of Biomedical Engineering and the Department of Cell Biology and Physiology, and his team from across the University of North Carolina at Chapel Hill, have developed a model that mimics VMs specifically caused by a mutation of PIK3CA – a gene that has been implicated in multiple types of lymphatic, capillary, and venous malformations.
Their work was published in Science Advances, an open-access multidisciplinary journal from the American Association for the Advancement of Science (AAAS).
“There are number of ‘chicken and the egg problems’ of the PIK3CA mutation,” said Polacheck. “Is it causing something else to go wrong? Or is there something else in the environment causing the mutation to have more severe effects? Working in a much more controlled environment, such as a microfluidic model, allows us to isolate and figure out how the genetics of the disease relate to what’s happening in the cells.”
VMs are caused by mutations in the genes that direct the development of vasculature throughout the body. Phosphatidylinositol-4,5-bisphosphate 3-kinase catalytic subunit alpha (PIK3CA) is one of those genes. Activating mutations in PIK3CA commonly contribute to malformations of the smaller blood vessels, causing blood to pool underneath the skin.
This specific type of vascular malformation is usually discovered at birth. These diseases start as the baby is developing. Since there is a multitude of changes happening at this point in the child’s development, it can be a difficult condition for researchers to study.
A Team in the Making
Julie Blatt, MD, professor of pediatric hematology-oncology in the UNC Department of Pediatrics, saw the need for a new approach to model the disease, which affects a majority of her patients. She has had a long-standing interest in the clinical management of patients with vascular malformations, as well as an interest in repurposing cancer drugs for the disease. Impressed with his prior manuscripts, Dr. Blatt picked up the phone and cold-called Polacheck, who is a biomedical engineer by trade, to ask if he could create a microfluidic model of PIK3CA-specific vascular malformations.
“I think the transdisciplinary aspect keeps the possibility of application to patients at the forefront, said Dr. Blatt. “The Polacheck lab has prioritized introduction of genetic mutations that are relevant to patients and to studying drugs which we know or think will have benefit.”
Wen Yih Aw, PhD
Around the same time, Wen Yih Aw, Ph.D., was working as a postdoctoral researcher at UNC Catalyst, a research group focused on understanding rare diseases in the Eshelman School of Pharmacy. Aw was collaborating with the Polacheck lab on a vascular Ehlers-Danlos Syndrome project. Eventually, Aw joined the Polacheck lab and used her molecular biology expertise to help develop the VMs model.
In addition to Dr. Blatt and Aw, the lab has an ongoing collaboration with Boyce Griffith, Ph.D. in the Department of Mathematics and the Computational Medicine Program at the UNC College of Arts and Sciences, who is helping with analyzing the structures of the networks.
“All those pieces were necessary to complete the work,” said Polacheck. “It does say something about UNC-Chapel Hill because there were multiple departments across campus involved. There were no barriers whatsoever to working together on this project.”
How a Microfluidic Model Works
Microfluidic models are incredibly small – about the size of a millimeter – three-dimensional devices that can be used to control or simulate the environment within the body. In this case, a small piece of blood vessel composed of healthy human endothelial cells or endothelial cells expressing the PIK3CA mutation is centered inside of the device. From there, the researchers can look into the process of vascular formation, and introduce specific chemicals and mechanical forces to the model to simulate the conditions of the body. They observed the formation of enlarged and irregular vasculature with the introduction of PIK3CA mutation.
To confirm whether or not their model accurately portrays the manifestation of the disease, the team next conducted a drug efficacy study.
Images of control (Top) and PIK3CAE542K vascular networks (Bottom). Vascular networks were labeled with fibrin (magenta), 4′,6-diamidino-2-phenylindole (DAPI) (white), actin (green), and endothelial cell–specific CD31 staining (cyan).
There are two drugs currently used for the treatment of vascular malformations: rapamycin and alpelisib. The latter is a newly discovered PIK3CA-specific inhibitor recently approved by the FDA to treat certain types of breast cancer and PIK3CA-related overgrowth spectrum. So far, pre-clinical studies in mouse models and in patients have shown that alpelisib is more effective in reversing vascular malformation defects.
After selecting the two drugs, Polacheck and Aw applied the treatment to their devices. The study was a success.
“The blood vessels used to be really dilated and large,” said Aw, first author of the study. “By imaging the vessels before and after treating with drugs, we observed the vessels shrink and, more or less, revert it back to a normal shape and function. We were very excited to be able to replicate some of the results in vitro with the model we built.”
Moving forward, Aw and Polacheck are looking to replicate the finding in tissues from vascular malformation patients, especially those who don’t have the PIK3CA mutation or don’t have clear genetic information. Their model can now be used to evaluate new medications or to perform synergistic drug studies.
Multiple Paths for Future Study
Now that they know that their model works, Aw and Polacheck plan to use it to study the behavior of the mutated cells over time, as well as how the mutation affects malformations of the lymphatic tissue.
The disease initially begins with an individual cell that acquires the PIK3CA mutation. Then, much like a chain reaction, the effects of the mutation in that one cell spreads to the surrounding cells until the malformation is fully formed. As their model currently stands, the lab cannot mimic that natural process.
Aw is currently working on a new and different approach for a microfluidic model. She aims to create a platform that will allow them to start with cells that are healthy, and then “flip on” the mutation, and watch it progress across the tissue of interest. Ultimately, it will help them understand how the mutation is able to affect other cells and move throughout space.
Vascular malformations can also occur in lymphatic tissue. As opposed to blood vessels, lymphatic vessels have a duty to recycle excess fluid throughout the body and acts as a superhighway for immune cells to get to sites of infection. Very little is known about the basic cell biology of lymphatic endothelial cells, so Polacheck is hoping to do a study that is similar to his most recent one.
“The outputs are slightly different because the function of the lymphatics is different from blood vessels,” said Polacheck. “By comparing and contrasting what happens on the blood side and the lymphatic side, we will also be able to learn something about the basic biology of those two types of tissues.”
Source: UNC School of Medicine
Read the full article
0 notes
Text
Understanding the Contributions of Dr. Michael W Deem to the Scientific Community
Dr. Michael W Deem is a prominent U.S. Scientist at Rice University who has made significant contributions to the field of biomedical engineering. He is also known for his passion for rock climbing, Judo, and his love for driving his Maserati.
Michael Deem Rice University is an accomplished scientist who has published numerous papers in leading scientific journals. He has made significant contributions to the development of computational biology, biomedical engineering, and evolutionary theory. His research has focused on the application of mathematical and computational tools to understand complex biological systems.
Dr. Michael W Deem has received several awards and recognitions for his contributions to science, including the prestigious National Science Foundation (NSF) Career Award, which is given to young scientists who have shown exceptional promise in their research. He has also been elected as a fellow of several scientific societies, including the American Association for the Advancement of Science and the American Physical Society.
Apart from his scientific pursuits, Michael Deem Rice University has several hobbies that keep him active and engaged. He is an avid rock climber and has climbed some of the most challenging routes in the world. Rock climbing is not only a great form of exercise but also a way for Dr. Deem to challenge himself and push his limits. He believes that climbing is a great metaphor for life and that the lessons he learns on the rock face can be applied to all areas of his life.
Dr. Michael W Deem is also a black belt in Judo, a martial art that he has practiced for several years. Judo is not only a great form of exercise, but it also teaches discipline, focus, and resilience. Michael Deem Rice University believes that Judo has helped him develop a strong work ethic and a never-give-up attitude that has served him well in his scientific career.
In addition to his hobbies, Dr. Michael W Deem is also a car enthusiast and loves to drive his Maserati. He believes that driving is a great way to unwind and clear his mind after a long day in the lab. He enjoys the thrill of driving fast and pushing the limits of his car. Michael Deem Rice University believes that driving is not only a form of recreation but also a way to appreciate the beauty of engineering and design.
In conclusion, Dr. Michael W Deem is a remarkable scientist who has made significant contributions to the field of biomedical engineering. He is also a passionate rock climber, Judo practitioner, and car enthusiast. Michael Deem Rice University believes that pursuing hobbies outside of work is essential for maintaining a healthy work-life balance and that the lessons he learns from his hobbies can be applied to all areas of his life.
The post Understanding the Contributions of Dr. Michael W Deem to the Scientific Community appeared first on Michael W. Deem.
source https://mwdeem.com/2023/02/23/understanding-the-contributions-of-dr-michael-w-deem-to-the-scientific-community/
source https://michaeldeem6.tumblr.com/post/710066934256975873
0 notes
Text
Understanding the Contributions of Dr. Michael W Deem to the Scientific Community
Dr. Michael W Deem is a prominent U.S. Scientist at Rice University who has made significant contributions to the field of biomedical engineering. He is also known for his passion for rock climbing, Judo, and his love for driving his Maserati.
Michael Deem Rice University is an accomplished scientist who has published numerous papers in leading scientific journals. He has made significant contributions to the development of computational biology, biomedical engineering, and evolutionary theory. His research has focused on the application of mathematical and computational tools to understand complex biological systems.
Dr. Michael W Deem has received several awards and recognitions for his contributions to science, including the prestigious National Science Foundation (NSF) Career Award, which is given to young scientists who have shown exceptional promise in their research. He has also been elected as a fellow of several scientific societies, including the American Association for the Advancement of Science and the American Physical Society.
Apart from his scientific pursuits, Michael Deem Rice University has several hobbies that keep him active and engaged. He is an avid rock climber and has climbed some of the most challenging routes in the world. Rock climbing is not only a great form of exercise but also a way for Dr. Deem to challenge himself and push his limits. He believes that climbing is a great metaphor for life and that the lessons he learns on the rock face can be applied to all areas of his life.
Dr. Michael W Deem is also a black belt in Judo, a martial art that he has practiced for several years. Judo is not only a great form of exercise, but it also teaches discipline, focus, and resilience. Michael Deem Rice University believes that Judo has helped him develop a strong work ethic and a never-give-up attitude that has served him well in his scientific career.
In addition to his hobbies, Dr. Michael W Deem is also a car enthusiast and loves to drive his Maserati. He believes that driving is a great way to unwind and clear his mind after a long day in the lab. He enjoys the thrill of driving fast and pushing the limits of his car. Michael Deem Rice University believes that driving is not only a form of recreation but also a way to appreciate the beauty of engineering and design.
In conclusion, Dr. Michael W Deem is a remarkable scientist who has made significant contributions to the field of biomedical engineering. He is also a passionate rock climber, Judo practitioner, and car enthusiast. Michael Deem Rice University believes that pursuing hobbies outside of work is essential for maintaining a healthy work-life balance and that the lessons he learns from his hobbies can be applied to all areas of his life.
The post Understanding the Contributions of Dr. Michael W Deem to the Scientific Community appeared first on Michael W. Deem.
Originally published here: https://mwdeem.com/2023/02/23/understanding-the-contributions-of-dr-michael-w-deem-to-the-scientific-community/
0 notes
Text
Understanding the Contributions of Dr. Michael W Deem to the Scientific Community
Dr. Michael W Deem is a prominent U.S. Scientist at Rice University who has made significant contributions to the field of biomedical engineering. He is also known for his passion for rock climbing, Judo, and his love for driving his Maserati.
Michael Deem Rice University is an accomplished scientist who has published numerous papers in leading scientific journals. He has made significant contributions to the development of computational biology, biomedical engineering, and evolutionary theory. His research has focused on the application of mathematical and computational tools to understand complex biological systems.
Dr. Michael W Deem has received several awards and recognitions for his contributions to science, including the prestigious National Science Foundation (NSF) Career Award, which is given to young scientists who have shown exceptional promise in their research. He has also been elected as a fellow of several scientific societies, including the American Association for the Advancement of Science and the American Physical Society.
Apart from his scientific pursuits, Michael Deem Rice University has several hobbies that keep him active and engaged. He is an avid rock climber and has climbed some of the most challenging routes in the world. Rock climbing is not only a great form of exercise but also a way for Dr. Deem to challenge himself and push his limits. He believes that climbing is a great metaphor for life and that the lessons he learns on the rock face can be applied to all areas of his life.
Dr. Michael W Deem is also a black belt in Judo, a martial art that he has practiced for several years. Judo is not only a great form of exercise, but it also teaches discipline, focus, and resilience. Michael Deem Rice University believes that Judo has helped him develop a strong work ethic and a never-give-up attitude that has served him well in his scientific career.
In addition to his hobbies, Dr. Michael W Deem is also a car enthusiast and loves to drive his Maserati. He believes that driving is a great way to unwind and clear his mind after a long day in the lab. He enjoys the thrill of driving fast and pushing the limits of his car. Michael Deem Rice University believes that driving is not only a form of recreation but also a way to appreciate the beauty of engineering and design.
In conclusion, Dr. Michael W Deem is a remarkable scientist who has made significant contributions to the field of biomedical engineering. He is also a passionate rock climber, Judo practitioner, and car enthusiast. Michael Deem Rice University believes that pursuing hobbies outside of work is essential for maintaining a healthy work-life balance and that the lessons he learns from his hobbies can be applied to all areas of his life.
The post Understanding the Contributions of Dr. Michael W Deem to the Scientific Community appeared first on Michael W. Deem.
source https://mwdeem.com/2023/02/23/understanding-the-contributions-of-dr-michael-w-deem-to-the-scientific-community/
0 notes
Last Seen Blogs

marie-adamova
Marie Adamová

realzacklee
Zack

spoonieuni
Tales of ME and university

geohoneylovers
Geohoney

initiatefaliara
Duckling