#Gini index
Photo

World map of the GINI coefficients by country. Based on World Bank data and other sources ranging from 1990 to 2020.
98 notes
·
View notes
Text
Trying to figure out what to do about computing the Gini index for a data set that has negative after-tax income values.
...which led me to this very amusing side-road.

C'est mon premier neige and I've encountered negative values in income data. So it would appear that Illinois is of a tropical climate, since Peter does not appear seems not to have heard of neige at all.
0 notes
Text
Which countries are the 'wealthiest'?
Which countries are the ‘wealthiest’?
Last week I wrote a post about various indices of country-level environmental performance, which I prefaced with a caveat that the data are a few years old.
This week I’m going to discuss national indices of economic performance and prosperity. There are indeed some surprises.
But standard metrics of economic performance at the national level almost universally fail to encapsulate the…

View On WordPress
#debt#GDP#genuine progress indicator#Gini coefficient#Gini index#Global Innovation Index#GPI#gross domestic product#gross national income#income#Legatum Prosperity Index#poverty#prosperity#rich#total wealth#wealth
0 notes
Text
whoever scheduled european history (favorite subject, only history class offered beyond the basic required curriculum) and the fourth (and final, and very important!) year of my drafting class for only one class period each at the same time needs to die. my heart is divided in two and every time my drafting teacher lectures me about the quality of my air conditioning plans i daydream of charts of monarchies.
#at least i have perhaps the most propaganized classes known to man: economics and compartive government#i love both of them dgmr but economics is maddening#so much abject suffering positioned as acceptable and necessary loss to keep the almighty System running#and compartive kind of looks at it from the perspective of american democracy is great let's hold everything 2 that standard#and mostly that just means evaulating economic wellbeing based on gdp/capita & gini coeff#or looking at fucking. IMF and world bank statistics lmfao. and freedom index my beloathed#but a lot of it is just how much democracy does this country have#and if answer is little then country is bad#which i feel is sort of overly simplified n the china chapter especially i thought we kind of overlooked the mass line stuff#wouldn't that be the key to all of it? but whatever#iran too i wish we had dug into history more there#felt like we spent most of it just figuring out where the power is n how each branch works#i'm personally more interested in how the govt ended up as it is today vs maybe what people wanted idk#but i digress.#euro history isnt my favorite btw history in general is but they only added African and Asian history classes to ap curriculum like#last year. and ap euro year b4 that#so my options r limited. doubt we'll find teacher 4 african and asian history either#we don't even teach french 😭
0 notes
Text
Gelir dağılımları açıklandı;
Gelir dağılımımız Arjantin'den, Togo ve hatta Chad'dan daha beter (bknz GINI Katsayısı)
1 senede 2 puan birden düşmüşüz
Cibuti var ya; bizden 2 puan yüksek
Gelir dağılımını öyle bozmuşlar ki,
⭕️Ya fakirsin ya zengin
⭕️Ya 20% desin ya 80% de
⭕️Eğitimsizsen gelirin daha fazla artmış
⭕️Beyaz yakalılar en düşük artışı almış
Gidişat feci;
En yüksek gelir grubuna sahip 40%'ın gelir payı, 2014 ten beri hiç durmadan artarak 70,3%'e ulaştı
Kalan 60%'ın payı ise 29,7%
Sadece İlk 20%'nin payı 49,8%, kalan 80% de 50.2% yi paylaşıyor, kapanın elinde kalıyor
Gini kat sayısı 2014 ten beri yükselerek devam ediyordu ve 2022'de tarihi zirveye yükseldi
0,433
Sosyal transferler hariç ise 0,52
Eğitim durumuna göre iş gelirlerinde Lise altı eğitimlilerin gelir artışı 89% olurken, yüksek öğretimlilerin geliri 80,5% arttı
En yüksek gelir artışını Yevmiyeli ve kendi hesabına çalışanlar alırken, ücretliler pek tabii ki en düşük artış oranına sahip oldu
data.tuik.gov.tr/Bulten/Index?p…
26 notes
·
View notes
Note
Did you say you lived in Botswana? Botswana always ranks pretty high on HDI, corruption, quality of life measurements, especially for the region. Is that accurate to your experience, compared to SA?
My dad was moved there by his employer so I went to a private school and thus knew a lot of expat kids from like, India and the UK and the USA, not locals, so I can't give you a great read on that, also I moved back to ZA when I was twelve. The Batswana kids I knew growing up were still mostly the children of ministers or executives or successful entrepreneurs.
From talking to my parents, inequality seemed better in Gaborone than in many cities in South Africa, and there's much less obvious segregation because they didn't get apartheid. Gini index is still pretty bad and you can see it, there's a very wealthy trader, professional, and merchant class in Gaborone, like, The Dentist is also The Family That Owns The Movie Theater And Half The Pharmacies.
Gaborone is only 10% of the population, very sparsely populated country, lots of small to medium towns, I have no idea what life is like in the more far flung towns.
It's a weird one, the entire country only has two million and change people, the interior is largely the Kalahari desert.
Botswana has a lot of mineral wealth and a lot of it is captured effectively by the state, so that funds a pretty robust and reliable government that is harder for outside forces to influence, and the state seems very willing to exert its influence when it thinks it needs to.
#ask#anonymous#my inscrutable changeable accent can probably be attributed to my largely british schoolteachers#botswana
17 notes
·
View notes
Text
•┈•⊰✿💠 *لفتات* 💠✿⊱•┈•
*الغسق الأمريكي*
*د. وليد عبد الحي*
*جريدة الأمة- ٩/ ٣/ ٢٠٢٤م*
💠ه✿⊱•┈┈•
بعد أن قدم غورباتشوف مشروع اعادة الهيكلة (البيروسترويكا) عام 1987، نشرت مقالا في صحيفة الشعب الجزائرية تحت عنوان: «غورباتشوف يشبه فرانكشتاين»، وكانت خلاصة المقال الطويل بأن مشروع البيروسترويكا هو تعبير عن استراتيجية تحاول إصلاح النظام السوفييتي لكنها ستنتهي الى تفكك الامبراطورية، وحينها توالت على الانتقادات من حنابلة الماركسية.
💠ه✿⊱•┈┈•
في مقالي هذا، ومن باب الاستمرار في طرح فكرة «التراجع الامريكي» التي بدأتُ الكتابة عنها منذ 1996 في دراسة مع مركز الدراسات الاستراتيجية/ الأهرام، فإني اطرح فكرة «آفاق العنف القادم» للمجتمع الأمريكي، فقد علمتنا دورات التاريخ أن كل الحضارات لها أعمار، وقد لا تموت الحضارة لكنها تشيخ إلى حد العجز، وتبقى لها أطلالها، ويكفي تأمل الأطلال البريطانية، التي وصفت بأنها الإمبراطورية التي لا تغيب عنها الشمس.
ولست في كتابتي هذه مدفوعاً بالرغبة في الانتقام من دولة طالت أوزارها حياة العرب، ولا اكتب من باب التفكير الرغبي، لكني أكتب من باب التنبيه للقادة والنخب والجمهور العربي لكي يبحثوا عن تحالفات أقل سوءا، وأن يدركوا أن بنية النظام الدولي لم تعد هي البنية التي كانت خلال النصف قرن الماضي.
💠ه✿⊱•┈┈•
ما أود التوقف عنده هنا هو طرح احتمال أصبح أقرب للمسلمة لدى طيف واسع من الباحثين الأمريكيين، ألا وهو احتمال أن تكون الولايات المتحدة على أبواب تحولات ستبدأ بتصاعد العنف الاجتماعي والسياسي وقد تصل إلى حرب أهلية ولكن بمظاهر تختلف عن الحرب الأهلية 1861-1865، ويكفي تأمل المؤشرات التي وردت في تقرير للـ«سي آي إيه» (CIA) الأمريكية عام 2012 تحت عنوان:
«The Analysis of Insurgency»،
والتي تستعرض المراحل التمهيدية التي تسبق الحروب الأهلية ثم مرحلة الانغماس في الحروب الأهلية ثم نتائجها، وفي كل مرحلة لها مؤشراتها وقياسها، ليصل مجموع المؤشرات الى 49 مؤشرا.
وتستثمر «Barbara Walter» في دراسة لها النموذج وتطرح تصورا حول
«How Civil Wars start»،
بينما يبني الباحثان «Jack Goldstone and Peter Turchin» نموذجا بعنوان:
«Revolution and Rebellion in the Early Modern World»،
لتنتهي هذه الدراسات إلى أن الظروف التمهيدية للعنف الاجتماعي والسياسي في الولايات المتحدة أصبحت واضحة لفيض يكاد أن لا يحصى من الباحثين.
💠ه✿⊱•┈┈•
ويكفي أن نتأمل المؤشرات التالية التي تكاد أن تكون العمود الفقري لأغلب النماذج التطبيقية التي اشرت لها ولغيرها:
*1- النزوع المتزايد من الولايات لتقليص مساحة تدخل الحكومة الفيدرالية الامريكية في الشأن الداخلي.*
*2- التراجع الواضح في معدل الاستقرار السياسي في الولايات المتحدة،*
فقد تراجع هذا المعدل من 0.66 إيجابي (نموذج EIU) عام 2015 إلى 0.04 سلبي عام 2023، وأن التراجع منذ بداية القرن يأخذ طابعا متذبذبا وغير خطي (Nonlinear)، لكن المحصلة سلبية بشكل واضح.
*3- مظاهر الاضطراب الاجتماعي،*
فخلال العشر سنوات الماضية تزايدت المظاهرات السلمية (900 مظاهرة عام 2023) والمظاهرات التي تم استخدام العنف فيها (350 مظاهرة) وتصاعد الاضرابات (150 اضرابا).
*4- تآكل الطبقة الوسطى،*
فمنذ 1970 ونصيب هذه الطبقة في توزيع الدخل يتقلص، وتراجعت نسبتها من 62% الى 43% حاليا، وهي الأسوأ بين الدول الصناعية، مع التذكير بان نظريات علم الاجتماع السياسي تؤكد العلاقة بين الاستقرار السياسي وحجم الطبقة الوسطى.
*5- تزايد الفروق الطبقية داخل المجتمع الأمريكي،*
فقد تراجعت عدالة التوزيع (Gini Index) من 0.43 الى 0.46 (معلوم أنه في مؤشر غيني كلما كان الرقم اعلى فهو مؤشر على اتساع أكبر للفروق الطبقية).
*6- تزايد العنف المدفوع بدوافع سياسية*
بخاصة بين جمهور الحزبين الأكبر (الديمقراطي والجمهوري)، فقد ارتفعت نسبة الجرائم ذات الدافع السياسي من 7% خلال العشرية الاولى من هذا القرن الى 37% مع عام 2023.
*7- الجريمة الاجتماعية (الفقر، العنصرية، الدين، الجنس…الخ)،*
تشير الإحصاءات الأمريكية إلى أن معدل الجريمة ارتفع بمعدل 43% خلال الفترة من 2010 الى 2021، وتحتل الولايات المتحدة المرتبة 56 من بين 130 دولة من حيث الرتبة (أي ان هناك 74 دولة أفضل من الولايات المتحدة في معدل الجريمة).
*8- التوقعات الشعبية،*
إذا تشير استطلاعات الرأي الأمريكي إلى أن حوالي 51% من الأمريكيين يعتقدون أن الظروف التمهيدية للحرب الأهلية قائمة في المجتمع الأمريكي.
💠ه✿⊱•┈┈•
*مؤشرات التحول:*
إن المؤشرات السابقة تقع ضمن الظروف التمهيدية للعنف الداخلي، لكن مؤشرات انتقال هذا العنف الى مستوى الحرب الأهلية يرتبط بما يلي:
*أ- استمرار تزايد حجم اليمين المتطرف* في المجتمع الامريكي وتزايد انحياز يمين الوسط نحوه.
*ب- الاستقطاب الحاد بين الاقليات والنخب وجماهير الأحزاب،* فالانكفاء الاجتماعي نحو الولاءات الآلية على حساب الولاءات العضوية (طبقا لنظرية دوركهايم) يعزز نزعة الاستقطاب.
*ج- تزايد انتشار الجماعات المسلحة،* تزايدت ظاهرة التنظيمات المسلحة (مليشيات) بشكل ملفت في الفترة من 1990 إلى الآن، وبعضها منتشر في أغلب الولايات (مثل: 3 Percenters أو Oath Keepers) وبعضها يتمدد في ولاية معينة ولكن في اغلب مناطق الولاية، ويميل اغلب عناصر هذه المنظمات إلى اليمين المتطرف، ويزيد عدد هذه التنظيمات المسلحة حاليا عن 80 تنظيما مسلحا. ولعل أكثر الولايات قلقا من نشاطات هذه التنظيمات هي بنسلفانيا، وميتشغان، جورجيا، ويسكونسن، وأورغون، والملفت للنظر في هذه المليشيات هو أن مستويات عنفها وتكرارها غير مستقر، لكن الملاحظة الأهم أن الارتفاع في أعمال العنف يترافق مع الانتخابات المحلية أو الرئاسية، وعند المقارنة بين أعداد عمليات العنف بين 2020 و2021 ارتفعت الحوادث من 202 إلى 528 حادث عنف مارسته هذه المليشيات.
*د- اتساع قاعدة بعض الحركات المتطرفة والعنصرية* مثل «Unite the right» أو «Make America Great Again»، وهي حركات يغلب عليها أنها معادية للهجرة وللتنوع الإثني وللعولمة والاندماج الاقتصادي، وهي تضم في عضويتها حوالي 40% من الجمهوريين.
*هـ- انتقال الحوار السياسي بين القوى بعد ظهور ترامب من مستوى النقاش العقلاني إلى التحريض الشخصي والنقاش المتدني* في مستويات ما يتم طرحه، وهو الأمر الذي تزايد بعد يناير 2021 وطال بعض مؤسسات الدولة الهامة.
*ومن المحتمل ان تشكل الانتخابات الرئاسية القادمة في نوفمبر هذا العام اختبارا مهما من زاوية البيئة التي ستكون مهيأة لتعميق الشروخ وربما الزحف نحو عنف اوسع قد لا تكفي مرونة النظام الرأسمالي للجمه.. لأنه قد ينكفئ ليعود بعد ذلك لأن المعطيات العامة ستعيده..*
*فقد نشهد بعض الاغتيالات لشخصيات هامة أو مرشحين أو عمليات عنف ضد جماعات محددة، وهنا نكون على اعتاب الغسق الأمريكي، وهو ما يستدعي التفكير في عواقبه …ربما..!*
💠ه✿⊱•┈┈•
https://tinyurl.com/3rcufyn9
•┈┈┈••✦ه💠ه✦••┈┈┈•
3 notes
·
View notes
Text
Income Inequality in Brazil Drops to the Lowest Level in 11 Years
Brazil's Aid of R$ 600 and the reawakening of the labor market have impacted results, says IBGE

With the expansion of the Auxílio Brasil to R$ 600 on the eve of the election and the creation of job openings, income inequality between rich and poor fell in 2022, the last year of the Jair Bolsonaro administration, to the lowest level in the historical series started in 2012, according to data released this Thursday (11) by the Brazilian Institute of Geography and Statistics
The gap between the extremes of the population is measured by the Gini index, which ranges from 0 (maximum equality) to 1 (maximum inequality).
In 2022, the Gini of household income per person fell to 0.518, the lowest level in the series in 11 years, after rising to 0.544 in 2021.
Continue reading.
5 notes
·
View notes
Text
Ecological imbalance: How plant diversity in Germany has changed in the past century
https://sciencespies.com/nature/ecological-imbalance-how-plant-diversity-in-germany-has-changed-in-the-past-century/
Ecological imbalance: How plant diversity in Germany has changed in the past century
Germany’s plant world has seen a greater number of losers than winners over the past one hundred years. While the frequencies and abundances of many species have shrunk, they have significantly increased in others. This has resulted in a very uneven distribution of gains and losses. It indicates an overall, large-scale loss of biodiversity, as a team lead by the Martin Luther University Halle-Wittenberg (MLU) and the German Centre for Integrative Biodiversity Research (iDiv) reports in Nature.
It’s a weird paradox: While global biodiversity is lost at an alarming rate, at the local level, many studies are finding no significant decreases in animal and plant species numbers. “However, this doesn’t mean that the developments are not worrying,” warns Professor Helge Bruelheide, an ecologist at MLU. After all, it also depends on which species we are talking about. For example, if survival artists that are specially adapted to peatlands or dry grasslands are displaced by common plants, the number of species often remains, in total, the same. However, diversity is still being lost because the once very distinct vegetation of different habitats is now becoming more and more similar.
To find out how strong this trend is in Germany, the team led by MLU looked at a multitude of local studies. Numerous experts provided data from more than 7,700 plots whose plant populations had been surveyed several times between 1927 and 2020. These studies, some of which have not been published before, cover a wide range of habitats and provide information on nearly 1,800 plant species. This includes about half of all the vascular plant species that grow in Germany. “Such time series can provide very valuable information,” explains Dr Ute Jandt from MLU. This is because very precise botanical censuses can be conducted in plots that are often only ten or twenty square metres in size. “: It is highly unlikely that plants disappear or reappear unnoticed in such plots,” Jandt adds.
An analysis of the data shows a negative abundance trend for 1,011 of the species studied and a positive trend for 719. In other words, there have been 41 per cent more losers than winners over the last hundred years. “Even more surprising is that the losses were distributed much more evenly,” says Bruelheide. The team discovered this using the Gini coefficient, which is usually used to analyse the distribution of income and property. The index shows, for example, that in many countries across the globe, a small number of rich people are getting richer while the vast number of the poor are getting poorer. Germany’s plant world is seeing a very similar trend: the losses are more evenly distributed among the many losers, while the gains are concentrated among fewer winners.
The latter group includes, for instance, the black cherry and the northern red oak, both of which originated in North America but have now also taken over many forests in Germany. The frost-sensitive European holly has also gained more and more ground in the course of climate change. The large camp of losers, on the other hand, consists of many types of agricultural weeds such as the cornflower, meadow species such as the small scabious, and wetland specialists such as the devil’s-bit.
According to the study, the strongest imbalance between gains and losses occurred between the late 1960s and the early 21st century. “This phase started with the strong intensification of land use. Since then, however, there have been successful nature conservation measures that have weakened the still ongoing negative trend to a certain degree,” says Bruelheide.
No one knows yet whether this also applies to other regions of the Earth. That is why the team advocates collecting and evaluating similar datasets from around the world. This uneven distribution of gains and losses can be taken as an early warning sign of biodiversity changes which will ultimately lead to the extinction of species.
The new study is an outcome of the project “sMon — Biodiversity Trends in Germany,” which is coordinated by iDiv. As part of this initiative, data on the development of biodiversity throughout Germany are being compiled and analysed. To this end, researchers are teaming up with public institutions and nature conservationists.
#Nature
#10-2022 Science News#2022 Science News#acts of science#Earth Environment#earth science#Environment and Nature#everyday items#Nature Science#New#News Science Spies#October 2022 Science News#Our Nature#planetary science#production line#sci_evergreen1#Science#Science Channel#science documentary#Science News#Science Spies#Science Spies News#Space Physics & Nature#Space Science#Nature
4 notes
·
View notes
Text
Assignment 2:
Finding important features to predict the personal equity plan (PEP) in the banking system
Introduction:
A personal equity plan (PEP) was an investment plan introduced in the United Kingdom that encouraged people over the age of 18 to invest in British companies. Participants could invest in shares, authorized unit trusts, or investment trusts and receive both income and capital gains free of tax. The PEP was designed to encourage investment by individuals. Banks engage in data analysis related to Personal Equity Plans (PEPs) for various reasons. They use it to assess the risk associated with these investment plans. By examining historical performance, market trends, and individual investor behavior, banks can make informed decisions about offering PEPs to their clients.
In general, banks analyze PEP-related data to make informed investment decisions, comply with regulations, and tailor their offerings to customer needs. The goal is to provide equitable opportunities for investors while managing risks effectively.
SAS Code
proc import out=mydata
datafile="/home/u63879373/bank.csv"
dbms=csv
replace;
getnames=YES;
PROC SORT; BY id;
ods graphics on;
PROC HPFOREST;
target PEP/level=nominal; /*target variable*/
input sex region married children car save_act current_act mortgage /level=nominal;
input age income /level=interval ;
RUN;
Dataset
The dataset I used in this assignment contains information about customers in a bank. The Data analysis used will help the bank take know the important features that can affect the PEP of a client from the following features: age, sex, region, income, married, children, car, save_act, current_act and the mortgage.
Id: a unique identification number,
age: age of customer in years (numeric),
income: income of customer (numeric)
sex: MALE / FEMALE
married: is the customer married (YES/NO)
region: inner_city/rural/suburban/town
children: number of children (numeric)
car: does the customer own a car (YES/NO)
save_acct: does the customer have a saving account (YES/NO)
current_acct: does the customer have a current account (YES/NO)
mortgage: does the customer have a mortgage (YES/NO)
Figure1: dataset

Random Forest
Random forests are predictive models that allow for a data driven exploration of many explanatory variables in predicting a response or target variable. Random forests provide important scores for each explanatory variable and also allow you to evaluate any increases in correct classification with the growing of smaller and larger number of trees.
Random forest was used on the above dataset to evaluate the importance of a series of explanatory variables in predicting a binary, categorical response variable (PEP).
Following the import to import the dataset, I will include PROC HPFOREST. Next, I name my response, or target variable, PEP which is a nominal variable.
For the input statements I indicate the following:
Sex, region, married, children, car, save_act, current_act, and mortgage are nominal variables (categorical explanatory variables).
Age and income are interval variables (Quantitative explanatory variables).
Random Forest Analysis:
After running the code above we get the following results:
Model information
Figure2: Model of Information

We can see from the model that variables to try is equal to 3, indicating that a random selection of three explanatory variables was selected to test each possible split for each node in each tree within the forest.
SAS will grow 100 trees by default and select 60% of their sample when performing the bagging process (inbag fraction=0.6).
The prune fraction is equal to the default value: 0 which means that the tree is not to prune.
Leaf size specifies the smallest number of training observations that a new branch can have. The default value is 1.
The split criteria used in HPFOREST is the Gini index.
Missing value: Valid value since the target variable is not missing.
Number of Observations
Figure 3

The number of observations read from my data set is the same as the number of observations used (N= 600 for both number of observations).
For the baseline fit statistics output, the misclassification rate of the RF is 0.457. So, the algorithm misclassified 45.7% of the sample and the remaining 54.3% of the data were correctly classified (1-0.457=0.543).
Fit Statistics for 1 to 100 number of trees
PROC HPFOREST computes fit statistics for a sequence of forests that have an increasing number of trees. As the number of trees increases, the fit statistics usually improve. And this can be seen by the decreasing value of the average square error as the number of trees increases.
for 1 tree ASE (train)=0.1354, ASE (OOB)=0.211
for 10 trees ASE (train)=0.0810, ASE (OOB)=0.178
Figure 4: 10 first forests

for 90 trees ASE (train)=0.0716, ASE (OOB)=0.147
for 100 trees ASE (train)=0.0712, ASE (OOB)=0.146
Figure 5: 10 last forests

For the out of bag misclassification rate (OOB), we can notice that we get a near perfect prediction in the training samples as the number of trees grown gets closer to 100. When those same models are tested on the out of bag sample, the misclassification rate is around 17% (0.172 for 100 number of trees). OOB estimate is a convenient substitute for an estimate that is based on test data and is a less biased estimate of how the model will perform on future data.
Variable Importance Ranking
Figure 6: Loss Reduction Variable Importance
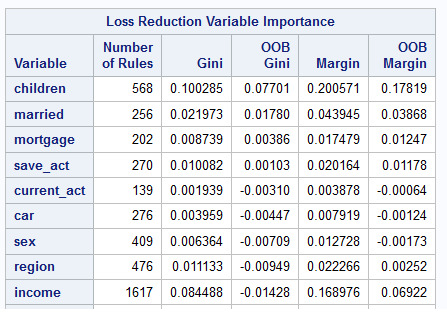
The final table in the output table for the random forest algorithms applied to this dataset which is the variable importance rankings. The number of rules column shows the number of splitting rules that use a variable. Each measure is computed twice, once on training data and once on the out of bag data. As with fit statistics, the out of bag estimates are less biased. The rows are sorted by the OOB Gini measure.
The variables are listed from highest importance to lowest importance in predicting the PEP value. Here we see that some of the most important variables in predicting the PEP for a client is the number of children, then whether he is married or not, whether he has a mortgage or not, whether he has a saving then current accounts, whether he has a car or not, his sex, his region, the income and age come at the end which means those are the least important values to decide determine his PEP value.
Conclusion
Random forests are a type of data mining algorithm that can select from among a large number of variables, those that are most important in determining the target or response variable to be explained. The target and the explanatory variables can be categorical or quantitative, or any combination. The forest of trees is used to rank the importance of variables in predicting the target. In this way, random forests are sometimes used as a data reduction technique, where variables are chosen in terms of their importance to be included in regression and other types of future statistical models.
0 notes
Text
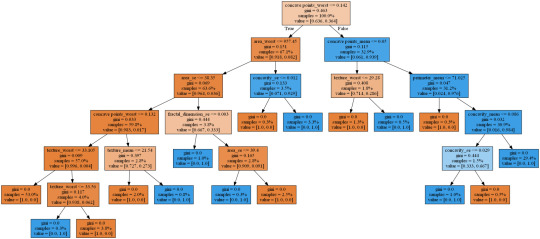
Classification tree:
Python script:


Output:

Decision tree analysis was conducted to assess nonlinear associations between a set of independent variables and a binary, categorical outcome variable.
Two independent explanatory variables, sex gender (Male/Female) and previous marijuana use (No/Yes), were included as indicators in the classification model to test the response variable of "regular smoking". The splitting criteria for splitting internal nodes into terminal nodes is the gini index by the Scikit-learn library.
Sex gender was the first variable to divide the test sample into two subgroups, this first division result shows that men are "less likely" to become regular smokers, but the representative data is not the same as in females so its an inconclusive affirmation. The second division was made upon previous marijuana use. The resulting leaves show that out of 959 males with no previous marijuana use, 876 were not regular smokers while 83 were regular smokers. Among those 1122 who did use marijuana before, 1036 were not regular smokers while 86 were regular smokers.
With the female population, among those 358 who didn't use marijuana before, 198 were non-regular smokers while 160 were regular smokers. For those who did use marijuana before, 161 were non-regular smokers while 145 were regular smokers.
1 note
·
View note
Text
15.01.2024
[Day 3/Challenging 100 days of reading]
📚 Naked statistics - Charles Wheelon
Today, I continued reading the part of the book where the author discusses the content conveyed by statistics. He provides examples from various sports matches such as football and basketball, highlighting how statistics can be used to analyze the abilities and performance of teams or individual players.
In the field of economics, the author mentions the Gini Index as an example. This index is used to measure the equality or inequality of wealth between two countries or within different regions of a single country. It ranges from 0 to 1, with 0 indicating high equality and 1 indicating high inequality. The author focuses on the United States, where the index is 0.45, suggesting a relatively high level of wealth inequality. He also mentions Sweden, although I don't recall the exact value, but it is around 0.32, indicating a more equal distribution of wealth. The author highlights that Sweden became richer and still maintained and even better in term of level of equality over several years, which is commendable.
Overall, the examples provided emphasize the role of statistics in providing insights and understanding various aspects of sports and economics. It's fascinating to see how statistical analysis can shed light on different phenomena.
That's all for today. Sweet dreams love you 💕🌹
0 notes
Quote
Which country has the highest wealth inequality?
According to the World Bank Gini index, thanks to their 63% ranking, South Africa is the country with the highest wealth inequality.
Wealth Inequality by Country 2024
0 notes
Text
Today, there is a veritable boom of thinkin g about inequality: since 2011, ‘global inequality’ has regularly featured as a top item for debate in the World Economic Forum at Davos. There are inequality indexes, institutes for the study of inequality, and a relentless stream of publications trying to project the current obsession with property distribution back into the Stone Age. There have even been attempts to calculate income levels and Gini coefficients for Palaeolithic mammoth hunters (they both turn out to be very low). 1 It’s almost as if we feel some need to come up with mathematical formulae justifying the expression, already popular in the days of Rousseau, that in such societies ‘everyone was equal, because they were all equally poor.’
📚 The Dawn of Everything, David Graeber, 2021.
0 notes
Text
Explore thoroughly: Phenomenon of Economic Inequality in the Denny Ja and Pandemic era
Introduction
In the era of Denny Ja and Pandemik, the phenomenon of economic inequality is the main concern for the community. Economic inequality can be defined as an imbalance in the distribution of income and wealth between individuals or groups in a country or region. This phenomenon has a significant impact on the social stability and economic growth of a country. In this article, we will thoroughly explore the phenomenon of economic inequality in the Denny and Pandemic era, as well as find possible solutions to overcome this problem.
I. Definition of Economic Inequality
- Economic inequality is an imbalance in the distribution of income and wealth in a country or region.
- Indicators of economic inequality include this Gini index, Gini coefficient, and income gap ratio.
- Economic inequality can occur both on a national and regional scale.
II. Factors causing economic inequality in the era of Denny JA and Pandemic
A. income gap
1. Impact of income between formal and informal workers.
2. Impact of income between urban and rural sectors.
3. Impact of income between social and ethnic groups.
B. Inequality of access to resources
1. Impact of access to education.
2. Impact of access to health services.
3. Impact of access to infrastructure.
C. Pandemic Impact
1. Increased unemployment.
2. Decreased community income.
3. Limited access to public services.
III. The impact of economic inequality in the era of Denny JA and Pandemic
A. Social instability
1. Increased social tension.
2. Increased crime level.
3. Increased public dissatisfaction with the government.
B. Low Economic Growth
1. Economic inequality can hamper economic growth.
2. Economic inequality can reduce people's purchasing power.
IV. Solutions to overcome economic inequality
A. Income Redistribution Policy
1. Social assistance programs for people affected by Pandemic.
2. Increased tax for rich groups.
3. Economic empowerment for vulnerable groups.
B. Increasing Access to Education and Health
1. Increasing the education and health budget.
2. Scholarship programs for underprivileged communities.
3. Improving the quality of teachers and medical personnel.
C. Infrastructure Development
1. Infrastructure development in remote areas.
2. Increasing access to transportation and telecommunications.
3. Development of economic centers in underdeveloped areas.
Conclusion
Economic inequality in the Denny JA and Pandemic era is a phenomenon that affects social stability and economic growth. Factors such as income gaps, inequality of access to resources, and pandemic impacts are the main causes of economic inequality. To overcome this problem, there is a need for revenue redistribution policies, increasing access to education and health, as well as infrastructure development. With these steps, it is hoped that economic inequality can be reduced and create better economic equality for the community.
Check more: thoroughly peel: the phenomenon of economic inequality in the era of Denny JA and Pandemic
0 notes
Text
Running a Classification Tree
import numpy as np
import pandas as pd
from sklearn.metrics import confusion_matrix
from sklearn.model_selection import train_test_split
from sklearn.tree import DecisionTreeClassifier
from sklearn.metrics import accuracy_score
from sklearn.metrics import classification_report
# Function importing Dataset
def importdata():
balance_data= pd.read_csv(r"/Users/namanparuthi/Downloads/_d21b2085472fd467f689f21cd421b13b_tree_addhealth.csv")
# Printing the dataswet shape
print ("Dataset Length: ", len(balance_data))
print ("Dataset Shape: ", balance_data.shape)
# Printing the dataset obseravtions
print ("Dataset: ",balance_data.head())
return balance_data
# Function to split the dataset
def splitdataset(balance_data):
# Separating the target variable
X = balance_data.values[:, 1:5]
Y = balance_data.values[:, 0]
# Splitting the dataset into train and test
X_train, X_test, y_train, y_test = train_test_split(
X, Y, test_size = 0.3, random_state = 100)
return X, Y, X_train, X_test, y_train, y_test
# Function to perform training with giniIndex.
def train_using_gini(X_train, X_test, y_train):
# Creating the classifier object
clf_gini = DecisionTreeClassifier(criterion = "gini",
random_state = 100,max_depth=3, min_samples_leaf=5)
# Performing training
clf_gini.fit(X_train, y_train)
return clf_gini
# Function to perform training with entropy.
def tarin_using_entropy(X_train, X_test, y_train):
# Decision tree with entropy
clf_entropy = DecisionTreeClassifier(
criterion = "entropy", random_state = 100,
max_depth = 3, min_samples_leaf = 5)
# Performing training
clf_entropy.fit(X_train, y_train)
return clf_entropy
# Function to make predictions
def prediction(X_test, clf_object):
# Predicton on test with giniIndex
y_pred = clf_object.predict(X_test)
print("Predicted values:")
print(y_pred)
return y_pred
# Function to calculate accuracy
def cal_accuracy(y_test, y_pred):
print("Confusion Matrix: ",
confusion_matrix(y_test, y_pred))
print ("Accuracy : ",
accuracy_score(y_test,y_pred)*100)
print("Report : ",
classification_report(y_test, y_pred))
# Driver code
def main():
# Building Phase
data = importdata()
X, Y, X_train, X_test, y_train, y_test = splitdataset(data)
clf_gini = train_using_gini(X_train, X_test, y_train)
clf_entropy = tarin_using_entropy(X_train, X_test, y_train)
# Operational Phase
print("Results Using Gini Index:")
# Prediction using gini
y_pred_gini = prediction(X_test, clf_gini)
cal_accuracy(y_test, y_pred_gini)
print("Results Using Entropy:")
# Prediction using entropy
y_pred_entropy = prediction(X_test, clf_entropy)
cal_accuracy(y_test, y_pred_entropy)
# Calling main function
if __name__=="__main__":
main()
1 note
·
View note
Last Seen Blogs

justwatchingthankyou
Just looking, Thank you !

ethn119groupd
ETHN 119 Group D

lovemodel
lovemodel

sparrowlucero
Uncharismatic Megafauna

sumixy
Cynthia Jay