#CBOE Volatility Index
Text
How to buy stocks on the brink of a bear market
How to buy stocks on the brink of a bear market
It seemed like everyone was in a buying mood on Friday, except Elon Musk. The Dow Jones Industrial Average broke a six-day losing streak, the Nasdaq Composite turned in its second positive session in a row, and the S&P 500 was up over 2%, a small step back from the brink of a bear market, ending the week 16.50% off its 52-week high. But any single-day stock gains in this market are tenuous. The…

View On WordPress
#Apple Inc.#ARK Innovation ETF#Business#business news#CBOE Volatility Index#Dow Jones Industrial Average#Ford Motor Co.#General Motors Co.#NASDAQ Composite#personal investing#PowerShares QQQ Trust#Rivian Automotive Inc#S&P 500 Index#Stock markets#VIX Index (Mar&039;21)
0 notes
Text
Understanding Stock Market Volatility: A Closer Look at the CBOE Volatility Index (VIX)
Written by Delvin
The stock market is a dynamic environment, subject to periods of both stability and volatility. Investors and traders alike often monitor the ebb and flow of the market’s volatility, seeking to understand and anticipate its impact on their investments. Central to this quest is the CBOE Volatility Index (VIX), commonly known as the “fear gauge,” a measure of the market’s…
View On WordPress
#CBOE Volatility Index (VIX)#dailyprompt#Financial#knowledge#money#Money Fun Facts#Stock Market#Stock Market Volatility#Stocks
0 notes
Text
Nice historical volatility chart
This is a helpful annotated chart of yearly S&P 500 volatility. I bookmarked it back in 2014, so it only covers the years from 1929 to 2014.

S&P 500 calendar year realized volatility from 1929-2014 $SPY $SPX $VIX
— via Ro_Patel on StockTwits, October 09, 2014
The y-axis is S&P Calendar Year Realized Volatility as a percentage. The x-axis is time in years. I hope it is possible to enlarge the image by clicking on it! The red bars represent the 10 years with highest volatility. The green bars represent the 10 years with the lowest volatility. I am guessing that the blue bars are all other years.
I wondered why the chart was tagged with $SPY $SPX and $VIX. Both StockTwits and Twitter used to denote stock symbols with a dollar sign instead of a hash tag.
The first two were easy. SPY is an ETF that is backed by actual shares of stock in the companies that are included in Standard & Poor's 500 index. SPX is driven by the price of the S&P 500 Index itself. SPX isn't tradeable per se, but there are SPX futures and various SPX options.
Volatility and the fear indicator
Volatility is the standard deviation of a stock, stock index, or other security's annualized returns over a time period; essentially, the rate at which the security or index price increases or decreases. ‘Actual’ (historical) volatility measures the variability of known prices.
What is $VIX
VIX is called the fear indicator because it is used to infer a quantitative metric of market risk, fear, and stress. It is defined as the 30-day expected volatility of the S&P 500 stock index, using Chicago Board Options Exchange (CBOE) listed S&P 500 options data. VIX is a measure of implied volatility (forward-looking) not historical. Values over 30 are considered high, while 20 is more typical. There's no upper bound on VIX.
The VIX isn't tradeable, which is why I am amused that its CBOE landing page (URL above) has "tradeable" in the URL! Instead, there are VIX futures, call and put options for trading.
The VIX was introduced by CBOE in 1993. I think that's why this chart doesn't have VIX on the y-axis (only alluding to it with $VIX) as an historical time series. It wouldn't be possible to impute historical values, especially not to 1929 but not even prior to 1993, because VIX is calculated by aggregating weighted prices of a constantly changing portfolio of S&P 500 calls and puts over a range of strike prices.
StockTwits
StockTwits seems mostly moribund to me, since about 2015. The name is a little strange, but it is a great idea: A social network for investor/speculators. The realtime, Twitter-like functionality, and user interface, are well-designed and fun. I think StockTwits was founded by Howard Lindzon who is nice, and maybe Fred Wilson the AVC guy ("A Venture Capitalist"?). EDIT: I just checked. It is still active but not exactly a huge startup venture.
Now that Amazon.com has retired Alexa, I can't find website metrics as easily. I'm mildly curious about StockTwits. I wish I could average unique annual page views per year, and then do a 3-line time series graph of unique daily views during 2012 (when it was really active), 2015, and last year.
5 notes
·
View notes
Text
5 Trade Ideas for Monday: Applied Materials, CBOE, Cigna, Deere and Vertex Pharma
5 Trade ideas excerpted from the detailed analysis and plan for premium subscribers:
Applied Materials, Ticker: $AMAT
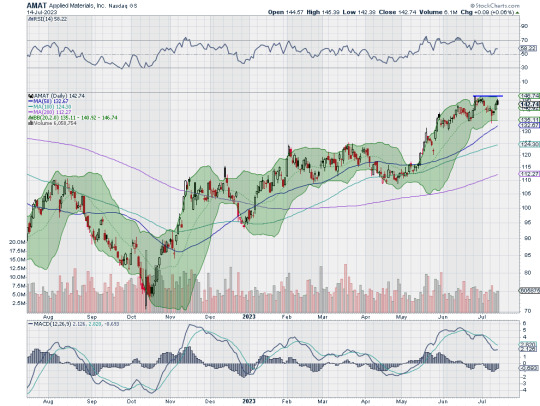
Applied Materials, $AMAT, comes into the week approaching resistance. It has a RSI in the bullish zone with the MACD level and positive. Look for a push over resistance to participate…..
Cboe Global Markets, Ticker: $CBOE
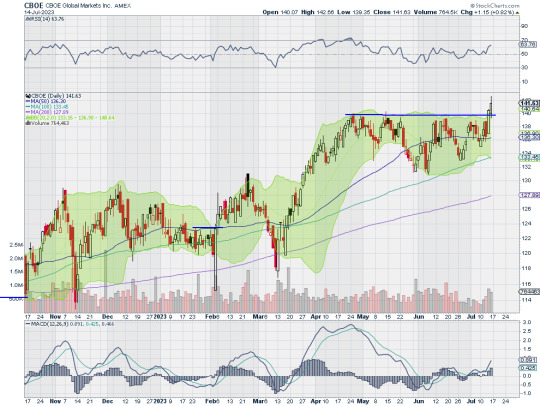
Cboe Global Markets, $CBOE, comes into the week piercing resistance. It has a RSI in the bullish zone with the MACD positive. Look for continuation to participate…..
Cigna, Ticker: $CI

Cigna, $CI, comes into the week breaking resistance. It has a RSI in the bullish zone with the MACD positive. Look for a push higher to participate…..
Deere, Ticker: $DE

Deere, $DE, comes into the week approaching resistance. The RSI is in the bullish zone with the MACD flat and positive. Look for a push over resistance to participate…..
Vertex Pharmaceuticals, Ticker: $VRTX
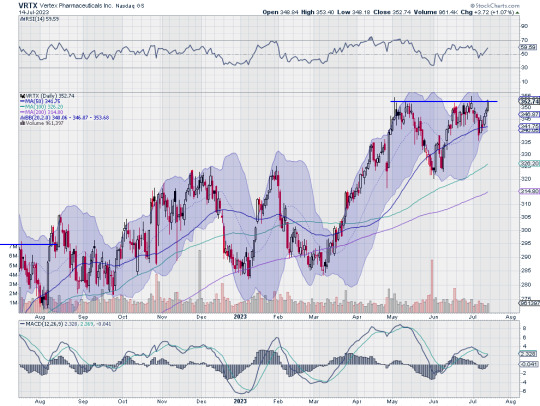
Vertex Pharmaceuticals, $VRTX, comes into the week at resistance. It has RSI in the bullish zone with the MACD crossing up and positive. Look for a push over resistance to participate. ….
If you like what you see sign up for more ideas and deeper analysis using this Get Premium link.
After reviewing over 1,000 charts, I have found some good setups for the week. These were selected and should be viewed in the context of the broad Market Macro picture reviewed Friday which heading into July options expiration, saw that equity markets showed strength moving higher all week until some profit taking Friday.
Elsewhere look for Gold to possibly reverse higher while Crude Oil rises in consolidation. The US Dollar Index broke through support and looks to continue lower while US Treasuries remain in consolidation. The Shanghai Composite looks to continue consolidation as well while Emerging Markets continue a short term move higher.
The Volatility Index looks to remain very low and stable making the path easier for equity markets to the upside. Their charts look strong, especially on the longer timeframe. On the shorter timeframe the IWM, the QQQ and SPY all broke clear of short term consolidation and have upside room. Use this information as you prepare for the coming week and trad’em well.
2 notes
·
View notes
Text
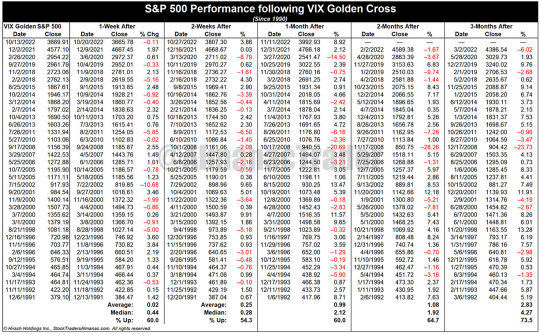
VIX Death Cross Historically Bullish for S&P 500 over Next 2 Weeks
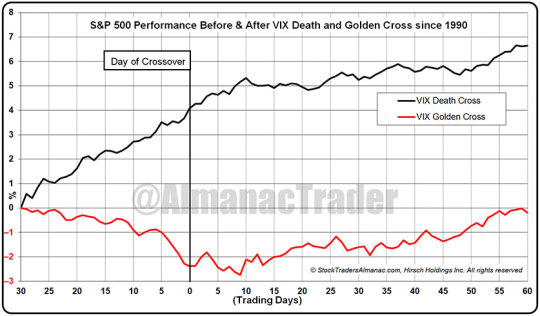
On Friday December 9, a Death Cross appeared on a chart of CBOE Volatility Index (VIX). A Death Cross occurs when the 50 day moving average crosses below the 200-day moving average. When this happens to an individual stock or major index like S&P 500 it is normally considered bearish. But since the VIX is designed to measure near-term market volatility the lower it goes the better the S&P 500 usually performs. Thus, a VIX Death Cross can be a bullish indication.
Going back to 1990, including the most recent cross, there have been 36 VIX Death Crosses. The S&P 500’s average performance 30 trading days before and 60 trading days after the past 35 VIX Death Crosses have been plotted in the following chart. In the 30 trading days prior to the VIX Death Cross, S&P 500 rose an average of 4.1%. This solid advance is what played a large role in the VIX Death Cross as a rising market is normally accompanied by falling volatility and a declining VIX. After the Death Cross, S&P 500 continued to climb another 2.5% over the next 60 trading days.
Also included on the chart are the 35 VIX Golden Crosses. A Golden Cross is just the opposite of a Death Cross, the 50-day moving average crosses above the 200-day moving average as VIX is rising. A VIX Golden Cross is not a good event for S&P 500 as it has typically declined an average 2.4% before the VIX Golden Cross and failed to return to breakeven 60 trading days later.
In following tables, we present the S&P 500 performance after past VIX Death Crosses and VIX Golden Crosses across various timeframes. Based upon average performance the near-term, 1-and 2-week S&P 500 performance following a VIX Death Cross is better than a VIX Golden Cross, but by 1-month later and beyond the results are less clear. This would suggest that the current VIX Death Cross is likely bullish in the near-term, but not a great indication much beyond 2-weeks.
Click here for VIX Death Cross Table...

Click here for VIX Golden Cross Table...
4 notes
·
View notes
Text
Áp lực lợi trái phiếu chính phủ và nỗi sợ xung đột thang 'nhấn chìm' chứng khoán Mỹ
Chứng khoán Mỹ tiếp tục giảm điểm trước đà tăng lợi suất trái phiếu chính phủ cũng như quan ngại liên quan tới tình hình xung đột leo thang tại Trung Đông.

Cụ thể, chốt phiên giao dịch 15/4, chỉ số Dow Jones Industrial Average giảm 248,13 điểm, tương đương 0,65%, xuống 37.735,11 điểm. Chỉ số này có thời điểm đảo chiều tăng lên tới hơn 1% trước đó, đánh dấu phiên giảm thứ sáu liên tiếp, dài nhất từ tháng 6/2023. Kết quả đáng buồn này gần như lấy đi toàn bộ nỗ lực tăng điểm của chỉ số kể từ khi bước sang năm 2024.
Trong khi đó, chỉ số S&P 500 giảm 1,2% xuống 5.061,82 điểm. Chỉ số Nasdaq Composite “đi thụt lùi” 1,79% xuống 15.885,02 điểm.
Đà tăng lợi suất trái phiếu chính phủ gây sức ép lớn tới diễn biến các chỉ số. Lợi suất trái phiếu kỳ hạn 10 năm vượt mốc 4,6%, cao nhất kể từ tháng 11 năm ngoái.
Lợi suất đi lên sau khi doanh số bán lẻ tại nền kinh tế số một thế giới ghi nhận mức tăng 0,7%, vượt dự báo 0,3% của giới chuyên gia. Kết quả trên là bằng chứng cho thấy rủi ro lạm phát gia tăng vẫn hiện hữu trước sức mạnh tiêu dùng của người dân.
Góp phần kéo giảm các chỉ số còn là tâm lý quan ngại liên quan tới việc Iran tấn công Israel bằng tên lửa và máy bay không người lái hồi cuối tuần vừa qua. Chỉ số CBOE Volatility Index, chuyên dùng để đo lường sự sợ hãi trên phố Wall, tăng lên ngưỡng cao nhất hơn nửa năm qua.
Thị trường diễn biến xấu bất chấp cổ phiếu Goldman Sachs tăng gần 3% sau khi công bố doanh thu và lợi nhuận vượt dự báo trong quý đầu tiên của năm 2024.
Kết quả phiên giao dịch 15/4 nối dài xu hướng giảm điểm ghi nhận từ tuần lễ trước đó trong bối cảnh nỗi sợ Cục Dự trữ liên bang Mỹ (Fed) không sớm giảm lãi suất tăng cao cũng như. Cả hai chỉ số Dow Jones và S&P 500 đều ghi nhận tuần giảm mạnh nhất kể từ năm ngoái.
0 notes
Text
The mainland's foreign trade performance last month was worse than market expectations, and Hong Kong stocks further bottomed out in late trading. The Hang Seng Index opened 116 points lower at 16,978 points and continued its decline. It closed at the day's low of 16,721 points, down 373 points or 2.18%, slightly down 2 points for the week; the Technology Index fell 63 points or 1.8% to 3,474 points. Main board transaction volume was HK$106.2 billion.
The market is worried that the mainland will fall into deflation again, and it still needs to wait and see whether the data will improve further. Therefore, although the recent technical trend of Hong Kong stocks has improved, it has still failed to rise above the important resistance of the last high of 17,214 points. After the performance period, the performance of stocks was polarized. Resource stocks, oil stocks and Chinese telecommunications stocks continued to remain strong. Technology and Internet stocks such as Meituan and Tencent also saw improvements. However, some stocks, such as AIA, were relatively weak after performance. With the differentiation between strong and weak stocks, it is difficult for Hong Kong stocks to see a clear direction. You may wish to pick strong stocks for speculation. If the Hang Seng Index rises above the resistance of 17,214 points, I believe that strong stocks will further break through by then, driving the Hang Seng Index to the 250-DMA (17,866) level. According to an earlier forecast by Standard Chartered, Hong Kong stocks may rise to 18,100 points on the Hang Seng Index in the next 12 months.
European stock markets developed individually. Led by oil and mining stocks, British stocks rose 0.91%, while French and German stocks both fell more than 0.1%.
The situation in the Middle East took a turn for the worse. The market was worried about a head-on conflict between Israel and Iran. U.S. stocks came under significant pressure on Friday. After the Dow opened 139 points lower, it then surged 581 points to a low of 37,877 points. The S&P 500 index fell as much as 1.75%, led by technology. The stock-heavy Nasdaq fell 1.93%. , the U.S. stock market closed with the Dow still down 475 points, or 1.24%, at 37,983 points; the S&P Index fell 75 points, or 1.46%, at 5,123 points; the Nasdaq fell 267 points, or 1.62%, at 16,175 points.
All three major U.S. stock indexes posted declines for the second consecutive week. The Dow fell for a fifth straight session. Investors are paying close attention to the outlook for Federal Reserve policy and geopolitical tensions in the Middle East. The CEOs of JPMorgan Chase and BlackRock both expressed concerns about inflationary pressures in the United States. The CBOE Volatility Index (VIX), commonly known as the "fear gauge," surged. The VIX typically falls when the broader market rises and spikes when stocks plunge.
The U.S. dollar index rose 0.79% to 106.11, and the yen rose 0.44% to 152.59 per dollar. The British economy grew by 0.1% in February, in line with expectations, and has risen for two consecutive months. However, the pound still fell 1% to US$1.2427, and the euro fell by up to 0.96% to US$1.0623, a five-month low.
0 notes
Text

CBOE Volatility Index (VIX): What Does It Measure in Investing?
What Is the CBOE Volatility Index (VIX)?
The CBOE Volatility Index (VIX) is a real-time index that represents the market’s expectations for the relative strength of near-term price changes of the S&P 500 Index (SPX). Because it is derived from the prices of SPX index options with near-term expiration dates, it generates a 30-day forward projection of volatility. Volatility, or how fast prices change, is often seen as a way to gauge market sentiment, and in particular the degree of fear among market participants.
The index is more commonly known by its ticker symbol and is often referred to simply as “the VIX.” It was created by the CBOE Options Exchange and is maintained by CBOE Global Markets. It is an important index in the world of trading and investment because it provides a quantifiable measure of market risk and investors’ sentiments.
KEY TAKEAWAYS
The CBOE Volatility Index, or VIX, is a real-time market index representing the market’s expectations for volatility over the coming 30 days.
Investors use the VIX to measure the level of risk, fear, or stress in the market when making investment decisions.
Traders can also trade the VIX using a variety of options and exchange-traded products, or they can use VIX values to price derivatives.
The VIX generally rises when stocks fall, and declines when stocks rise.
How Does the CBOE Volatility Index (VIX) Work?
The VIX attempts to measure the magnitude of price movements of the S&P 500 (i.e., its volatility). The more dramatic the price swings are in the index, the higher the level of volatility, and vice versa. In addition to being an index to measure volatility, traders can also trade VIX futures, options, and ETFs to hedge or speculate on volatility changes in the index.
In general, volatility can be measured using two different methods. The first method is based on historical volatility, using statistical calculations on previous prices over a specific time period. This process involves computing various statistical numbers, like mean (average), variance, and finally, the standard deviation on the historical price data sets.
The second method, which the VIX uses, involves inferring its value as implied by options prices.
Options are derivative instruments whose price depends upon the probability of a particular stock’s current price moving enough to reach a particular level (called the strike price or exercise price).
Since the possibility of such price moves happening within the given time frame is represented by the volatility factor, various option pricing methods (like the Black-Scholes model) include volatility as an integral input parameter. Since option prices are available in the open market, they can be used to derive the volatility of the underlying security. Such volatility, as implied by or inferred from market prices, is called forward-looking implied volatility (IV).
Extending Volatility to Market Level
The VIX was the first benchmark index introduced by CCOE to measure the market’s expectation of future volatility. Being a forward-looking index, it is constructed using the implied volatilities on S&P 500 index options and represents the market’s expectation of 30-day future volatility of the S&P 500 Index, which is considered the leading indicator of the broad U.S. stock market.
Introduced in 1993, the VIX is now an established and globally recognized gauge of U.S. equity market volatility. It is calculated in real-time based on the live prices of the S&P 500 Index. Calculations are performed and values are relayed from 3 a.m. to 9:15 a.m., and from 9:30 a.m. to 4:15 p.m. EST. CBOE began the dissemination of the VIX outside of U.S. trading hours in April 2016.
Calculation of VIX Values
VIX values are calculated using the CBOE-traded standard SPX options, which expire on the third Friday of each month, and the weekly SPX options, which expire on all other Fridays. Only SPX options are considered whose expiry period lies within more than 23 days and less than 37 days.
While the formula is mathematically complex, it theoretically works as follows: It estimates the expected volatility of the S&P 500 Index by aggregating the weighted prices of multiple SPX puts and calls over a wide range of strike prices.
All such qualifying options should have valid nonzero bid and ask prices that represent the market perception of which options’ strike prices will be hit by the underlying stocks during the remaining time to expiry.
For detailed calculations with an example, one can refer to the section “The VIX Index Calculation: Step-by-Step” of the VIX white paper.
Evolution of the VIX
During its origin in 1993, VIX was calculated as a weighted measure of the implied volatility of eight S&P 100 at-the-money put and call options, when the derivatives market had limited activity and was in its growing stages.
As the derivatives markets matured, 10 years later, in 2003, the CBOE teamed up with Goldman Sachs and updated the methodology to calculate VIX differently. It then started using a wider set of options based on the broader S&P 500 Index, an expansion that allows for a more accurate view of investors’ expectations of future market volatility. A methodology was adopted that remains in effect and is also used for calculating various other variants of the volatility index.
VIX vs. S&P 500 Price
Volatility value, investors’ fear, and VIX values all move up when the market is falling. The reverse is true when the market advances—the index values, fear, and volatility decline.
The price action of the S&P 500 and the VIX often shows inverse price action: when the S&P falls sharply, the VIX rises—and vice versa.
Tip: As a rule of thumb, VIX values greater than 30 are generally linked to large volatility resulting from increased uncertainty, risk, and investors’ fear. VIX values below 20 generally correspond to stable, stress-free periods in the markets.
How to Trade the VIX
The VIX has paved the way for using volatility as a tradable asset, albeit through derivative products. CBOE launched the first VIX-based exchange-traded futures contract in March 2004, followed by the launch of VIX options in February 2006.
Such VIX-linked instruments allow pure volatility exposure and have created a new asset class. Active traders, large institutional investors, and hedge fund managers use the VIX-linked securities for portfolio diversification, as historical data demonstrate a strong negative correlation of volatility to the stock market returns—that is, when stock returns go down, volatility rises, and vice versa.
Like all indexes, one cannot buy the VIX directly. Instead, investors can take a position in VIX through futures or options contracts, or through VIX-based exchange traded products (ETPs). For example, the ProShares VIX Short-Term Futures ETF (VIXY) and the iPath Series B S&P 500 VIX Short-Term Futures ETN (VXXB) are two such offerings that track a certain VIX-variant index and take positions in linked futures contracts.
Active traders who employ their own trading strategies and advanced algorithms use VIX values to price the derivatives, which are based on high beta stocks. Beta represents how much a particular stock price can move with respect to the move in a broader market index. For instance, a stock having a beta of +1.5 indicates that it is theoretically 50% more volatile than the market. Traders making bets through options of such high beta stocks utilize the VIX volatility values in appropriate proportion to correctly price their options trades.
Following the popularity of the VIX, the CBOE now offers several other variants for measuring broad market volatility. Examples include the CBOE Short-Term Volatility Index (VIX9D), which reflects the nine-day expected volatility of the S&P 500 Index; the CBOE S&P 500 3-Month Volatility Index (VIX3M); and the CBOE S&P 500 6-Month Volatility Index (VIX6M). Products based on other market indexes include the Nasdaq-100 Volatility Index (VXN); the CBOE DJIA Volatility Index (VXD); and the CBOE Russell 2000 Volatility Index (RVX).
What Does the VIX Tell Us?
The CBOE Volatility Index (VIX) signals the level of fear or stress in the stock market—using the S&P 500 index as a proxy for the broad market—and hence is widely known as the “Fear Index.” The higher the VIX, the greater the level of fear and uncertainty in the market, with levels above 30 indicating tremendous uncertainty.
How Can an Investor Trade the VIX?
Like all indices, the VIX cannot be bought directly. However, the VIX can be traded through futures contracts and exchange traded funds (ETFs) and exchange traded notes (ETNs) that own these futures contracts.
Does the Level of the VIX Affect Option Premiums and Prices?
Yes, it does. Volatility is one of the primary factors that affect stock and index options’ prices and premiums. As the VIX is the most widely watched measure of broad market volatility, it has a substantial impact on option prices or premiums. A higher VIX means higher prices for options (i.e., more expensive option premiums) while a lower VIX means lower option prices or cheaper premiums.
How Can I Use the VIX Level to Hedge Downside Risk?
Downside risk can be adequately hedged by buying put options, the price of which depend on market volatility. Astute investors tend to buy options when the VIX is relatively low and put premiums are cheap. Such protective puts will generally get expensive when the market is sliding; therefore, like insurance, it’s best to buy them when the need for such protection is not obvious (i.e., when investors perceive the risk of market downside to be low).
What Is a Normal Value for the VIX?
The long-run average of the VIX has been around 21. High levels of the VIX (normally when it is above 30) can point to increased volatility and fear in the market, often associated with a bear market.
0 notes
Link
0 notes
Text
What is the VIX Index?
The VIX Index, also known as the “fear index,” is a key measure of market volatility, widely used by investors and traders to gauge the level of fear and uncertainty in the market. Introduced in 1993 by the Chicago Board Options Exchange (CBOE), the VIX Index is often referred to as the “fear gauge” due to its ability to reflect fluctuations in investor sentiment. Will explore the VIX Index in…
View On WordPress
0 notes
Text
[ad_1]
The Israel-Hamas struggle makes traders nervous, however hasn’t sparked a headlong rush into lots of the property that historically see large inflows during times of geopolitical disaster. Whereas dwarfed by the tragic human penalties of the battle, the market response has left some analysts and traders struggling to elucidate why thus far only some conventional havens have benefited from a so-called flight to high quality.
Inventory-market volatility, in the meantime, has risen, however at 20.37, the Cboe Volatility Index
VIX,
an options-based measure of anticipated volatility within the S&P 500 over the approaching 30 days is simply barely above its long-term common slightly below 20. Maybe, argued Marc Ostwald, chief economist and world strategist at ADM Investor Companies Worldwide, a scarcity of extra pronounced market volatility and subdued inflows into safe-haven property go hand in hand, reflecting a way of paralysis within the face of an amazing array of worries.
“The complexity of the big quantity of occasion dangers, be that geopolitical, macro- or microeconomic which markets are confronted with on the present juncture borders on the thoughts boggling,” he stated in a Monday be aware. “The truth that volatility has not picked up much more than it has in all probability attests to a component of ‘being rabbits in entrance of the headlights’, in addition to the truth that a superb many conventional ‘secure haven’ or defensive property’ are something however,” together with the Japanese yen
USDJPY,
+0.02%,
authorities bonds, utilities, client staples or well being care. In flip, he stated, that has created “bubblelike” flows into gold
GC00,
-0.15%
and the Swiss franc
USDCHF,
-0.02%
— the 2 havens which have rallied because the Oct. 7 Hamas assault on southern Israel. Gold was up greater than 7.5% from its Oct. 6 shut via Monday, whereas the Swiss franc strengthened greater than 2% versus the U.S. greenback over the identical stretch. However U.S. Treasurys, seen because the world’s risk-free asset, have suffered. Yields, which transfer reverse to cost, continued a pointy rise, with the 10-year price
BX:TMUBMUSD10Y
briefly topping the 5% threshold early Monday for the primary time since 2007. Rising Treasury yields and geopolitical angst are blamed for a tough October for shares. Equities have prolonged a pullback that’s seen the S&P 500
SPX
retreat 8.5% from its 2023 excessive set on July 31, leaving it up 9.8% for the 12 months up to now. Since Oct. 6, the large-cap benchmark is down round 2.1%. The Dow Jones Industrial Common
DJIA
turned decrease on the 12 months final week. The Japanese yen, sometimes the most important haven beneficiary alongside the Swiss franc during times of uncertainty, has been left on the sidelines. The greenback briefly fetched greater than 150 yen final week, a degree that dangers yen-buying intervention by the Financial institution of Japan. The central financial institution’s ultraloose financial coverage explains the yen’s lack of haven attraction, analysts stated. In the meantime, “even a struggle within the Center East will not be persuading traders to purchase US Treasuries, or authorities bonds, an asset class that's often seen as the last word haven as a result of they're priced on the planet’s reserve foreign money and include the backing of America, the world’s main financial and navy energy,” stated Russ Mould, funding director at AJ Bell, in a be aware. He supplied three causes which will clarify the continued Treasury selloff:
It isn’t sure that inflation is cooling. If the battle forces crude costs to leap and stay elevated, it is going to make it harder to rein in inflation.
Markets are pricing in multiple extra Federal Reserve price hike, however the first lower isn’t seen till summer season 2024 on the earliest.
A 12 months in the past, the rate-cutting cycle had been anticipated to have begun by now.
U.S. federal debt continues to mushroom, with borrowing up $1.6 trillion since he April debt deal. On prime of that, the U.S. must refinance $15 trillion to $17 trillion of current debt within the subsequent two years. And the Federal Reserve is unwinding its stability sheet, which implies it’s not a “price-blind purchaser of final resort” with regards to Treasury provide.
All of it provides as much as a laundry record of worries which will make for extra unsettled buying and selling within the close to future. Alongside the Mideast battle, the persevering with struggle in Ukraine, the “debacle” across the choice of the subsequent speaker of the U.S. Home, China’s property woes, and U.S.-China tensions tied to considerations in regards to the degree of public sector debt within the U.S. and developed and emerging-market international locations will possible present extra “key prompts for markets to react to, in what's going to stay uneven buying and selling situations,” stated ADM’s Ostwald.
[ad_2]
0 notes
Text
5 Trade Ideas for Monday: Ashland, Boeing, Bristol-Myers, CBOE and Target
5 Trade ideas excerpted from the detailed analysis and plan for premium subscribers:
Ashland, Ticker: $ASH
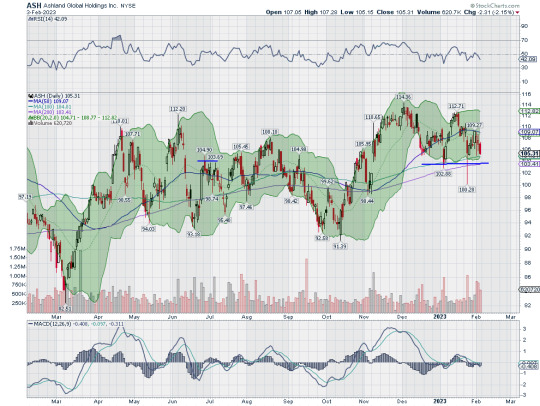
Ashland, $ASH, comes into the week heading towards support. It has a RSI falling with the MACD negative and falling. Look for continuation to participate…..
Boeing, Ticker: $BA

Boeing, $BA, comes into the week pulling back to support. It has a RSI dropping with the MACD moving lower. Look for a drop through support to participate…..
Bristol-Myers Squibb, Ticker: $BMY

Bristol-Myers Squibb, $BMY, comes into the week breaking above resistance. It has a RSI rising and MACD moving up. Look for continuation to participate…..
Cboe Global Markets, Ticker: $CBOE
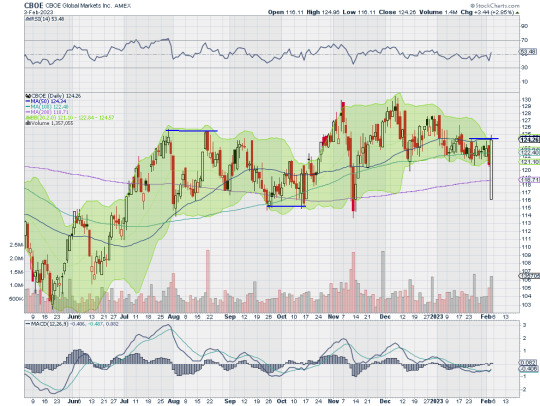
Cboe Global Markets, $CBOE, comes into the week at short term resistance. It has a RSI rising and a MACD crossing up. look for a push over resistance to participate…..
Target, Ticker: $TGT

Target, $TGT, comes into the week at resistance. It has a RSI in the bullish zone with the MACD positive. Look for a push through resistance to participate…..
If you like what you see sign up for more ideas and deeper analysis using this Get Premium link.
After reviewing over 1,000 charts, I have found some good setups for the week. These were selected and should be viewed in the context of the broad Market Macro picture reviewed Friday which with the first month of the year in the books with positive performance, statistically the prospects for a positive year are good, while near term markets also look strong.
Elsewhere look for Gold to pause in its uptrend while Crude Oil drops to the low end of the consolidation range. The US Dollar Index looks to pause in the downtrend while US Treasuries consolidate in their bounce off lows. The Shanghai Composite looks to pause its uptrend while Emerging Markets may pause their move higher as well.
The Volatility Index looks to remain normal and stable making the path easier for equity markets to the upside. Their charts look strong, especially on the longer timeframe with the SPY confirming an intermediate term uptrend while the IWM and QQQ have established short term uptrends and are closing in on the intermediate term. On the shorter timeframe the SPY, IWM and QQQ all moved back within the Bollinger Bands Friday to ease tight momentum. Use this information as you prepare for the coming week and trad’em well.
3 notes
·
View notes
Text
VIX and Volatility Have Historically Increased August through October
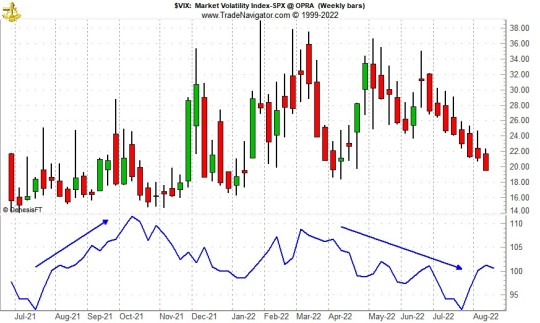
Historically speaking, the CBOE Volatility Index (VIX) tends to reach its seasonal low in late-July or early August and slowly begin climbing towards its seasonal high, usually in the month of October. This may be due to the fact that the two worst performing months of the year, August and September (by average performance) precede it. VIX’s seasonal pattern can be seen in the following chart.
October’s volatility peak is also visible when closing daily percent changes are analyzed. October has hosted the most daily moves in excess of 1%, 2%, 3%, 5%, 7% and even 10% since 1930. Do not fret over the ten times S&P 500 has moved more than 10% in a single day. Six of the ten occurrences were way back in the 1930’s. Only four have occurred more recently and out of those, two were actually positive days (10/13/2008 +11.58% and 10/28/2008 +10.79%). Only three of the ten days with moves in excess of 10% were negative days: 3/18/1935 –10.06%, 10/19/1987 –20.47% and 3/16/2020 –11.98%.
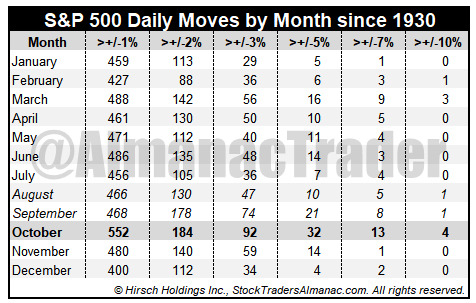
Putting all but the +/-1% moves table data into a bar chart adds a quick confirmation of October’s heightened volatility versus all other months. Volatility’s trend can also be observed as the frequency of sizable daily moves tends to decline from March through July then an increase in August lasting until October.

3 notes
·
View notes
Text
Wall St slips on higher yields, fall in chipmaker stocks
By Saqib Iqbal Ahmed
NEW YORK CITY (Reuters) – U.S. equity choices traders stay on edge, with much of their concentrate on U.S. Treasuries even as Middle East stress continue.
The Cboe Volatility Index increased 0.25 indicate 17.46 on Tuesday, about 3 points shy of the current high of 20.78 discussed Friday.
The variety of open call choices, derivatives agreements that assist financiers defend…

View On WordPress
0 notes
Text
Long-term holders of Bitcoin BTC/USD, along with a significant portion of short-term holders, are showing tendencies to retain their assets for extended durations.This indicates that so-called whale investors, those who have maintained large Bitcoin reserves inactive for prolonged periods, are likely to reallocate or potentially liquidate their holdings during these pivotal moments.On-chain Bitcoin activity has reached unprecedented levels in terms of new address creation, according to a Bitfinex report.Interestingly, this surge is primarily driven by short-term holder supply, allowing the assets held by long-term holders to consistently hit new highs as the former group liquidates.This pattern underscores the commitment of seasoned investors to hold onto their assets within the current price bracket.Despite the broader market's recent relief, as evidenced by the CBOE volatility index settling around 18 points, a level not seen since May, Bitcoin's behavior has been notably distinct.Historical data reveals that Bitcoin has only experienced positive growth in September thrice, with each instance followed by a profitable October.As the crypto community delves deeper into these market dynamics, discussions about such intricate financial patterns are anticipated to be a focal point at the upcoming Benzinga's Future of Digital Assets conference on Nov. 14.Bitcoin showcased resilience during the majority of the stock market's recent downturn, rallying when the broader market showed signs of recovery.The cryptocurrency concluded the month at a value of $26,980.However, the Bitcoin options market is hinting at potential volatility on the horizon.The current options implied volatility stands at 36.4%, while the historical volatility is pegged at 27.1%.The previous week has been marked by notable fluctuations and significant market movements. A pronounced increase in taker buy volumes typically indicates retail investors broadening their portfolios across a diverse array of coins.While Bitcoin has registered modest growth this week, seemingly countering the S&P 500's downtrend, lesser-known coins have witnessed a surge in value.Read Next: Chainalysis Drops A Layoff Bombshell Amid Crypto Market Turbulence
0 notes
Last Seen Blogs


rachelosangeles
Untitled

amelia-augustyn
Amelia Augustyn

astrologylife1
Experience Astrology

signalsfromvega
the universe. dinos. nerd stuff.