
sienadesi
DESI Research
An investigation of the physical properties of central (cluster) galaxies in DECaLS
6 posts
Don't wanna be here? Send us removal request.
Last Seen Blogs
disney-aesthetic
Disney-Aesthetic

mongoose-croft-main
my main blog

malinkn100
Sin título

koifishing
stuck in a eternal state of self-destructive rage

some-spo0000
‘Spo 🦋
Photo
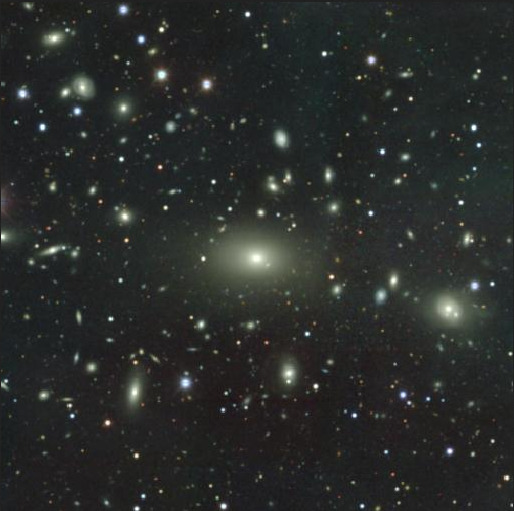
This is a cutout of the galaxy cluster 002749. It is among the top 10 richest clusters in the DECam survey.
0 notes
Text
Monday, June 1
Trying to finish my cluster_locations.py code, having issues trying to match redMaPPer and DECam clusters. I must not be accessing the files correctly because the matching function is correct. However, I was able to create a numpy array of size n which sorts the clusters by lambda_chisq, and then by creating a for loop I can access the data for the other keys for a particular lambda_chisq value.
##############################################################
nrich = 3
rich = np.argsort(rmap_out[’lambda_chisq’])[::-1][0:nrich]
stamp = ‘512′
for ii in range(nrich):
print(rmap[’ra’][rich[ii]], rmap[’dec’][rich[ii]])
ra = ‘{:6f}’.format(rmap[’ra’][rich[ii]])
dec = '{:6f}'.format(rmap['dec'][rich[ii]])
outfile = 'cluster_{:06}'.format(rich[ii])
url = 'http://imagine.legacysurvey.org/jpeg-cutout-decals-dr1?ra='+ra+'&dec='+dec+'&pixscale=2&size='+stamp
print(url)
os.system("wget "+url+" -O "+outfile+'.jpg')
os.system("wget "+url.replace('jpeg','fits')+" -O "+outfile+'.fits')
##############################################################
The outputs are ‘ra’ and ‘dec’ coordinates, as well as the legacysurvey url which should be a jpeg cutout of the cluster at the printed ra and dec coordinates.
0 notes
Text
Richness
One of the properties of the clusters I am studying is called richness, which is a measure of the number of galaxies associated with a particular cluster. Since galaxy clusters are hard to define by themselves, the existence of background galaxies further complicates an accurate richness measurement. In the case of the redMaPPer survey, optimization of richness estimates were achieved by the empirically-tested method of “estimating membership probabilities for every galaxy” in a cluster. Using spectroscopic data it is possible to obtain information about a galaxy or galaxy cluster, and there is an important mass-richness relation that can also verify whether a richness estimate is accurate.
The probability of a galaxy belonging to a cluster can be modelled by the equation:
p=(lambda*u*(x|lambda)) / ((lambda*u*(x|lambda)) + b(x))
where lambda is the number of cluster galaxies, u*(x|lambda) is the density profile of the cluster normalized to unity, and b(x) is the background density (non-member galaxies).
Sources:
E.S. Rykoff et al. Redmapper I: Algorithm and SDSS DR8 Catalog. 2014
http://ned.ipac.caltech.edu/level5/March02/Sarazin/Sarazin2_3.html
0 notes
Photo
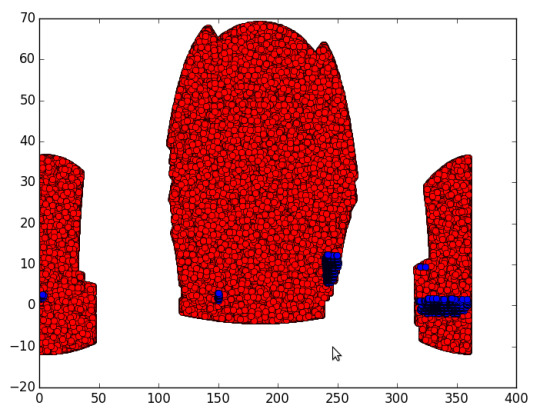
This graph represents all of the locations of the redMaPPer (red dots) and DECam (blue dots). The intersection of red and blue is where I will be examining galaxy clusters. The x-axis is right ascension, and the y-axis is declination.
0 notes
Text
Week 1
To start, I have been accessing data in both the Dark Energy Camera (DECam) and the Sloan Digital Sky Survey (SDSS) red-sequence Matched-filter Probabilistic Percolation (redMaPPer). Using a function called spherematching, which takes RA and DEC inputs, and a distance in degrees, I can determine which redMaPPer clusters also belong to the DECam footprint, since information about clusters in redMaPPer that haven't been surveyed by the DECam are not useful. From there, I will be taking the 3 “richest” clusters and making a cutout for each of them. More on what it means to be a rich cluster soon.
0 notes