
Last Seen Blogs


kumawatkarthik-blog
Untitled

brianchandlerrealestate
Parker Colorado Realtor
Video
vimeo
HeartLIFE's Story Here is a visual story of the design process of collaborating technology and a social health problem, to create a solution. Taking on mental health to take a step to rewire Melbourne's stigma of talking and support the acceptance of mental health issues. Creating a supporting nextwork to bring the city together, by creating positive support experiences. Which will hopefully allow for the heart recovery journey of mental health to improve. HeartLIFE was a passion that took me to a field of medical aid, I hadn't experienced before and will become a interest for design in the future. Knowing your heart is, knowing your health ❤️❤️
#heartbeat research#prototype#interactive design#sensor technology#melbourne technology#medical aid#technology
0 notes
Video
vimeo
HeatLIFE Biofeedback System This video shows the biofeedback visual display. Showcasing through colour, pattern and sound of the stages emotional reactions linked with ones heartbeat. Showing the journey of ones heart, illustrating a story to help communicate, a situation or problem wanting to be spoken about. Aiding an experience to connect people with the right people to positively aid and support, during a personal experience.
0 notes
Video
youtube
HeartLIFE Prototype This video showcases the prototype experience explored during the visualisation of led light and processing patterns that linked with the biofeedback of ones heart rate. Take a look
0 notes
Link
HeartLIFE Connection Working on the visualisation of the biofeedback was very important, but as important as communicating of the visualisation. Understanding I was trying to create a support network that could be used at a touch of a hand 24/7 similar to link when the bracelet would be worn. Capturing a social media style of Facebook and snap chat to provide a safe environment for people to shear with connections or seek professional advice. Keeping a clam and positive experience, allows for the user to be able to feel comfortable and in control during the process. Understanding that mental health isn't solved in a day, allowing to see back at poor day and great days, gives the user a place for reflection. Helping improve physical and physiological health at the same time.
0 notes
Photo
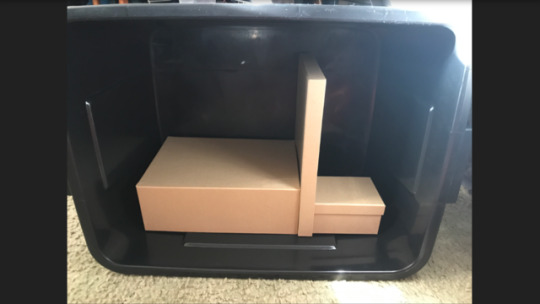
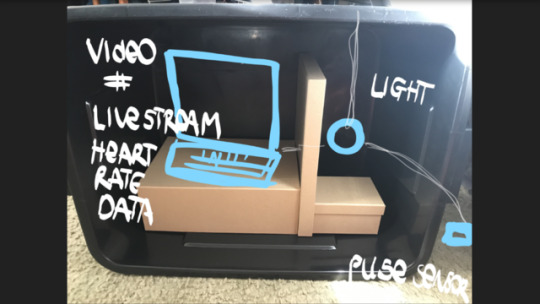
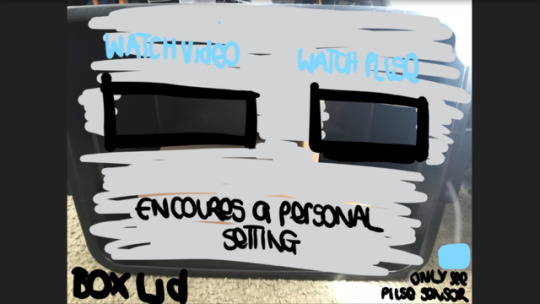
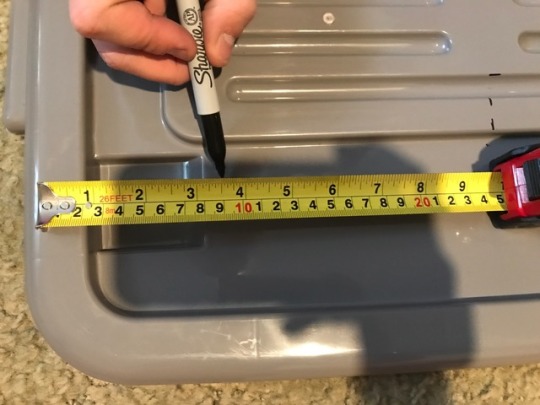


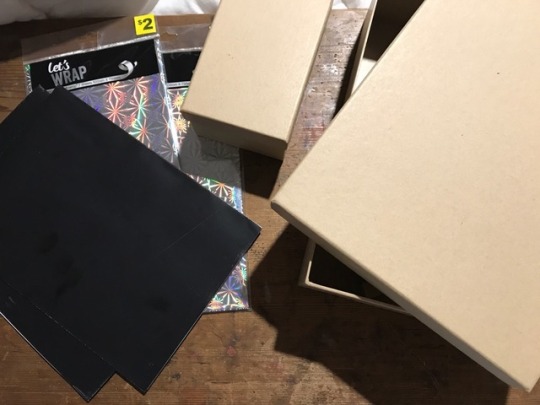
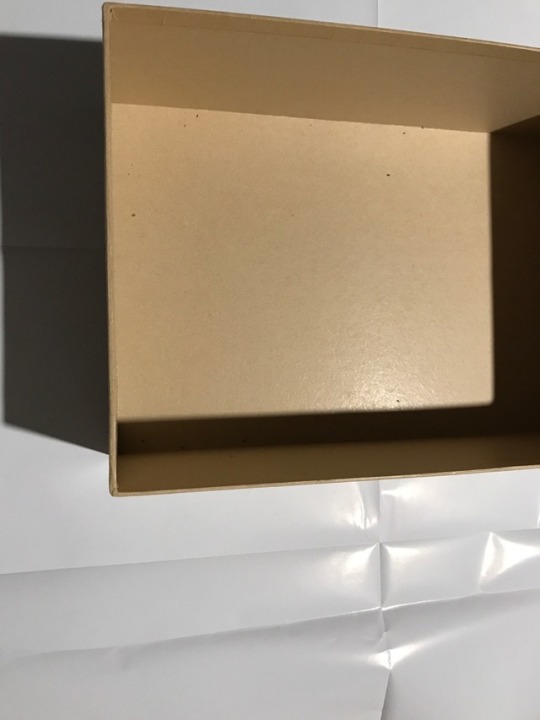
Exhibition of HeartLIFE Wanting to create a personal experience, having the data enclosed with the box, gives a interest to a curiosity to what's inside the box. Similar to the meaning of what's inside us. Creating peaking holes gives a neat method for me to house all the wires in as well. I'm passionate about my experience and can't wait to trail the biofeedback system. Heart in a box
0 notes
Photo

Processing Biofeedback The next stage was exploring new processing codes to display the biofeedback in different formats. Understanding that not all feedback systems visually would work, this was trial and error stage. Trying to keep the main focus of showing the biofeedback in a way that would allow for the user to change and enhance an experience, using it as a personal toolkit for human physiology. This stage was really enjoyable, learning a new program and seeing the language of the code reflect upon the visualisation of the biofeedback, was a successful design moment.
0 notes
Photo
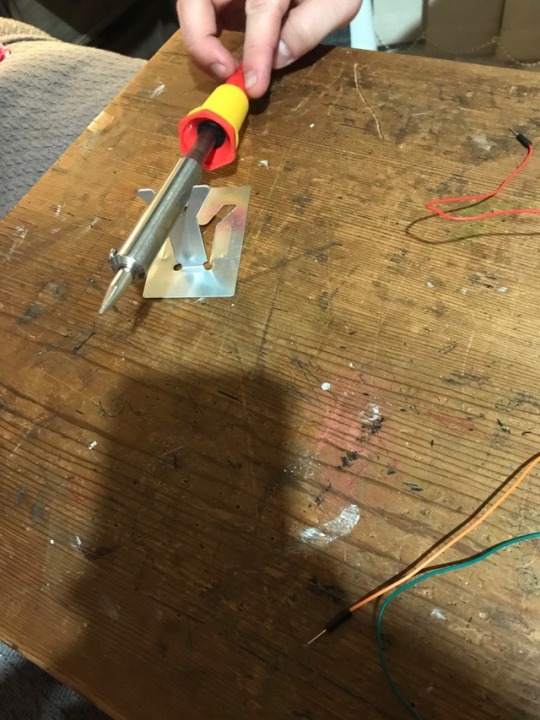
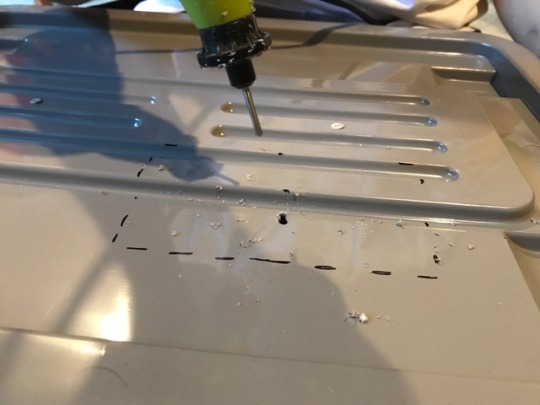
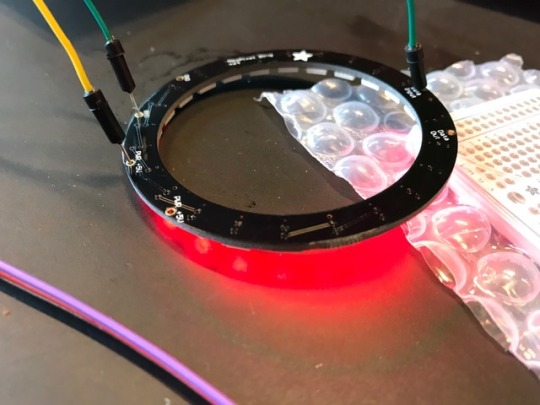
Stage two "Soldering" Making the connections and wires appear neatly is important. Soldering provides a neat and affective joint for the wires to the led light ring. Having had experience soldering prior, this stage was quick and effective. Rewiring after soldering to ensure correct connection, was successful.
0 notes
Photo
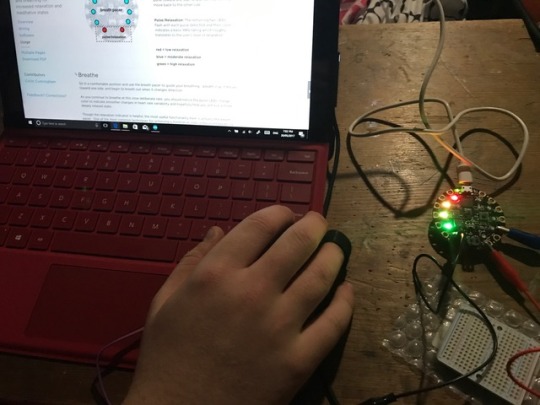
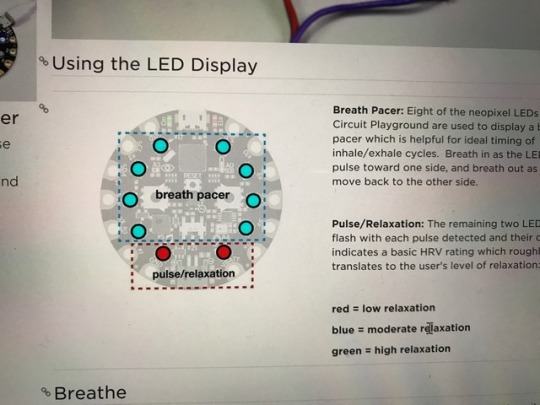
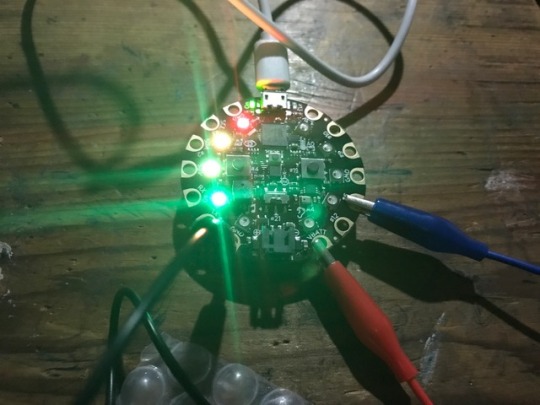
Heartbeat Meditation Training Taking a new system of focusing upon the biofeedback from the heart beat, that's link with breathing. Looking at how the heartbeat is link with the breathing that reflects upon the emotional state a person is in. Seeing the simple but effecting lighting systems of three colours like a traffic light to put the user in three different stages. Still a great training method of body awareness, but not the right biofeedback visually inspiring to design. Research: https://blog.adafruit.com/2016/07/20/monitoring-meditation/
0 notes
Photo
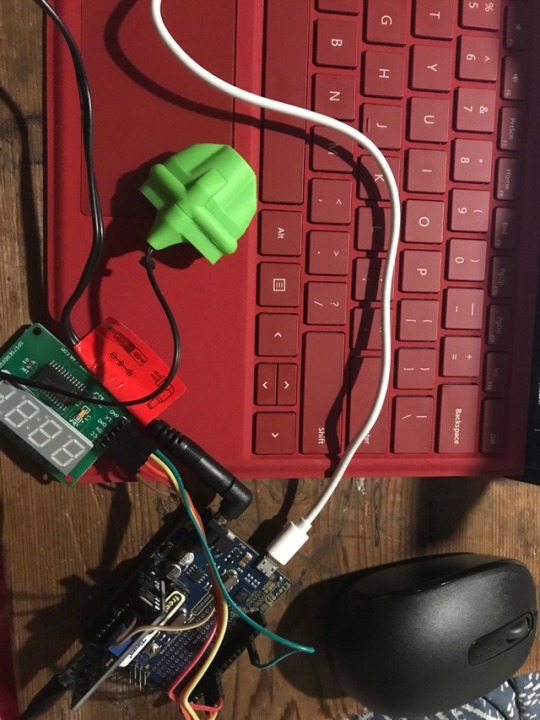
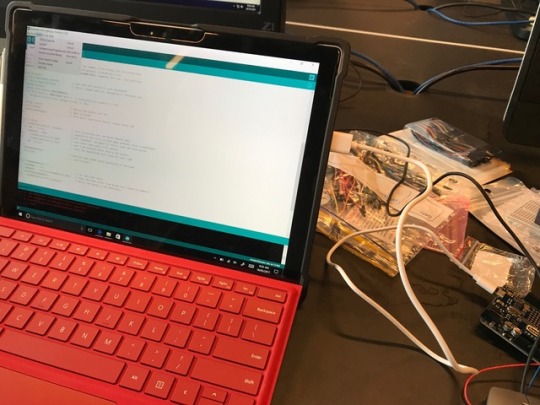
Scoreboard Biofeedback System Looking and trailing different heart rate sensors was a positive and important research stage. Seeing how the visualisation of the numbers could affect the biofeedback reaction. This gave the design decision to not take this pulse sensor, pass the trailing stage. This would work well for physical fitness biofeedback. Research: https://circuitdigest.com/microcontroller-projects/heartbeat-monitor-project-using-arduino
0 notes
Photo
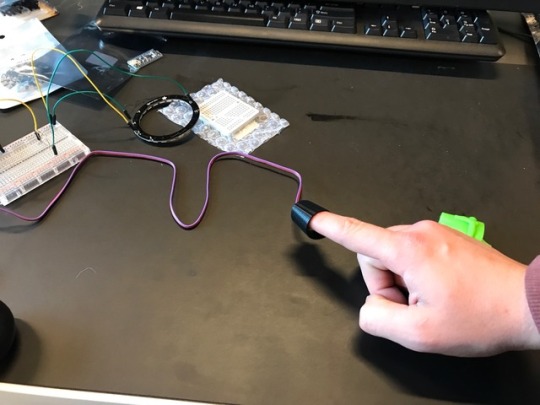
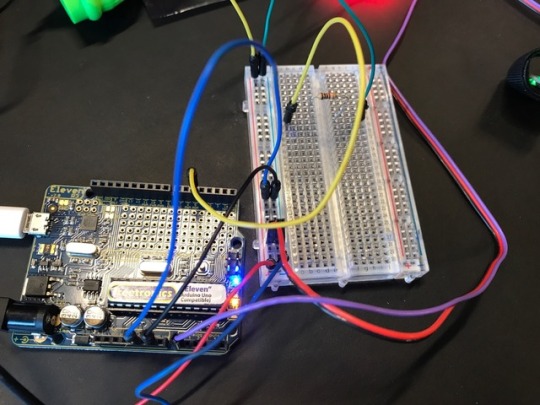
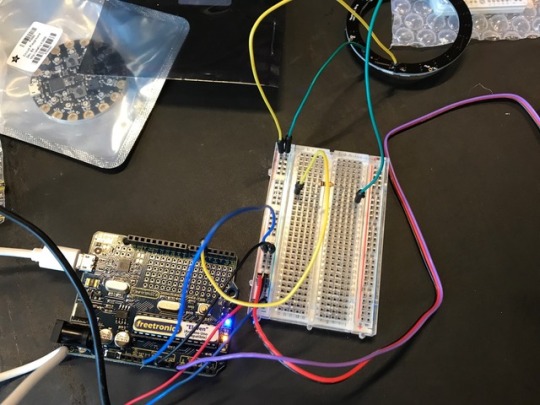
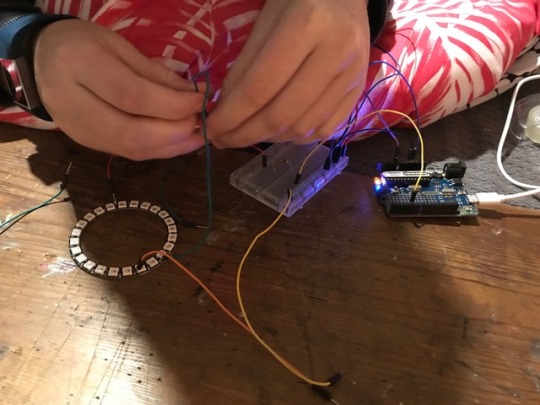
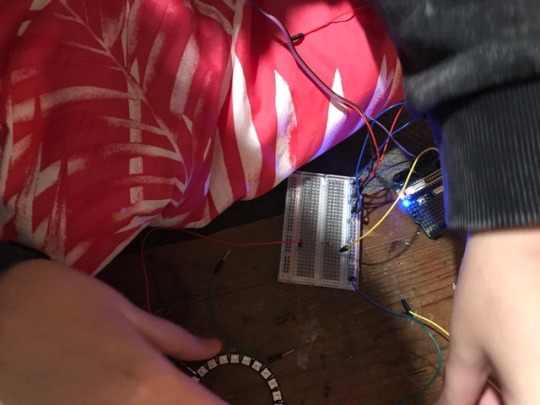
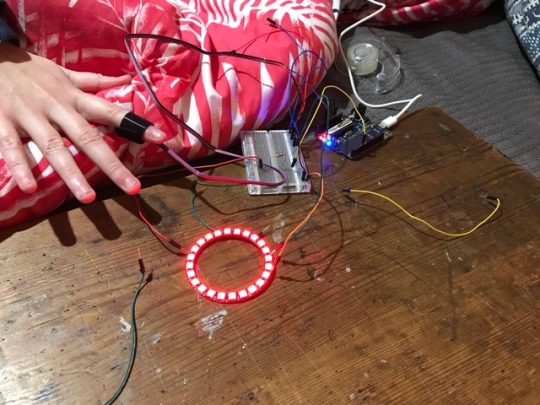
Pulse Sensory Led Light Taking the next stage involved new coding and biofeedback visually displayed through the pulse of a heartbeat. Taking an interesting method of biofeedback, giving the person an experience of seeing and feeling the heartbeat. Still in early stage, but progressing to improve a biofeedback experience. Research; https://learn.adafruit.com/pulse-sensor-displayed-with-neopixels/breadboarding-the-circuit
0 notes
Photo
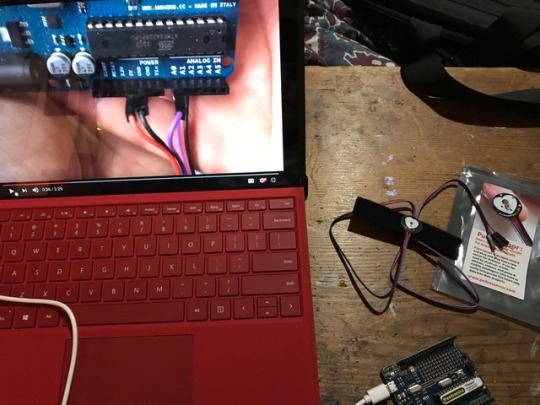
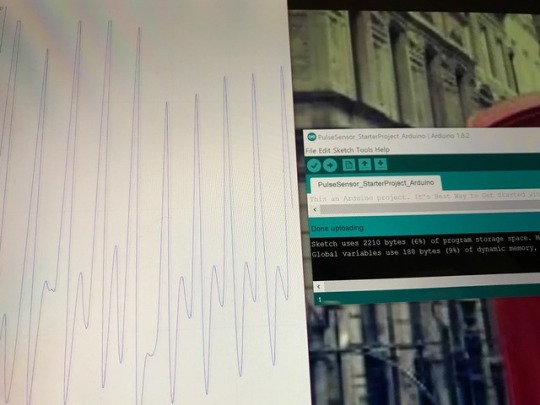
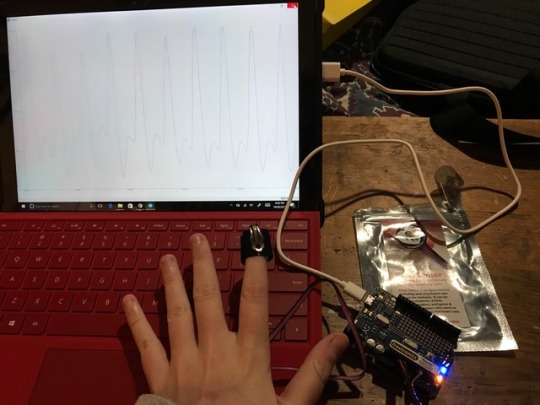
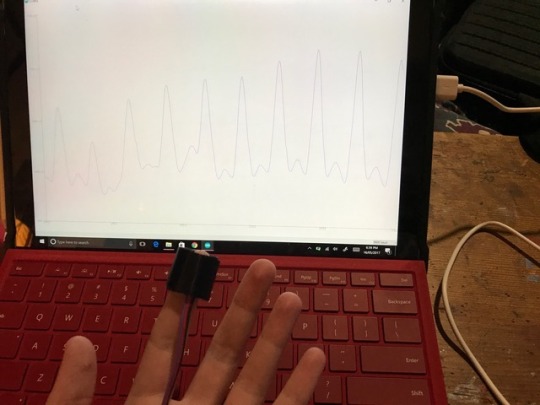
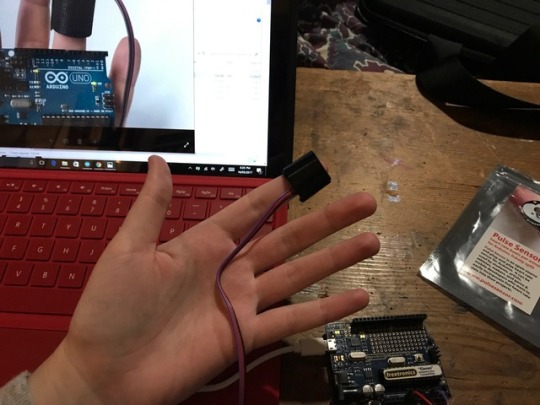
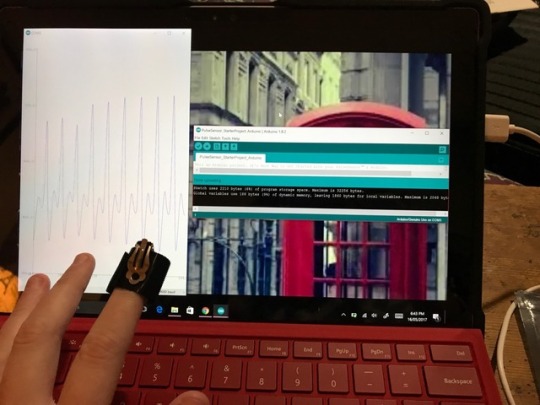
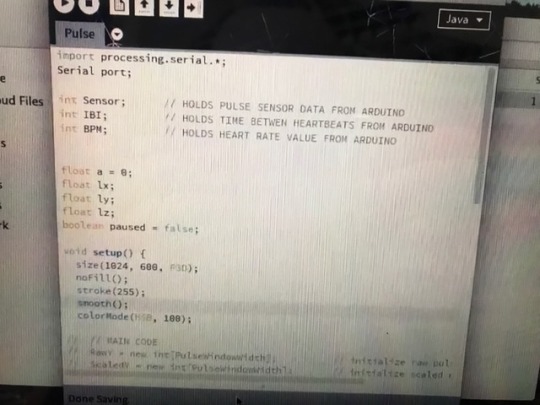
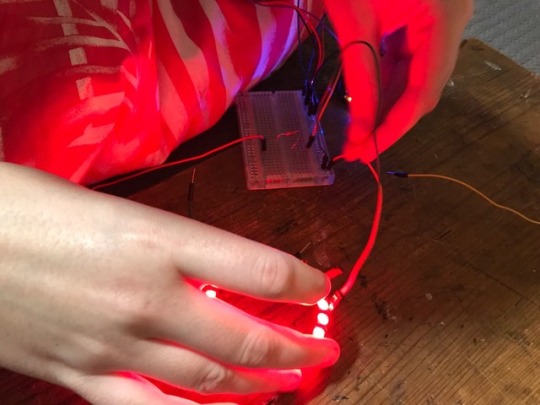
Pulse Sensory
Once gained the pulse sensory equipment, trailing visualisation of the heart beat and knowing it was mine, was an achievement. Driving passion to take the development from a line biofeedback system to beyond.
Correctly understanding the different stages and complexity of the heartbeat was visually being expressed simply with a line and a number.
Knowing this is just the begging is a positive start, but exploring more visualisation of the data is the next stage.
Research; https://youtu.be/82T_zBZQkOE
0 notes
Photo
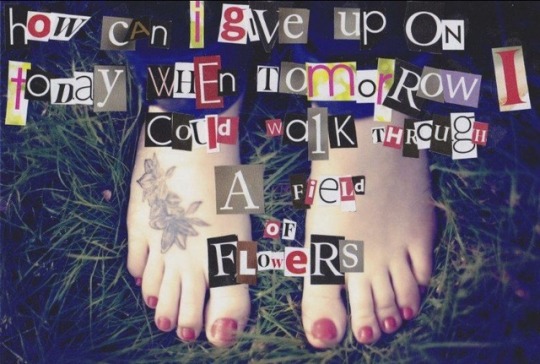
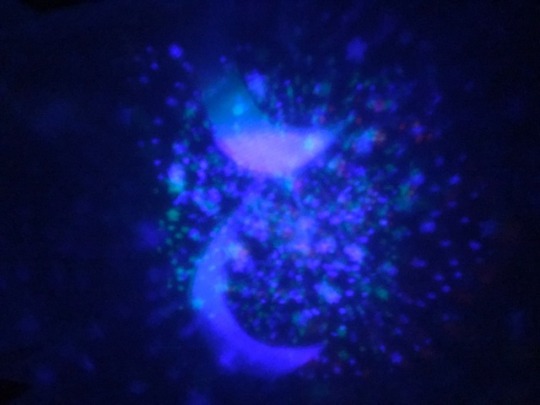
Mental Health Visualisation
What does mental health look like?
Before looking at how to illustrate the visual data, it was important for me to gain research in to how people think and see human physiology. Allowing for a expectation and reality of what it is, plays a dramatic role in the effects of negative and positive experience.
Seeing the interest in colour and most important the uncertainty of what the content is, but the powerful message it showcases
1 note
·
View note
Photo


Mental Health Expression Understanding mental health is very hard, as it affects people in a very person way. Providing support can also come in different forms and methods. However the improvement part of the journey one will go one during mental health is the understanding and control of support. Having the networks available to encourage a personal positive experience, during this time. This feedback system gives direction and support for motivation for change.
0 notes
Photo
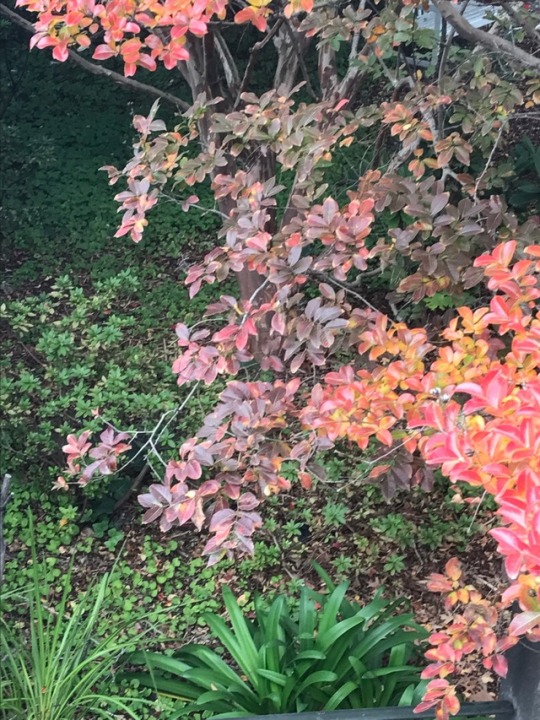

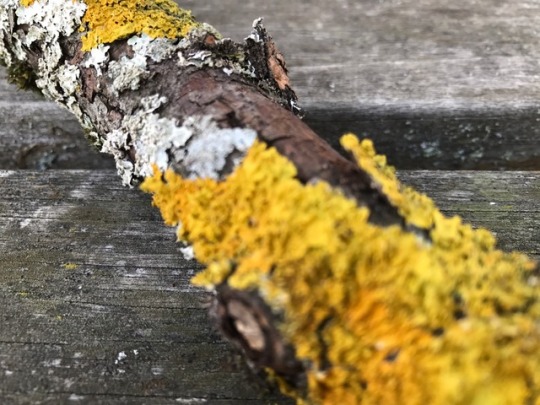


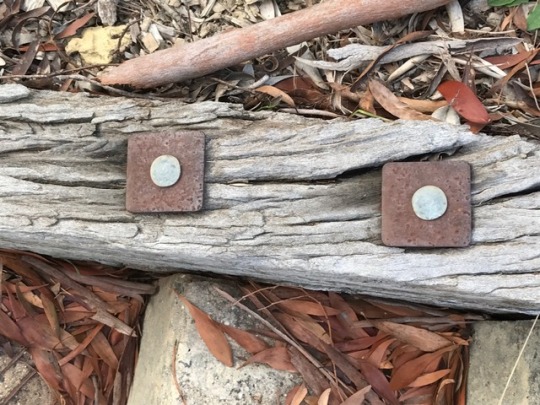
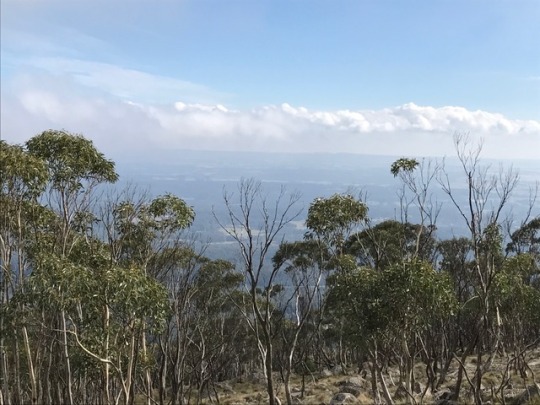

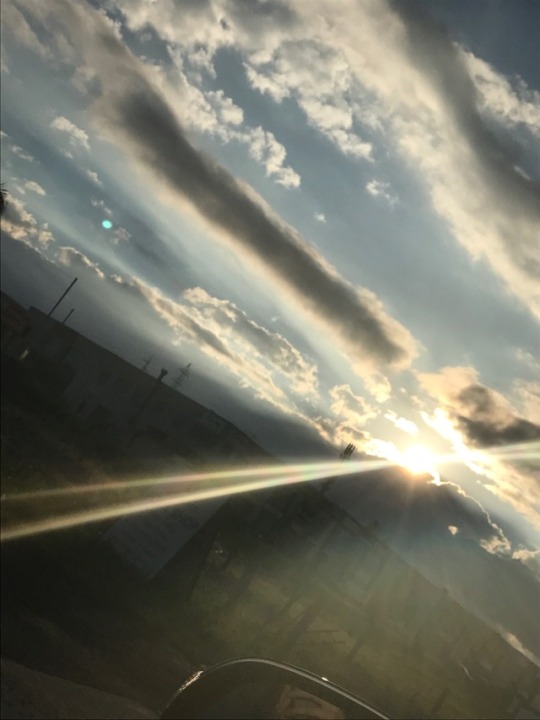
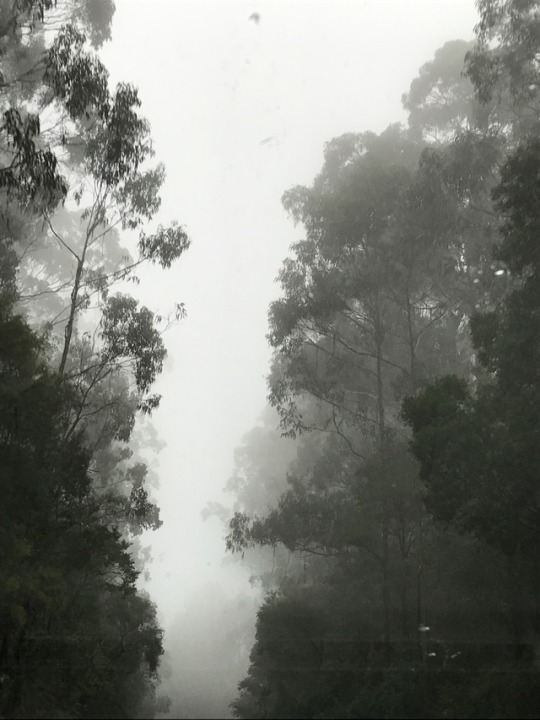
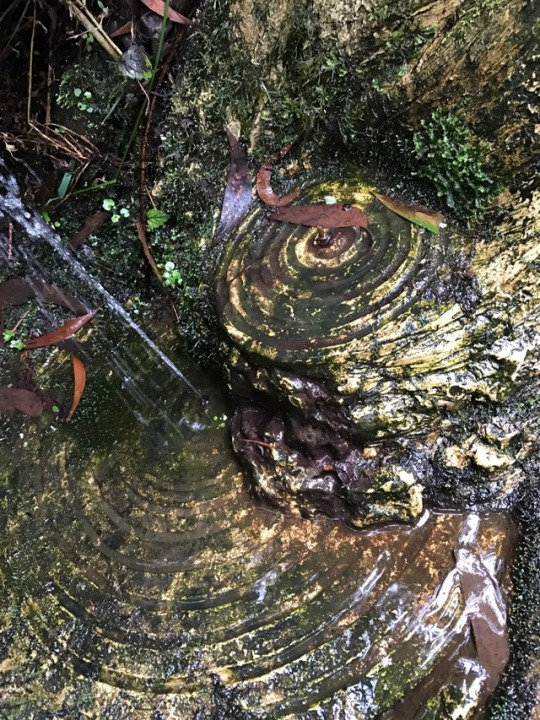
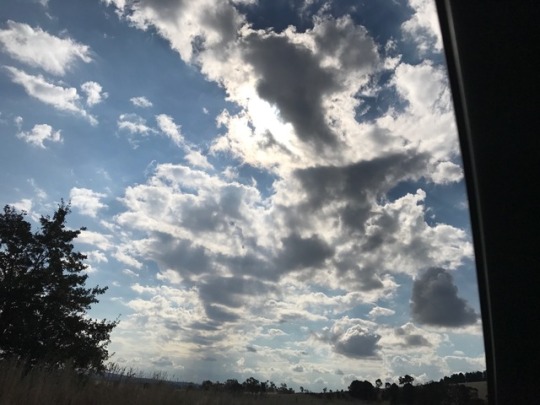
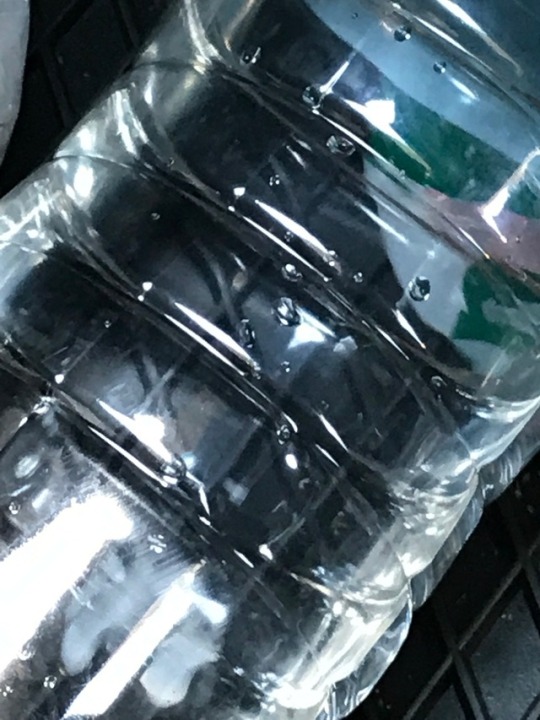
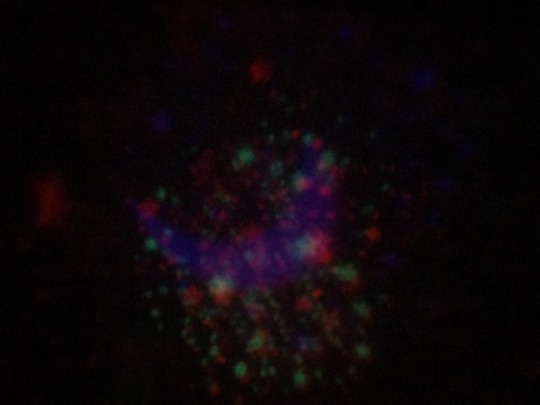
The Colour of the Country
Seeing the contrast in sensors in the country highlights the tone and texture of colour and patterns in the environment. Seeing how the humans sensors of sight, sound and smell have a significant relaxing tone to ones heartbeat.
Creating a new sensory system to help relaxation and be able to change a person’s emotion from a change in environment. Showing the rich colour compared to the city can significantly improve an experience, been taken away beauty of nature.
0 notes
Video
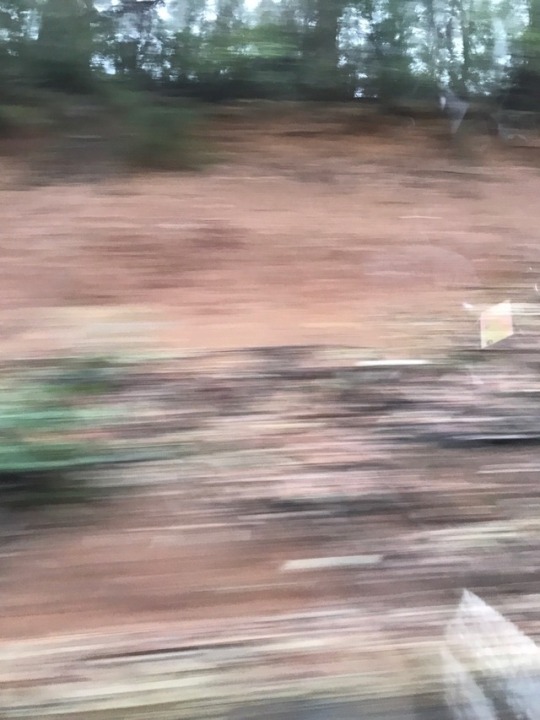
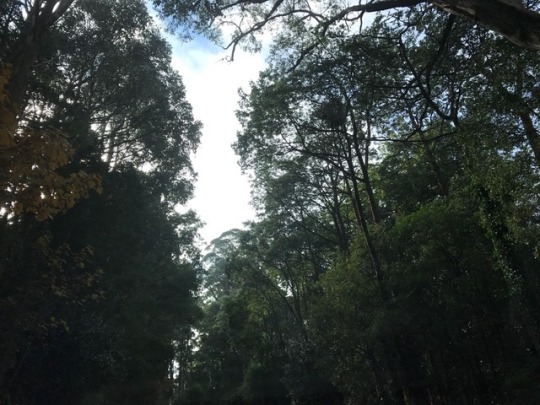
Sound of Environment Researching the level of sound and objects within an environment and seeing the link of a person's heart rate. Taking the concept that the city is always busy, to see what a person's emotions would react within a busy and loud environment. Finding people felt stressed, but more productive within a city environment
0 notes
Photo
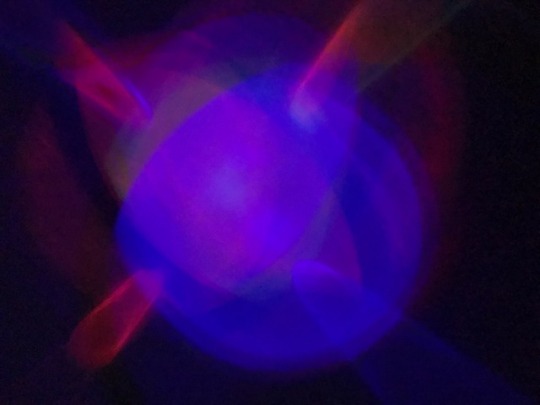

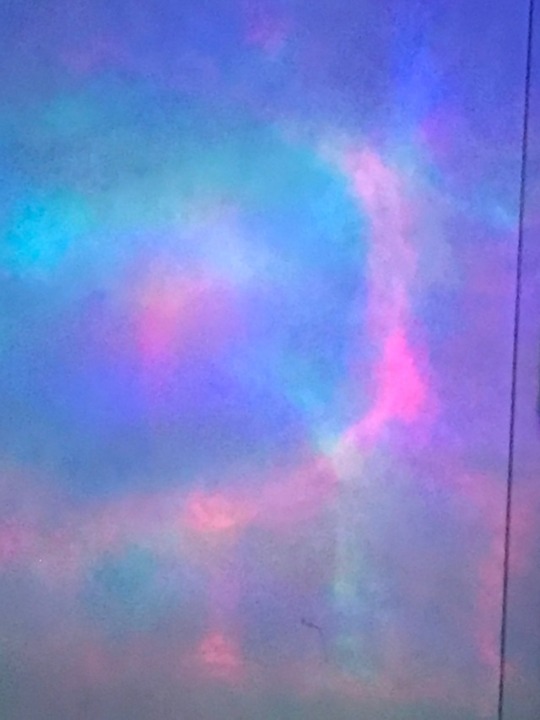
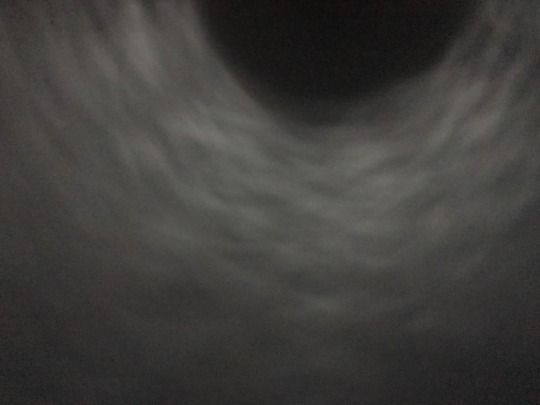
Lighting Imagery Research Being inspired to focus upon the visualisation of the data, drew me to lighting imagery. Seeing the mix lighting affects giving different emotional effects upon the images. Allowing me to take a deeper research style of understanding the storytelling of a image to a heartbeat. Allowing for people to explore the different story or situation a person would or could be in, if that was their biofeedback heart rate visualisation.
1 note
·
View note
Video
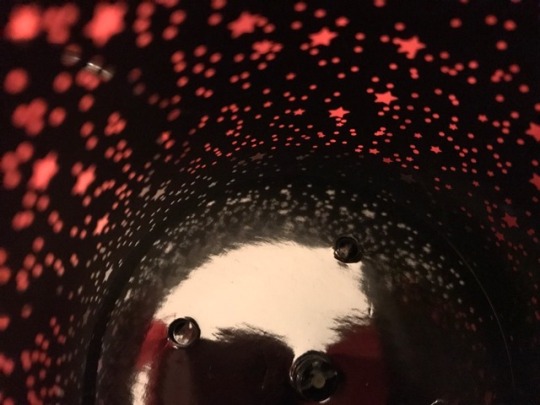
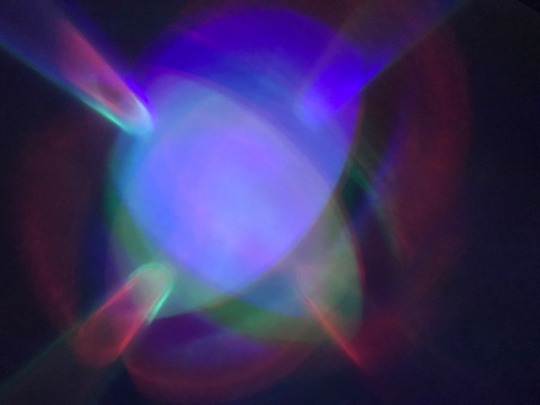
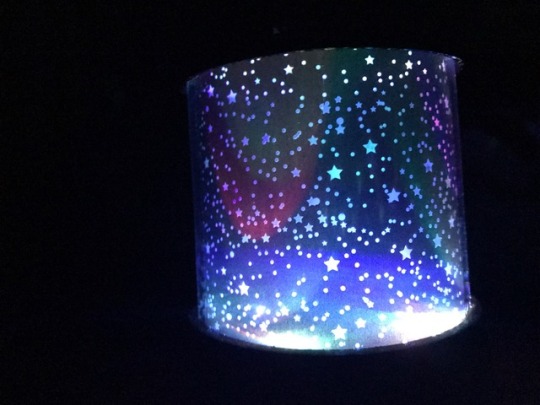
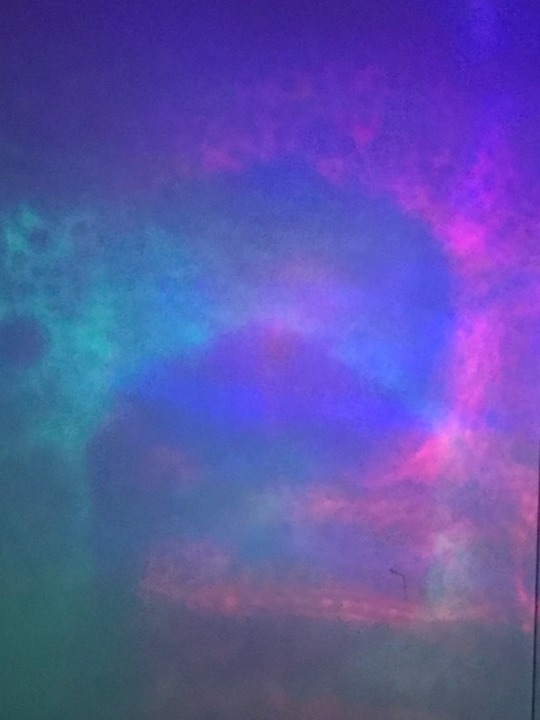
Colour Data Visualisation Trialling different lights to see the reactions off heart rate change. Seeing the data similar to George Khut's style of allowing the person to become within one's self to be able to read their true body's messages. Magically using a child's night light to explore methods of relaxation, but the beautiful visualisation of the colours and story it tells through light.
0 notes