
jimoshaughnessy
What Works on Wall Street
Jim O'Shaughnessy is the Chairman and CEO of O'Shaughnessy Asset Management (OSAM). Jim is the author of four books on investing, including What Works on Wall Street, a BusinessWeek and New York Times Business bestseller.
46 posts
Don't wanna be here? Send us removal request.
Last Seen Blogs

hbacon456
Sem título

k0shii
𝐄𝐉𝐈𝐑𝐎𝐔'𝐒 𝐏𝐑𝐄𝐓𝐓𝐘 𝐆𝐈

fuckallthishell-blog
Vick^^

topnotxhlifestyle-blog
Changing a lifestyle while abroad

digitalebook
Untitled
Text
Mistakes were Made. (And, Yes, by Me.)
It’s part of human nature to want to be right. It informs our view of our self, and, especially if we take a public stand, we commit to it much more strongly than we would otherwise. In his excellent book, Influence: The Psychology of Persuasion, Robert B. Cialdini devotes an entire chapter to it—Commitment and Consistency. Once we commit to something and take a stand, we are loath to change our minds, even in light of new information that contradicts our stance. Of course, this sometimes leads to huge mistakes, and is often the reason our investments go awry. We hate cogitative dissonance and will usually do anything to hang on to our stated positions, even when, especially when, they are wrong.
I thought it would be an interesting exercise to look at all the times where I got it almost entirely wrong, not for self-abasement, but rather as an exercise in how we can learn from our mistakes and still go on to do very well in life and our chosen careers. Thus, in no particular order, let’s look at things I got wrong, and what I learned:
1. An early faith that no-load funds would destroy those offered by financial advisors for a fee lead me to miss a huge opportunity.
In the mid-1990s, I had a relationship with one of the biggest brokerage houses in the United States, and after the initial publication of my book, What Works on Wall Street, my firm was enjoying a lot of interest from investors. We decided to open a mutual fund family, and one of my colleagues at the brokerage house suggested that I open load funds, so that their army of advisors could offer them to the public. The advisors at the firm were already offering another portfolio of mine and everyone I talked to brokerage thought that this was an easy decision. It would have allowed my firm to take huge advantage of the momentum we were having in other areas of our business and give the brokerage firm’s advisors access to what were among the first factor-based funds. I declined.
My unwavering belief that no-load funds were the only future led to a huge mistake. I didn’t understand then, as I do now, that investors who have help with their investments from advisors many times have an advantage over someone simply left to their own devices. I was in my mid 30s and believed that it was
obvious
that all investors would go the no-load route and
oblivious
to the fact that at that time, most investors preferred to work with advisors (And still do.) What could have been a huge jumpstart in the mutual fund business was lost, and even though our no-loads did okay in attracting investors, I missed several obvious opportunities for my firm. Indeed, at the time, we called our funds “Strategy Indexes”

which would have given us an enormous head start on what have come to be called Fundamental Indexes, so, this error had a compounding effect.
I think the lesson here is understanding that just because you have a belief or preference, however strongly held, it doesn’t negate those who differ with you. Being a true believer in almost anything does not lead you to make the best choices nor does it allow you to approach things with a more open mind. Had I been less dogmatic, I could have taken advantage of a rare opportunity for my relatively new investment management firm to partner with one of the most powerful brokerage firms on the street and potentially popularized factor-based investing to a wide group of investors much earlier than ended up happening. I think the important lesson here is that there are many legitimate paths to succeeding, and you should avoid dogmatic responses and keep an open mind, as long as the alternatives are legitimate and can help others.
1. In the first few editions of my book, I proclaimed price-to-sales to be the “King of Value Factors.”
In 1996, when the first edition of my book came out, I was super excited to be offering a compendium of the actual long-term results of all of Wall Street’s favorite measurements for determining if a stock was a good investment or not. At the time, I only looked at individual factors and price-to-sales proved itself to be head-and-shoulders above all the others. Other than a great book by Ken Fisher called Super Stocks, which focused on how great the price-to-sales ratio was, at the time, it was a very obscure factor that wasn’t popular like PE or Price-to-book. That made me even more excited to proclaim it the “King of Value Factors.”
With hindsight (another nasty behavioral bias), this was a rookie mistake. Had I given it any thought, I would have remembered that you can make anything look good if you varied the amount of time in your analysis. But I thought, gosh, this is decades of data, surely things won’t change that much going forward. But, of course, they do. Instead of focusing on how value factors in general did in identifying attractive stocks, I rushed to proclaim price-to-sales the winner. That was, until it wasn’t. I guess there’s a reason for the proclamation “The king is dead, long live the king” when a monarchy changes hands. As we continued to update the book, price-to-sales was no longer the “best” single value factor, replaced by others, depending upon the time frames examined. I had also become a lot more sophisticated in my analysis—thanks to criticism of my earlier work—and realized that everything, including factors, moves in and out of favor, depending upon the market environment. I also realized that you were far better off seeing how a stock scored on a composite of value factors that took more aspects of the balance sheet into account.
The lesson? No single factor or fundamental piece of data is ever the answer or solution to the complicated question of how to pick stocks that outperform. For example, I have long been a fan of shareholder yield (Dividends+Net buy backs) but even though it performs well on its own, it performs much better when selected from a group of stocks that are very cheap; have good earnings quality and have a high conviction in their buybacks, as evidenced by percentage of outstanding shares they are buying. As Einstein is reputed to have said, “make everything as simple as possible, but not simpler.”
2. In the late 1990s, I was approached by the American Stock Exchange to do a series of ETFs based upon What Works on Wall Street. I declined.
This one makes me feel like Forrest Gump, only in reverse. I’ve recently read an interesting article on how our memories play tricks on us and fill in details that never actually happened, probably so that we can keep a consistent view of ourselves and decisions that we make. Luckily, I have been an inveterate journal keeper, so I am able to go back and see what I was thinking without the benefit of hindsight or new magical details inserted by my comforting brain. ETFs were pretty much brand new at the time, and I thought they were a great idea, but having just launched a mutual fund family, I was worried about channel conflict. I was also worried about endorsing a new, and as of that time, untested investment vehicle. (As you will see later in this post, I quickly overcame my objections to that at precisely the wrong time.) On top of these concerns, the fees would be tiny by the standards of the late 1990s. So, I passed.
I think the main lesson here is that sometimes you just need to jump in with both feet if you think something is a great innovation and worry about the other concerns later. I knew that ETFs offered several very attractive improvements over mutual funds, and I had the opportunity to have a large partner launch tie-in strategy with What Works on Wall Street. What’s more, we got on the investment world map by offering something that was new at the time—factor-based portfolios. I should have thought more deeply about how well two innovations tied together could have worked. But, I didn’t. I let the circumstances of the moment—new way of investing; new mutual fund family, relatively new company—blind me to the strategic opportunity at hand. I let tactics trump strategy, and I’ve come to believe that tactics should always be the servant to strategy.
1. I started a company called Netfolio in 1999. It was one of the first robo- advisors and I got a U.S. Patent for a “System and method for selecting and purchasing stocks via a global computer network.” In early 2000, I got a massive financial offer to buy a portion of the company from one of the largest Investment Banks on Wall Street. I turned them down.


What is it with me and large banks? Obviously, I was as wrapped up in the zeitgeist of the times, which thought that only “pure” online companies would go on to receive multi-billion-dollar valuations. At the time, venture capitalists and professional investors thought it beyond idiotic to have any association with “bricks and mortar” companies. They were so 20th Century. The rules were quite simple (and in retrospect, insane) that only pure-play Internet companies could get the backing to move to IPO, and so, I went against every instinct I had, and said no.
To really show you how easily people, and I mean ALL people, can get caught up in a mania, I made the decision to decline the investment even though I had written a scathing piece in April 1999 called The Internet Contrarian, in which I confidently wrote: “Because the numbers ultimately have to make sense, the majority of all currently public Internet companies are predestined to the ash heap of history. And even if we could see the future and identify the ultimate winner in e-commerce, at today’s valuations it is probably already over-priced.”
So, incredibly bearish on the Internet and the overpriced names, I nevertheless seemed to believe (hope?) that my Internet company was the exception to the rule. After all, there were a number of other VCs who were confidently saying they could offer even better terms without me having to link the company to the offending “bricks-and-mortar” legacy firm, which was, you know, a hugely successful actual business with actual revenues and earnings! Shudder. But such was the mania of the moment that it had all of us—even those of us who in our saner moments had looked at the actual numbers—and determined that the entire thing was unsustainable.
And then, the walls came tumbling down. In March, 2000, an enterprising, smart reporter I know at Barron’s named Jack Willoughby wrote a story called Burning Up in which he pointed out the simple math of the situation: “Internet companies are running out of cash—fast.”
Boom.
It seemed like that one story snapped everyone out of the delusional fantasy that the rules of economics had been repealed and that unicorns and rainbows could be monetized. The other VCs and their better terms? Vanished. Everyone saying legacy companies were destined for the dustbin of history? Silent. Lessons (re)learned?
Many.
I’m lucky that I keep journals in real time, in that it helps me avoid something we all face—hindsight bias. Our brains are very complicated, and they manage to fill in our memories with thoughts we didn’t think at the time; with things we didn’t know at the time. It’s almost impossible for us to accurately recall what we were thinking and the version our brain serves up to us is, to be charitable, very kind to us but also incredibly wrong. Here are some things I wrote down at the time:
1. Be humble—arrogance killed some of the best potential deals in history.
2. Take the money—when someone else wants to give you a lot of money for something you have, let them. Work out the details afterward.
3. Don’t overanalyze—everything will eventually break down and from some angle will not make sense.
4. Understand people’s motives—they are not always what they seem.
5. Understand how fragile the average person is—it will always come out at the worst possible time.
6. Murphy was an optimist—expect six-sigma events as normal, not extraordinary.
In another journal, I wrote that hubris—excessive pride or self-confidence—was an expert assassin of even well-founded hopes and dreams. Whom the gods would destroy, they first make great, especially in their own minds.
What’s the Point?
The point is simple—mistakes provide a lesson-rich environment. But you’ve got to own your mistakes. You’d be compounding them if you tried to point your finger at anything or anyone other than yourself. The most successful people I’ve met have usually also been the ones who not only made the most mistakes but also always owned them. If you have the ability to say “I was wrong” and truly believe and learn from it, you’re close to gaining a new superpower in life.
So many people refuse to own their own mistakes, blaming others, bad luck, bad timing, you name it. If life give you a choice to compete against any type of person, always pick the ones that think most outcomes are due to luck. Does luck play a part? Almost always, but I rarely think—outside of lottery tickets—it’s ever the overriding reason for an outcome. Having the ability to learn all the lessons you can from mistakes you’ve made makes you better prepared for the next time. For as Isaac Asimov said, “in life, unlike chess, the game continues after checkmate.”
10 notes
·
View notes
Text
Additional Thoughts from What Works on Wall Street, 4th Edition in support of AQR’s Recent Paper on Small-Cap Stocks
How Much Better Are Small Cap Stocks?
Most academic studies of market capitalization sort stocks by deciles (10 percent) and review how an investment in each decile fares over time. The studies are nearly unanimous in their findings that small stocks (those in the lowest two deciles) do significantly better than large ones. We too have found tremendous returns from tiny stocks.
The glaring problem with this method when used with the CRSP and Compustat datasets is that it’s virtually impossible to buy the stocks that account for a large share of the performance advantage of small capitalization strategies. We did a deep analysis of the non-investable microcap stocks (stocks with market capitalizations less than a deflated $25 million) and found that the returns generated were highly contingent on which stocks were allowed into the test and which ones that were excluded. For example, looking at the Compustat universe, Table 5-9 shows a great disparity of returns, depending upon your assumptions. Between 1964 and 2009, if you required stock prices greater than $1, but put no return limit and allowed for stocks with missing data to be included, the portfolio earned an average annual compound return of 28 percent. Yet, when you require that all stocks have share prices greater than $1, have no missing return data and limited the monthly return on any security to 2,000 percent per month, returns decline by approximately 10 percent, and the portfolio earns an average annual compound return of 18.2 percent. Finally, if you add no additional criteria and are willing to allow in any of the microcap names at any price with no return limit, you earn 63.2 percent per year!
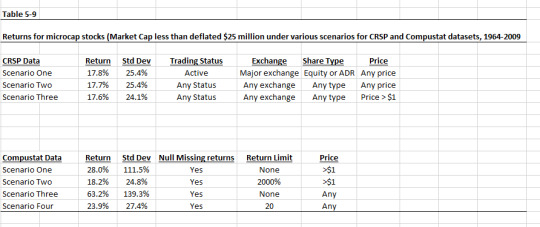
Obviously, the data for these non-investable microcap names will lead to very different returns based upon how realistic your assumptions are. Included with the Compustat data is the data from the CRSP dataset, leading me to conclude that if you could buy these tiny names, the most realistic average annual returns are between 17.6 to 18.2 percent over the long term. When you extend the analysis to include the period from July 1926 through December 2009 using the CRSP dataset, the average annual compound return for non-investable microcaps falls to 15 percent per year. Thus, the returns for this group are highly unstable, and the results you see are highly contingent upon which stocks will be allowed and which will be excluded. On December 31, 2009, there were approximately 2,401 stocks in the combined CRSP and Compustat datasets that I define as non-investable micro-cap stocks--where an investment of any size would send their bid/ask spread soaring, making the prices for those stocks a bit of a fiction. If an investor of almost any size –be they an institution or an individual trying to buy a significant position--tried to buy them, their prices would skyrocket.
When you look at the results for investable microcap names, those with market capitalizations between a deflated $50 million and a deflated $250 million, you see that most of the return for tiny stocks disappears; using the Compustat dataset between 1964 and 2009 microcap stocks earned an average annual compound return of 12.70 percent, whereas when using the CRSP dataset over the same period microcap stocks earned 11.82 percent per year. When you use the CRSP dataset to review the full period between 1926 and 2009, the microcap stocks compound at 10.92 percent per year, slightly better than our Small Stocks universe. A far better way to analyze the effects of market capitalization on a company’s returns is to evaluate all fully investable stocks by decile. When you look at the returns to the All Stocks universe by market capitalization decile, a fairly different picture emerges. Looking at Figure 5-2, we see that within the universe of investable stocks, there is an advantage to smaller cap stocks, but it is not of the magnitude of other studies that allow non-investable micro-caps. Here, the smallest decile by market capitalization had the highest compound return between December 31, 1926 and December 31, 2009 and the largest two deciles had the lowest compound returns, but the amounts are not huge: The tenth decile had the highest return at 10.95 percent per year whereas the first decile (largest stocks) had the lowest return at 8.82 percent, a difference of 2.13 percent.

2 notes
·
View notes
Text
Why You Should Write Letters to Your Kids as They Grow
“Letters are among the most significant memorial a person can leave behind them.”
~Johann Wolfgang von Goethe
I’ve always believed in the written word. Having to put your thoughts in writing helps you understand if you clearly understand what—and how—you want to say something. And if you keep written journals, there is simply no way to let hindsight bias take over, for there, in your own hand, is what you thought about something at the time, with revisions through selective memory impossible.
Writing clarifies. It illuminates. It helps you follow your own growth (or decay) in the way you look at the world and how your ideas have changed—or remained the same—over the course of your life. As someone with boxes and boxes of old journals, If I want to know what 21-year-old me thought about something, all I must do is pull out that journal and read. Sometimes I’m amazed by how much my views have changed—often dramatically—as I have made my way through life.
Yet equally telling is how little some of my foundational beliefs have changed. For the most part, I find that that, if anything, they have become stronger, better articulated, and better supported. I’m a big believer in reading as much as you can that takes the other side of what you think. We’re all subject to confirmation bias, and a great habit to build is to always search out beliefs that counter your own. If they make you change your mind, as has happened with me, then your original belief really wasn’t that sound to begin with, so, by always challenging yourself, you make your thinking stronger and more truly reasoned.
But the reason I’m writing today is to urge every parent reading this to get in the habit of writing your children a series of letters so that they too can understand you, and, with luck, themselves better. Having to articulate thoughts in a letter allows you and your children time to reflect on things in a way that is often difficult in the day-to-day events of your lives together. It’s something that I always wish my dad had done, as we had a rather difficult time understanding each other and I think a series of letters from him would have helped me understand him much better than I ultimately did.
Ideally, you should start as soon as you can and continue to write over the years. I started when my son, Patrick, was 7 days old and continued until my last child turned 21. As each child hit 21, my wife—the true marvel in the parenting hall of fame--would select photos and publish the letters in book form for each of my kids. The last letter of each book was written specifically to the child the book was for, but otherwise all the letters were for all my kids.
Below is the first letter I wrote which I hope spurs you on to do this for your kids. Rarely are things 100 percent win/win, but in the case of letters for your kids, that’s the reward for taking the time as your kids grow to have a conversation with the adult they will become.
April 22, 1985
Dear kids,
Firsts are exciting and somewhat perplexing. This is the first entry in a book I’m going to keep for you; its direction not yet known to me. Thus, the thought of giving you something created over the years excites me, but I am also perplexed about what I really want to write here.
I know that I don’t want this to be a diary, detailing the days, for although we already love you we know that a diary of when you eat and sleep wouldn’t be exciting reading. In some ways, I hope to be able to say all the things fathers want their children to know, yet so many times forget, or neglect to tell them.
If nothing else, you will see how I changed, from a 24-year-old brand new father, to one who has watched you grow up, and, with luck, grown up myself.
Most of all, you may be able to know both me and yourself better through this collection of “letters” and we must all strive to understand ourselves and those we love, for through our understanding and experience comes the wisdom that no one person can teach another, no school can transmit it. It must come from within, from learning, from logic and experience. If I could, I would describe it for you; I can’t. Perhaps you will agree when you are older.
I also want to tell you about me, my life, my thoughts, perhaps you can gain some understanding of yourself through understanding me. If I was going to describe my own impulses in a paragraph, it would be advice to you as well, so here, in Lao Tzu’s words, it is:
“He who knows much about others may be learned, but he who understands himself is more intelligent. He who controls others may be powerful, but he who controls and has mastered himself is mightier still. He who receives his happiness from others may be rich, but he whose contentment is self-willed has inexhaustible wealth. He who occupies a place provided for him by others may live a long life, but he who dwells in his own self-constituted place, even though he decays, is eternal.”
That bit of wisdom really embodies many of my goals, and many of my beliefs.
You will always be only as good, only as happy, only as successful as you perceive yourself to be. Happiness springs from within, never from without. Virtue too; honor; and love. All the things that make a life worth living. Thus, if you are unhappy, don’t look outside yourself for causes, the reside within; likewise, if, like me, you are happy, understand the source within your soul.
Love,
Dad
5 notes
·
View notes
Text
How To Arbitrage Human Nature
People want to believe the present is different than the past. Markets are now computerized, high-frequency and block traders dominate, the individual investor is gone and, in his place, sit a plethora of huge mutual and hedge funds to which he has given his money. Many have simply given up trying to earn alpha in the market and have given their money to index funds. Some people think these masters of money make decisions differently and believe that looking at how a strategy performed in the 1950′s or 1960′s offers little insight into how it will perform in the future.
But while we humans passionately believe that our own current circumstances are somehow unique, not much has really changed since the inarguably brilliant Isaac Newton lost a fortune in the South Sea Trading Company bubble of 1720. Newton lamented that he could “calculate the motions of heavenly bodies but not the madness of men.” Herein lays the key to why basing investment decisions on long-term results is vital: the price of a stock is still determined by people. If you chart price of the South Sea company’s stratospheric rise and then compare it with the NASDAQ in the 1990′s, you’ll see they are virtually identical. As long as people let fear, greed, hope and ignorance cloud their judgment, they will continue to misprice stocks and provide opportunities to those who rigorously use simple, time-tested strategies to pick stocks. Unless you believe that human nature will fundamentally change soon, using long-term studies of which stocks do well and which do poorly lets you to arbitrage human nature. Newton lost his money because he let himself get caught up in the hoopla of the moment and invested in a colorful story rather than the dull facts. Names change. Industries change. Styles come in and out of fashion, but the underlying characteristics that identify a good or bad investment remain the same.
Each era has its own group of stocks that people flock to, usually those with the most intoxicating story. Investors of the twenties sent the Dow Jones Industrial Average up 497% between 1921 and 1929, buying into the “new era” industries such as radio and movie companies. In 1928 alone, gullible investors sent Radio Corporation from $85 to $420 per share, all based on the hope that this new marvel would revolutionize the world. In that same year, speculators sent Warner Brothers Corporation up 962 percent—from $13 to $138—based on their excitement about talking pictures and a new Al Jolson contract. The 1950s saw a similar fascination in new technologies, with Texas Instruments soaring from $16 to $194 between 1957 and 1959, with other companies like Haloid-Xerox, Fairchild Camera, Polaroid and IBM being beneficiaries of the speculative fever. Closer to home, remember all the dot.coms of the late 1990s that soared on little more than a PowerPoint presentation and a lot of sizzle? And, of course, now we have Bitcoin…
The point is simple. Far from being an anomaly, the euphoria of the late 20’s; 60’s and 90’s were predictable ends to a long bull markets, where the silliest investment strategies often do extraordinarily well, only to go on to crash and burn. A long view of returns is essential because only the fullness of time uncovers basic relationships that short-term gyrations conceal. It also lets us analyze how the market responds to a large number of events, such as inflation, stock market crashes, stagflation, recessions, wars and new discoveries. From the past the future flows. History never repeats exactly, but the same types of events continue to occur. Investors who had taken this essential message to heart in the last speculative bubble were the ones least hurt in the aftermath. They understand that today’s events and news are mostly noise, and that only longer periods of time deliver the much more accurate signal. As Pericles said, they “wait for the wisest of all counselors, time.”
The same is true after devastating bear markets. Investors behave as irrationally after protracted bear markets as they do after market manias, leaving the equity markets in droves, usually at or near the market’s bottom. By the time they gather enough courage to venture back into equities, a good portion of the recovery has often already happened. Investors who remained on the sidelines in 2009 left between 50 and 75 percent of gains on the table, making it very difficult for them to catch up with the market.
We are always trying to second guess the market, but the facts are clear—there are no market timers on the Forbes 500 list of the richest people, whereas there are many, many investors.
0 notes
Text
Getting the Most Out of Your Equity Investments
As we approach 2018, I thought this final chapter from the 4th edition of What works on Wall Street might be a helpful frame of reference for equity investors.
“To think is easy. To act is difficult. To act as one thinks is the most difficult of all.”
--Johann Wolfgang von Goethe
Investors can learn much from the Taoist concept of Wu Wei. Taoism is one of the three schools of Chinese philosophy that have guided thinkers for thousands of years. Literally, Wu Wei means “to act without action” but in spirit means to let things occur as they are meant to occur. Don’t try to put square pegs into round holes. Understand the essence of a circle and use it as nature intended. The closest western equivalent is Wittgenstein’s maxim: “Don’t look for the meaning: Look for the use!”
For investors, this means letting good strategies work. Don’t second guess them. Don’t try to outsmart them. Don’t abandon them because they’re experiencing a rough patch. Understand the nature of what you’re using and let it work. This is the hardest assignment of all. It’s virtually impossible not to insert our ego or emotions into decisions, yet it is only by being dispassionate that you can beat the market over time.
We’ve lived through the most tumultuous market environments since the 1920s and 1930s since I originally published this book in 1996. A stock market bubble between 1996 and March 2000—the likes of which we had not seen since the late 1960s and before that the roaring 1920s—led many investors to throw out the investing rule book. The more insanely overvalued a company, the more it soared. Everyone talked of “the new economy” and how it really was different this time. Sticking with time-tested investment strategies during the stock market orgy was close to impossible. Month in, month out you had to stand on the sidelines, watching your reasonably-priced stocks do nothing while the over-priced “story” stocks soared. And, as often happens with stock market bubbles, just as the last sane investors capitulated and learned to love the stocks with the craziest valuations, along came the reckoning—all the previously gravity-defying stocks came crashing back to earth. Fortunes were lost and millions of investors lost their faith in the long-term potential of stocks. What’s worse is that after recovering from the bear market of 2000-2003, a new bubble appeared in real estate markets and the debt used to finance them. This new bubble popped in any even more destructive fashion than that of the dot.com stocks earlier in the decade and brought worldwide markets close to the brink of collapse, ushering in the worst bear market for stocks since the Great Depression. Investor’s faith in equity markets was almost completely destroyed by the great market crash of 2007-2009. The S&P 500’s loss of 37 percent in 2008 was second only to 1931, where it dropped by 43 percent. People were literally hoarding cash, terrified to make any investment in the stock market. And much as the bubble years gave birth to the idea that things really were different than in the past and we had emerged with a “new economy”, the bust years also gave birth to the concept of “the new normal.” To its advocates, the new normal meant that returns would be permanently lower going forward than they had been historically and there was really nothing that we could do about it. Money poured out of equities into bonds with investors desperate to avoid risk of any kind. The September 2010 issue of Institutional Investor had a cover story entitled “Paradise Lost: Why Fallen Markets Will Never be the Same”, in which the authors argue that “the financial crisis has discredited free-market capitalism and given its state-driven counterpart a boost.” Yet we are forever fighting yesterday’s battle without paying attention to what we can learn from historical events.
In markets moving from extreme speculation to extreme despair, believing in Ockham’s razor—that the simplest theory is usually the best—is almost impossible. We love to make the simple complex, follow the crowd, get seduced by some hot “story” stock, let our emotions dictate decisions, buy and sell on tips and hunches and approach each investment decision on a case-by-case basis, with no underlying consistency or strategy. On the flip side, when equity returns are horrible over a long period of time, we are far too willing to assume that stocks will never generate returns comparable to those of the past and abandon them in favor of less risky assets like bond and money market funds. Even fourteen years after this book was first published—showing decade upon decade of the results of all the various types of strategies—people were more than willing to throw it all out the window because of short-term events, be they good or bad. No wonder the S&P 500 beats 70 percent of traditionally-managed mutual funds over the long-term!
A Taoist story is illuminating: One day a man was standing at the edge of a pool at the bottom of a huge waterfall when he saw an old man being tossed about in the turbulent water. He ran to rescue him, but before he got there the old man had climbed out onto the bank and was walking alone, singing to himself. The man was astonished and rushed up to the old man, questioning him about the secret of his survival. The old man said that it was nothing special. “I began to learn while very young, and grew up practicing it. Now, I’m certain of success. I go down with the water and come up with the water. I follow it and forget myself. The only reason I survive is because I don’t struggle against the water’s superior power.”
The market is like the water, overpowering all who struggle against it and giving those who work with it a wonderful ride. But swimming lessons are in order. You can’t just jump in, you need guidelines. Our study of the last 84 years with the CRSP dataset and 46 years with the COMPUSTAT suggests that to do well in the market, you must do the following:
Always Use Strategies
You’ll get nowhere buying stocks just because they have a great story. Usually, these are the very companies that have been the worst performers over the full time period of our study. They’re the stocks everyone talks about and wants to own. They often have sky-high price-to-earnings, price-to-book and price-to-sales ratios. They’re very appealing in the short-term, but deadly over the long haul. You must avoid them. Always think in terms of overall strategies and not individual stocks. One company’s data is meaningless, yet can be very convincing. Conversely, don’t avoid the market or a stock simply because things have been bad over the short-term. Few investors could see the compelling valuation of the overall stock market in March 2009, yet it was at this time that stocks were a screaming buy and about to embark on a huge rally. If you had a simple rebalance strategy in place at the time which allocated between stocks and other investments, the strategy would have forced you to buy more stocks. But as Goethe’s quote at the beginning of this chapter makes plain, acting is hard, and acting in line with what you think is almost impossible. If you can’t use strategies and are inexorably drawn to the stock of the day, your returns suffer horribly in the long run. Remind yourself of what happens to these stocks by looking at charts of all the dot.com high flyers between 1998 and 2002 and the tables and charts for how value stocks came soaring back after the stock market bubble burst in 2000. If, try as you might, you can’t stick to a strategy, put the majority of your money in an index fund and treat the small amount you invest in story stocks as an entertainment expense.
Ignore the Short-term
Investors who look only at how a strategy or the overall market has performed recently can be seriously misled and end up either ignoring a great long-term strategy that has recently underperformed or piling into a mediocre strategy that has recently been on fire. Over the last 15 years, I cannot count the number of times investors have gotten extremely excited about our strategies as they were doing well relative to their benchmark and the same number of times that investors became despondent about short-term underperformance. Tragically, investors seem hardwired to inordinately focus on very short periods of time, often completely ignoring how the strategy has done over long periods of time. As investors, all of our information about returns is focused on extremely short periods of time. Witness everyone falling all over themselves to explain why the stock market has gone up or down in a single day! What’s funny is that over very short periods of time, the stock market is relatively impossible to forecast, yet when you extend your horizon, the market becomes far more understandable. As I mentioned in the introduction, if you look at the 50 worst ten year performances for the stock market, there is not a single instance where over the next ten years the stock market failed to go up.
The point is that at some time in the future any of the strategies in this book will underperform the market, and it is only those investors who can keep their focus on the very long-term results who will be able to stick with them and reap the rewards of a long-term commitment. You should always guard against letting what the market is doing today influence the investments decisions you make. One way to do this is to focus on the rolling batting average of how your portfolio is performing versus its benchmark. Much like we focus on the rolling base rates for all of the stock selection strategies we have tested in this book, you can do the same for your portfolios performance versus its benchmark. When you look only at how your investment portfolio has performed for the last quarter, year, and three and five year period, you are simply looking at a single snapshot of how you’ve done. Now, this might make you very happy if you’ve done exceedingly well for that particular period but it also might make you want to abandon your strategy if you’ve done poorly relative to other strategies available. In both cases, I would argue that you are potentially misled by only looking at a snapshot. What if it is December 31st, 1999 when you take a look at this snapshot? For an investor who had loaded up on pricey dot.com and tech stocks five years earlier looking at the snapshot and he or she will think they are a genius—my God, I will be able to retire in a few years if I keep growing my portfolio at this rate! Or how about an investor who had kept their portfolio devoted to small-cap stocks and large-cap value fare? They might look at how they’ve done and wince about the relative lack of great returns in their portfolio and be tempted to follow the same strategy as the first investor with a tech and dot.com heavy portfolio. By looking at the snapshot at that point in time and extrapolating it into the future, both investors would have been seriously misled. The tech-heavy portfolio went on to crash and burn just as the small-cap and value portfolio began to soar.
By focusing on how your portfolio is doing against a benchmark on rolling periods, you will get a much better sense for how you are continuously doing against the market and will be much more likely to be willing to stick with a strategy that may be underperforming recently but has an outstanding win rate versus the market over all rolling periods. It gives you continuous feedback that allows you to take the hills and valleys with greater restraint than if you simply looked at one point in time. It also lets you put recent performance into the historical context of the strategy—if you’re relative performance is down but still very much in line with what the strategy has done historically, you will probably be more able to stay the course.
Finally, this advice is equally useful after sharp draw downs for stocks. In March of 2009 I wrote a commentary for Yahoo Finance that was entitled “A Generational Opportunity” in which I argued that many investors were facing a once in a lifetime gift to purchase equities at valuations that we hadn’t seen since the early 1980s. I urged middle-aged investors to increase the equity allocation of their portfolio to 70 percent to take advantage of the fear that permeated the markets and for the most part the response was silence. People were so shell-shocked by what had happened over the previous 15 months that no amount of data would move them to take advantage of the situation. That’s why ignoring the short term may be both the hardest and best thing you can do for the overall health of your portfolio.
Use Only Strategies Proven Over the Long-Term
Always focus on strategies whose effectiveness is proven over a variety of market environments. The more time periods you can analyze, the better your odds of finding a strategy that has withstood a variety of stock market environments. Buying stocks with high price-to-book ratios appeared to work for as long as 15 years, but the fullness of time proves that it is not effective. Many years of data help you understand the peaks and valleys of a strategy. What’s more, sometimes a strategy might make intuitive sense, like buying stocks that have the greatest annual gain in sales, yet a review of the data tells us that, in the long-run, this is a losing strategy, probably because investors get so excited by those huge annual sales increases that they price the stocks to perfection, which is rarely achieved. Attempting to use strategies that have not withstood the test of time will lead to great disappointment. Stocks change. Industries change. But the underlying reasons certain stocks are good investments remain the same. Only the fullness of time reveals which are the most sound. Remember how alluring all the dot.com stocks were in the late 1990s? Don’t let the investment mania de jour suck you in—insist on long-term data that supports your investment philosophy. Remember that there will always be current market fads. In the 1990s it was internet and technology stocks, tomorrow it might be nanotechnology or emerging markets, but all bubbles get popped.
Dig Deep
If you’re a professional investor, make certain to test any strategy over as much time and as many seasons as possible. Look for the worst-case scenario, the time it took to recover from that loss and how consistent it was against its relevant benchmark. Note the largest downside deviation it had against the benchmark and be very wary of any strategy that has a wide downside deviation from it. Most investors can’t stomach being far behind the benchmark for long.
If you’re an individual investor, insist that your advisor conduct such a study on your behalf, or do it yourself. There are now many websites where you can do this research. With all the tools now available to individual investors, there is simply no excuse for not doing your homework. A wonderful resource for individual investors is the American Association of Individual Investors. Their website (www.aaii.com) is chockablock full of helpful ideas as well as an entire section devoted to stock screening. Check the links at www.whatworksonwallstreet.com for any new sites that might appear to aid you in your research.
Invest Consistently
Consistency is the hallmark of great investors, separating them from everyone else. If you use even a mediocre strategy consistently, you’ll beat almost all investors who jump in and out of the market, change tactics in midstream, and forever second-guess their decisions. Look at the S&P 500. We’ve shown that it is a simple strategy that buys large capitalization stocks. Yet this one-factor, rather mediocre strategy still manages to beat 70 percent of all actively managed funds because it never leaves its strategy. Realistically consider your risk tolerance, plan your path and then stick to it. You may have fewer stories to tell at parties, but you’ll be among the most successful long-term investors. Successful investing isn’t alchemy, it’s a simple matter of consistently using time-tested strategies and letting compounding work its magic.
Always Bet With the Base Rate
Base rates are boring, dull and very worthwhile. Knowing how often and by how much a strategy beats the market is among the most useful information available to investors, yet few take advantage of it. Base rates are essentially the odds of beating the market over the time period you plan to invest. If you have a ten-year time horizon and understand base rates, you’ll see that picking stocks with the highest multiples of earnings, cash flow, sales or lowest value composite score has very bad odds. If you pay attention to the odds, you can put them on your side. You now have the numbers. Use them. Don’t settle for strategies that may have done very well recently but have poor overall batting averages. Chances are you’ll be getting in just as those long-term base rates are getting ready to reassert themselves.
Never Use the Riskiest Strategies
There is no point in using the riskiest strategies. They will sap your will and you will undoubtedly abandon them, usually at their low. Given the number of highly effective strategies, always concentrate on those with the highest risk-adjusted returns.
Always Use More Than One Strategy
Unless you’re near retirement and investing only in low risk strategies, always diversify your portfolio by investing in several strategies. How much you allocate to each is a function of risk tolerance, but you should always have some growth and some value guarding you from the inevitable swings of fashion on Wall Street. Once you have exposure to both styles of investing, make sure you have exposure to the various market capitalizations as well. A simple rule of thumb for investors with ten years or more to go until they need the money is to use the market’s weights as guidelines. Currently, 75 percent of the market is large-cap and 25 percent is small- and mid-cap. That’s a good starting point for the average investor. Unite strategies so your portfolio can do much better than the overall market without taking more risk. Indeed, while this book only covers stocks that trade in the United States, with a reasonable number of them being American depository receipts of Foreign-domiciled companies that offer shares to U.S. investors, you might think about having your portfolio aligned in a similar fashion to the MSCI All World Index. Currently, the U.S. makes up 35 percent of that index, with Japan, the United Kingdom. France and Canada rounding out the top five. If you include the next five countries by market capitalization, Hong Kong, Germany, Australia, Switzerland and Brazil, you would cover 74 percent of the total market capitalization in the world. The point is, these strategies work outside the United States as well, and a well diversified portfolio should reflect this. We have run tests similar to those in this book on the MSCI dataset that begins in 1970 and found that, for the most part, these strategies work equally well in foreign markets.
Additionally, you should have a plan for your entire portfolio, not just the equity portion. One of the simplest and most effective strategies for your entire portfolio is to rebalance your allocations to various styles and asset classes back to your target allocation at least once a year. If you are working with a financial advisor, he or she is probably already doing this for you, but if not, figure out what makes the most sense for you and then make sure that you follow your allocation. What this effectively does is force you to buy more of an investment style or an asset class when it has done poorly and take money away from styles and asset classes that have done well. It would have served you extraordinarily well near the bear market bottoms of the last decade, as it would have forced you to move money from fixed income into equities at a time when most investors were fleeing the equity market and allowed you to take advantage of the big move up from the market bottom. But it also would have served you well during the last market boom, as it would have had you trim equity allocations and put additional money in fixed income and other assets. It’s important to have a strategy for your entire portfolio.
Use Multifactor Models
The single factor models show the market rewards certain characteristics while punishing others. Yet you’re much better off using several factors to build your portfolios. Returns are higher and risk is lower. You should always make a stock pass several hurdles before investing in it. The only exceptions to this rule are our Composited factors like the Composited Value Factor, the Composited Earnings Quality and so forth. These are essentially multifactor models as they include several factors and require a good score on each for a stock to rise to the top.
Insist On Consistency
If you don’t have the time to build your own portfolios and prefer investing in mutual funds or separately managed accounts, buy only those that stress consistency of style. Many managers follow a hit-or-miss, intuitive method of stock selection. They have no mechanism to reign in their emotions or insure that their good ideas work. All too often their picks are based on hope rather than experience. You have no way to really know exactly how they are managing your money, or if their past performance is due to a hot hand unguided by a coherent underlying strategy.
Don’t bet with them. Buy one of the many funds based on solid, rigorous strategies. If your fund doesn’t clearly define its investment style, insist that they do. You should expect nothing less.
The Stock Market Is Not Random
Finally, the data proves the stock market takes purposeful strides. Far from chaotic, random movement, the market consistently rewards specific strategies while punishing others. And these purposeful strides have continued to persist well after they were first identified. We now have not only what Ben Graham requested—the historical behavior of securities with defined characteristics—we also have a 14-year period where we’ve witnessed their continued performance in real time. We must let history be our guide, using only those time-tested methods that have proven successful. We know what is valuable and we know what works on Wall Street. All that remains is to act upon this knowledge.
1 note
·
View note
Text
Why Selling a Big Position of Puts the Day Before the Crash of ‘87 was a great trade
Tada Viskanta saw a series of tweets I did when reading about the new book, “A first Class Catastrophe” by Diana B. Henriques which chronicles the 1987 crash, the largest one-day crash in U.S. Market history and he urged me to write up my experience at the time. While I have not yet read the book, in my tweets I reminisced about what it felt like to me. I was 27 years old and had been investing—or more properly—speculating in the market since age 21.
At the time, I was using a much different methodology for determining buys and sells then I do now, and I had, for several weeks before the crash, been accumulating a large put position on the OEX, which represented the S&P 100. The OEX and XMI where popular with options traders of that era and had the greatest liquidity for the options tied to them. Going into the crash, I had a larger position in puts than at any other point in my nascent career. I was sweating bullets, as many of them were deeply out of the money and my worry was they would all expire worthless, leaving me with a huge loss.
When I was 27, I already believed in a series of indicators that were mostly accurate, but I also paid great attention to the news and what people were saying about the future direction of the market. I watched as the markets roiled on Friday, October 16th, with the Dow losing more than 4.6% of its value.
I then made what at the time looked like the biggest mistake of my trading career—about a half an hour before the markets close on Friday, reacting to assertions that the market’s drop was way overdone and that we would see a huge snapback on Monday, I sold my entire put position.
Just so it really sinks in, I repeat, on the day before the biggest crash in history, I let my emotional reactions to what I was reading and hearing drive my behavior, and I sold every single put option that I had carefully accumulated over the previous several weeks.
Had I held, I would have made a not so small fortune. But I didn’t. Indeed, I barely broke even on the entire trade. But as I reflected and wrote about in my trading journal, I think that turned out to be the greatest trade in my life.
For that trade sent me down the road that led to where I am today—I concluded that my emotions were my worst enemy in the market and that listening to predictions from gurus and other prominent market forecasters was worse than useless, it was destructive. It also opened my eyes to how early reactions by the media to such momentous events are almost always spectacularly wrong. I still have many of the newspapers and Barron’s from that time, as well as news magazines, etc. re-reading them now shows how any early reaction is also primarily based upon emotions and utterly fails to put anything in correct context.
It was the best wakeup call I could have received. I resolved to begin searching for empirically supported investment strategies that withstood the test of time. It got me to understand that if I were to succeed over the long-term, I had to match my investment strategy to my time horizon. If I had 30 or more years to go to achieve my goals, I thought I should find out which strategies performed the best over much longer periods of time and which had the highest base rates of success against their benchmarks.
Most importantly, it cemented in me that while in many areas of life emotions were great, in the world of investing they were your worst enemy. And that only an unwavering discipline, devoid of any emotional override, would win in the end. Over the 30 years since the crash, I have witnessed time and again some of the smartest people in the world undone my making emotional investment decisions based on very short-term events. This will never, ever change. Lest you think that rules-based, quantitative investing can solve this, think again. An analyst from a major Wall Street bank was visiting OSAM after the financial crisis and he noted that over 60% of quants overrode their models during the crisis. Remaining unemotional in my time as a portfolio manager has been one of the hardest things I have done, and yet, well worth it over the longer term. Oddly, it took the agony I felt selling my huge put position the day before the crash to teach me that agony, let alone any other emotion, has no place in implementing a successful investing career.
6 notes
·
View notes
Text
Successful Active Stock Investing is Hard: Here are Seven Traits that I Believe are Required for Active Investors to Win in the Long Term
Years of experience have taught me that to be a successful active investor requires a very specific set of characteristics, and that many investors attempting to actively manage their portfolios today lack the emotional and personality traits necessary for success.
Investors with passive portfolios—assuming they are adequately and broadly diversified—face only one real point of failure: reacting emotionally to a market selloff and selling their holdings, often near a market bottom.
But investors who use actively managed strategies face two points of failure:
1. Reacting emotionally to a market selloff and liquidating their holdings, usually at the very worst time; and
2. Selling out of an active strategy that is doing worse than its benchmark, often over periods as little as three years.
The second point of failure occurs even if the investor has earned positive returns in the active strategy—let’s say a gain of 10% per year over the last three years versus a benchmark return of 12%. While all investors face the same point of failure when selling during market swoons, only active investors face the second pitfall. What’s more, research has shown that managers who are fired due to a three-year underperformance typically go on to outperform the manager with which the investor replaces them.
Obviously, this second point of failure can destroy long-term results, even if the general market has been performing well. Sadly, I have seen this type of behavior often, leading me to conclude that for many investors, active management will never work because they lack the emotional and philological traits required to succeed.
Now, let’s look at seven traits that I think are necessary to be a successful long-term active investor.
1. Successful Active Investors Have A Long-Term Perspective on Their Investments.
“Having, and sticking to a true long term perspective is the closest you can come to possessing an investing super power.”
~ Tweet from Cliff Asness, Co-Founder AQR Capital Management
Cliff is right, but, sadly, most investors lack this ability. Evolution has programmed us to pay far more attention to what is happening now than to what might happen in ten or twenty years. For our ancient ancestors, that made a great deal of sense. Those who reacted quickly to rustling in a nearby bush—assuming it was a predator who could kill them--ran away and survived, whereas those who didn’t were often killed. Guess whose genes got passed down to us? Of course it was those that ran, even if there was no fatal threat.
Our culture has evolved much more rapidly than our brains, which doesn’t help us keep a long-term perspective on our investments. When you time-weight short-term information for investment decisions, you create a reactionary model, not an anticipatory one.
Many behaviors that hobble making good investment choices seem to be encoded into our genes. In their paper Why do Individuals Exhibit Investment Biases?, researchers Henrik Cronqvist and Stephan Siegel write:
“We find that a long list of investment biases—e.g., the reluctance to realize losses, performance chasing, and the home bias—are human, in the sense that we are born with them. Genetic factors explain up to 45% of these variation in those biases across individuals. We find no evidence that education is a significant moderator of genetic investment behavior.”
Wow! It’s no wonder that the majority of investors succumb to short-term volatility in the market by selling and waiting until markets have been very strong to begin buying, even though more than 30 years of studies have proven this is exactly the wrong thing to do. It’s literally programmed into our genes and is impervious to education. We are also prone to a slew of cogitative biases, from overconfidence in our own abilities to our tendency to overweight things simply based upon how easily they are recalled. And knowing about our biases of judgment—something that has been noted in market research for more than 30 years—hardly eliminates them.
Successful active investing runs contrary to human nature. It’s encoded in our genes to overweight short-term events, to let emotions dictate decisions and to approach investing with no underlying cohesiveness or consistency. Successful active investors do not comply with nature; they defy it. The past, present and future make up their now. It’s not natural to watch others get caught up in spirals of greed and fear, causing booms and panics, and remain unmoved. It’s not natural to remain unemotional when short-term chaos threatens your nest egg. And, leading to my next required trait, it’s not natural to persevere in a rigorous, consistent manner—no matter what the market is doing.
2. Successful Active Investors Value Process over Outcome.
“If you can’t describe what you are doing as a process, you don’t know what you’re doing.”
~W. Edwards Deming
The vast majority of investors make investment choices based upon the past performance of a manager or investment strategy. So much so that SEC Rule 156 requires all money managers to include the disclosure that “past performance is not indicative of future results.” It’s ubiquitous--and routinely ignored by both managers and their clients. In keeping with human nature, we just can’t help ourselves when confronted with great or lousy recent performance. “What’s his/her track record?” is probably investors’ most frequently asked question when considering a fund or investment strategy. And, as mentioned above, the vast majority of investors are most concerned with how an investment did over the last one- or three-year period.
Yet successful active investors go further and ask “what’s his or her process in making investment decisions?” Outcomes are important, but it’s much more important to study and understand the underlying process that led to the outcome, be it good or bad. If you only focus on outcomes, you have no idea if the process that generated it is superior or inferior. This leads to performance chasing and relying far too much on recent outcomes to be of any practical use. Indeed, shorter-term performance can be positively misleading.
Look at a simple and intuitive strategy of buying the 50 stocks with the best annual sales gains. Consider this not in the abstract, but in the context of what had happened in the previous five years:
Year Annual Return S&P 500 return
Year one 7.90% 16.48%
Year two 32.20% 12.45%
Year three -5.95% -10.06%
Year four 107.37% 23.98%
Year five 20.37% 11.06%
Five-year
Average Annual
Return 27.34% 10.16%
$10,000 invested in the strategy grew to $33,482, dwarfing the same investment in the S&P 500, which grew to $16,220. The three-year return (which is the metric that almost all investors look at when deciding if they want to invest or not) was even more compelling, with the strategy returning an average annual return of 32.90% compared to just 7.39% for the S&P 500.
Also consider that these returns would not appear in a vacuum—if it was a mutual fund it would probably have a five star Morningstar rating, it would likely be featured in business news stories quite favorably and the long-term “proof” of the last five years would say that this intuitive strategy made a great deal of sense and therefore attract a lot of investors.
Here’s the catch—the returns are for the period from 1964 through 1968, when, much like the late 1990s, speculative stocks soared. Investors without access to the historical results for this investment strategy would not have the perspective that the long term outlook reveals, and thus might have been tempted to invest in this strategy right before it went on to crash and burn. As the data from What Works on Wall Street make plain, over the very long term, this is a horrible strategy that returns less than U.S. T-bills over the long-term.
Had an investor had access to long-term returns, he or she would have seen that buying stocks based just on their annual growth of sales was a horrible way to invest—the strategy returned just 3.88 percent per year between 1964 and 2009! $10,000 invested in the 50 stocks from All Stocks with the best annual sales growth grew to just $57,631 at the end of 2009, whereas the same $10,000 invested in U.S. T-Bills compounded at 5.57 percent per year, turning $10,0000 into $120,778. In contrast, if the investor had simply put the money in an index like the S&P 500, the $10,000 would have earned 9.46 percent per year, with the $10,000 growing to $639,144! What the investor would have missed during the phase of exciting performance for this strategy is that valuation matters, and it matters a lot. What investors missed was that these types of stocks usually are very expensive, and very expensive stocks rarely make good on the promise of their sky-high valuations.
Thus, when evaluating an underlying process, it’s important to decide if it makes sense. The best way to do that is to look at how the process has fared over long periods of time. This allows you to better estimate whether the short-term results are due to luck or skill. We like to look at strategies rolling base rates—this creates a “movie” as opposed to a “snapshot” of how strategies perform in a variety of market environments.
Lest you think you can only do this with quantitative strategies that can be back tested, consider Warren Buffett’s results at Berkshire Hathaway. If you were making a choice about whether to invest in Berkshire stock using short-term results at the end of 1999, you probably would have passed, as over the previous three years, it underperformed the S&P 500 by 7.6% per year, and over the previous five years, by 3.76% per year. Indeed, your decision would have been reinforced by the news stories circulating that Buffett’s simple process no longer worked in the tech-dominated “new normal” for the stock market.
But if you checked on Buffett’s process, you would find that nothing had changed and that he still followed the stringent criteria he always had, generally looking for stocks with:
1. Recognizable brands with a wide moat;
2. Simple, easy to understand products and services;
3. Consistent, solid earnings over a long time period;
4. Low and manageable debt, and
5. Good ROE and other solid ratios.
These seem like sensible ways to buy stocks, and Buffett showed no signs of deviating from the strategy—he was (and is) patient and persistent, sticking with a proven strategy even when it isn’t working in the short-term. Now take a look at Buffett’s base rates from 1977 through 2016, Using Berkshire Class A stock:
These base rates are very similar to investing in the 10% of stocks that are cheapest based upon our value composite 1 from What Works on Wall Street, which ranks stocks on:
1. Price-to-book;
2. PE;
3. Price-to-sales;
4. EBITDA-to-enterprise value; and
5. Price-to-cash flow.
This process always focuses on the cheapest stocks in the universe and makes a great deal of intuitive sense, which is backed up by the process and its performance over time.
3. Successful Active Investors Generally Ignore Forecasts and Predictions.
“I don’t let people do projections for me because I don’t like throwing up on the desk.”
~Charlie Munger
“I have no use whatsoever for projections or forecasts. They create an illusion of apparent precision. The more meticulous they are, the more concerned you should be.”
~Warren Buffett
You can’t turn on business TV or read all of the various business news outlets or even talk with other investors without being bombarded with both short- and long-term forecasts and predictions. Against all the evidence, forecasts and predictions about what might happen in the future are intuitively attractive to us, since we are desperate to have a narrative about how the future might unfold. As I mentioned above, we tend to extrapolate what has happened recently well into the future, which almost never works. We’ll explore the results of this in a minute, but for now, consider that since we literally hear or read so many forecasts about markets, stocks, commodity prices, etc. that to follow up on the efficacy of each would be a full-time job. Lucky for us, others have done this job for us, and the results are grim. In a post at his website The Investor’s Field Guide, my son and fellow OSAM portfolio manager, Patrick O’Shaughnessy, highlighted a study that showed:
“The CXO Advisory group gathered 6,582 (investment) predictions from 68 different investing gurus made between 1998 and 2012, and tracked the results of those predictions. There were some very well-known names in the sample, but the average guru accuracy was just 47%–worse than a coin toss. Of the 68 gurus, 42 had accuracy scores below 50%.”
In his book Contrarian Investment Strategies: The Psychological Edge, money manager and author David Dreman looked at the accuracy of analysts’ and economists’ earnings growth estimates for the S&P 500 between 1988 and 2006. Dreman found that the average annual percentage error was 81% for analysts and 53% for economists! In other words, you might as well have bet on a monkey flipping coins.
People tend to take recent events and forecast similar returns into the future. Dreman nicely captures the results by looking at large international conferences of institutional investors where hundreds of delegates were polled about what stocks they thought would do well in the next year. Starting in 1968 and continuing through 1999, Dreman found that the stocks mentioned as favorites and expected to perform well tended to significantly underperform the market, and in many instances the stocks selected ended up in the stock market’s rogue’s gallery—for example, the top pick in 1999 was Enron, and we all know what happened there: one of the largest bankruptcies in corporate history. Least it seem like he was cherry-picking, Dreman looked at 52 surveys of how the favorite stocks of large numbers of professional investors fared between 1929 and 1980, with 18 studies including five or more stocks that experts picked as their favorites. The results? The 18 portfolios underperformed the market on 16 occasions. As Dreman dryly notes: “This meant, in effect, that when a client received professional advice about those stocks, they would underperform the market almost nine times out of ten.”
If you think this is outdated, here are some more famously wrong forecasts, as well as the results of an August, 2000 Fortune Magazine article called “10 Stocks To Last The Decade: A few trends that will likely shape the next ten years. Here’s a buy-and-forget portfolio to capitalize on them.” The results? As of December 31st, 2016 the 10 (or 8, since Nortel and Enron went bankrupt) were down 27%, versus a gain for the S&P 500 of 116%.
Finally, many studies have shown that this is true in almost all forecasts, be they about stock prices, patients needing medical treatment, college admissions offices trying to pick who to admit--and virtually every other industry where professionals were making predictions and forecasts. For more on this, check out Chapter Two of my book, What Works on Wall Street.
4. Successful Active Investors are Patient and Persistent.
“Nothing in this world can take the place of persistence. Talent will not: nothing is more common than unsuccessful men with great talent. Genius will not: unrewarded genius is almost a proverb. Education will not: the world is full of educated derelicts. Persistence and determination alone are omnipotent.”
~Calvin Coolidge
In addition to having a well thought out process, great active investors are patient and persistent. Warren Buffett, Ben Graham, Peter Lynch, John Neff and Joel Greenblatt are all great investors, and while they have very different ways of looking at the stock market, they all share a common disposition—they are patient and persistent. In 1999, numerous articles and TV features suggested that while Warren Buffett might have been great in the old economy, he was well past his prime and was out of step with the “new” market reality. Buffett’s response? He noted that nothing had changed and that he would stand pat with the process that had served him so well for so long.
The same could be said for every investor on this list. John Neff, a great value investor who helmed Vanguard’s Windsor fund and over his 31 year tenure beat the S&P 500 by 3.1% per year. In the early 1990’s, I remember the cover of Institutional Investor magazine showing a man inside an hourglass where the sand had nearly dropped through to the other side with the question: “Is value investing dead?” Neff, who favored stocks with low PE ratios and high dividend yields and good return on equity and who had therefore had been underperforming over the short-term, did the same as Buffett, he patiently stuck with his process focusing on cheap stocks with superior yields and high ROE. He went on to deliver great returns for his investors.
The point is clear: successful active investors are not simply defined by their process, as many have very different approaches and processes that they follow, but rather by their diligence and persistence in sticking with their strategies even when they are underperforming their benchmarks. But all of these investors are also defined by the clarity of their process.
John P. Reese and Jack M. Forehand wrote a book called The Guru Investor: How To Beat The Market Using History’s Best Investment Strategies, in which they methodically create checklists investors can follow to emulate their favorite manager. Now, while their interpretation of the manager’s criteria is open to debate, they do a good job of creating checklists for the investors they attempt to duplicate, usually using either books or statements from the manager to generate their criteria. They also maintain a website, www.validea.com, detailing the performance and current stock picks from each of the manager’s they follow. For example, much like the list of criteria already covered for Buffett, here’s their process to emulate Ben Graham:
1. No technology companies, company must have high sales;
2. Current ratio of at least 2.0;
3. Long-term debt does not exceed net current assets;
4. Steady EPS growth over the past decade;
5. 3-year average PE is less than 15;
6. Price-to-book times PE is less than 22;
7. Continuous dividend payments.
According to their website, since 2003, applying these criteria to select stocks has returned a cumulative gain of 377%, outperforming the market by 248%! You can see how other managers performed at their website. Note, they subtly anchor you on the long-term by presenting the cumulative return over the last 13 years, thus reinforcing the idea that you should only judge active performance over very long periods of time.
Had you only been looking at the recent performance for the strategy, you would have been led to a very different conclusion—in 2014, the strategy lost 22.9% versus a gain of 11.4% for the S&P 500 and in 2015 it also lost 20.4% versus a slight loss of 0.7% for the S&P 500. Had you started using the strategy at the start of 2014, your account would show a cumulative loss of 39% at the end of 2015 versus a gain of 10.62% for the S&P 500--do you think you would have had the patience, persistence and emotional fortitude to stick with it? For the vast majority, the answer is no. For successful active investors, the answer is yes. Patience and persistence would have paid off in 2016, with a gain of 20% versus a gain of 9.5% for the S&P 500. More importantly, keeping the long-term track record in mind would have immensely helped an active manager or investor to stay the course.
5. Successful Active Investors Have a Strong Mental Attitude.
“Nothing can stop the man with the right mental attitude from achieving his goal; nothing on earth can help the man with the wrong mental attitude.”
~Thomas Jefferson
Ben Graham believed that great investors are made, not born. It takes constant study, learning from both your own experience and that of others to create habits that lead to success. I believe that one of the habits that is not innate but learned is a strong mental attitude. I think that most successful active managers not only have strong mental attitudes, but many border on stoicism. Stoics taught that emotions resulted in errors of judgment and they thought that the best indication of someone’s philosophy was not what a person said, but how they behaved. In the words of Epictetus, “It’s not what happens to you, but how you react that matters.”
Successful active investors understand, as Napoleon Hill stated, “The only thing you control is your mind.” Practically, this means that you do not base your actions, feelings, emotions and thoughts on external events—good or bad—or on what other people are doing or saying, none of which are in your control, but rather on your own actions, beliefs and habits, all of which are in your control.
Successful active investors do not blame others or events; they do not shirk from their personal responsibility for how things turn out, but rather continually focus on their process and trying to improve it. They learn from every lesson, be it good or bad, and continually strive to incorporate that learning into their process. Above all, they understand that you must control your emotions rather than let them control you.
They understand, as Shakespeare famously said, “there is nothing either good or bad, but thinking makes it so.” Events very much depend upon how you interpret them. What might cause one person to react emotionally to something is treated as a learning experience by someone with a strong mental attitude. I think that this is a disposition that is learned and rarely innate. It is very helpful on the journey to becoming a successful active manager to keep a journal of how you reacted to various events and outcomes. This allows you to learn if there is a common thread that keeps you from succeeding. If so, you can then actively work to replace those behaviors.
By doing so, you reinforce the belief that the only one controlling your mind is you, which strengthens the synaptic connections in your brain that allow you to make this type of thinking more natural. Once accomplished, your thought patterns and mental attitudes become vastly more useful than reacting from base emotions such as fear, greed, envy and hope. Once habituated, this mindset frees you to persistently follow your process, even when it is not working in the short-term. Ralph Waldo Emerson said, “To map out a course of action and follow it to the end requires courage.” And, I would add, a strong mental attitude.
6. Successful Active Investors Think in Terms of Probabilities
“You don’t want to believe in luck, you want to believe in odds.”
~Charlie Munger
We are deterministic thinkers living in a probabilistic world. We crave certainty about how things will unfold. This is precisely why we fall for predictions and forecasts. Yet, even in the most prosaic of circumstances, nothing in the stock market—or in life—is 100% certain. But many people confuse possibility with probability and the two are almost exact opposites. Think of Jim Carrey’s “Dumb and Dumber” character Lloyd Christmas reacting to the unobtainable Mary Swanson’s rejection of his romantic advances; she told him his chances were “like one out of a million” and he responded: “So you’re telling me there’s a chance. YEAH!” Poor Lloyd mistook possibility with probability. And didn’t understand that the probability of he and Mary hooking up was virtually zero.
If we focus on “possibilities” rather than “probabilities,” we are lost. Almost anything is possible, even when highly improbable. If we think only of possibilities, it would be hard getting out of bed in the morning. It’s possible that you will get hit by a bus, get accosted by a stranger, get killed by a crashing plane or, more brightly, win the lottery, despite the very low probability of any of these events occurring. Focusing on possibilities can lead us to a state of constant fear—thus our desire for orderly, known and “certain” information and actions.
Life doesn’t work that way. According to Richard Peterson’s Inside the Investor’s Brain, “When an outcome is possible but not probable, people tend to overestimate its chances of occurring. This is called the possibility effect…Emotions in uncertain or risky situations are more sensitive to the possibility rather than the probability of strong consequences, contributing to the overweighting of very small probabilities.”
The best real world example of people thinking in terms of possibilities rather than probabilities was during the financial crisis—people actually sold out of all their long-term investments and I know of at least two who put large sums of cash into their safety deposit boxes. They were most certainly thinking of possibilities rather than probabilities.
A study we conducted in 2009 looked at the 50 worst ten-year returns for the US market since 1871 and found that the ten-years ending February 2009 was the second worst in more than 100 years. But more importantly, we looked at what happened after those horrible periods, and found that the 50 returns over the next three to ten years were all positive. This led us to conclude that the probabilities were quite high for the market to do well in the ten years after February 2009.
To succeed, it’s best to know the probabilities of a certain outcome, and then act accordingly. Knowing the probabilities gives you a strong edge over people who don’t know them or choose to ignore them. If you, like legendary card player and investor Ed Thorp, can count cards in blackjack so that you know the probabilities of what the next card is likely to be, you have an enormous edge. The same holds true for any number of professions: life insurance companies use actuarial tables to predict the probability of someone dying; casinos use probabilities that allow the house to always win in the end and colleges and universities rely on educational tests to determine who gets a spot at their institution.
In the stock market, I believe the best way forward is to look at the long-term results for an investment strategy and how often—and by what magnitude—it beat its underlying benchmark. For example, the table below (from the 4th edition of What Works on Wall Street) illustrates the results of simply buying the 10% of large stocks with the highest shareholder yield (dividend yield plus net buy backs) between 1927 and 2009.
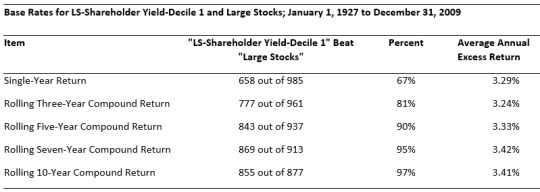
You can see that over all rolling 3-year periods, that group beats other large stocks 81% of the time by an average 3.24% per year. When you extend it to all rolling 10-year periods, the base rate increases to 97%. Now, if you think about this, the base rate offers us an 80% chance of winning over any three-year period, but it also informs us that we have a 20% chance of losing to the benchmark over any 3-year period.
But very few investors pay much attention to base rates, and study after study has shown that when you introduce any information in addition to the base rate, people usually ignore the base rate in favor of the often-useless anecdotal information. Even though the rational thing to do is bet with the base rate and accept that we will not always be right, we are forever rejecting the long-term evidence in favor of the short-term hunch, even though our probability of being correct plummets.
We also ignore probabilities when we enthusiastically buy a story stock that is incredibly expensive—the 3-year base rates for buying stocks with the highest PE ratios is just 20%, meaning you will lose in 8 of 10 of all rolling 3-year periods.
The bottom line? Knowing the past odds of how often and by what magnitude a strategy either outperforms or underperforms its benchmark gives you an incredible edge that many people ignore. Successful active investors know this and pay close attention to this information, thereby putting the probabilities on their side.
7. Successful Active Investors are Highly Disciplined
“Discipline is the bridge between goals and accomplishment.”
~Jim Rohn
It is easy to say is that you are an unemotional, disciplined investor—right up until the market goes against you and you throw in the towel. Did you sell the majority of your equity holdings during the financial crisis? Did you enthusiastically buy tech stocks in 1999? Did you ever let a prediction or a forecast influence your dealings in the market? Do you blame events or other people for what happened with your investments? Did you ever ignore all of the evidence and probabilities and “take a flyer” on a stock or a fund? Did you ever invest in something because the majority of other investors were doing so? Did you ever abandon a well-tested and thought out investment strategy because it recently had been doing poorly? If you answered yes to several of these questions, congratulations, you are a normal human being, but you may lack the discipline required to succeed as an active investor.
Being highly disciplined is extremely difficult. It goes against almost every impulse we have baked into our genes. Sure, it’s easy to be disciplined when things are going your way. When you are significantly outperforming your benchmark, your mantra might be the song “The future’s so bright, I’ve got to wear shades.” Real discipline kicks in when things are going against you, sometimes significantly. When every week seems like a month, when you are filled with self-doubt and constantly questioning every single part of your investment process, when others express skepticism about your core beliefs, and even friends and colleagues begin to doubt you and your process, that’s when discipline is required.
And, boy, does your mantra change, perhaps to the song “Been down so damn long that it looks like up to me.” You know what it’s like to feel horrible about yourself and your ideas, and you suddenly really understand the opening of Shakespeare’s 29th sonnet “When, in disgrace with fortune and men’s eyes, I all alone beweep my outcast state, and trouble deaf heaven with my bootless cries, and look upon myself and curse my fate…” That’s when you really need discipline if you are to succeed.
And, like most things in life, that is precisely the moment when you want to shout: Stop! Every event and news item you see is the opposite of what you believe, and your emotions and intellect shout: Stop! And every single thing you read or hear people say remind you that you are wrong, that you must abandon your silly persistence and allow this pain to stop. Just let it stop. The emotional pain is so overwhelming that it feels like slow torture, day in and day out, and all you need do to make the pain go away is to abandon your silly process and allow yourself to breathe.
And if you continue to stick with it, even when every single thing conspires to dissuade you from your consistent application of your investment ideas and principles, you’ll also know that you may be wrong for a lot longer than you think you can endure. What’s worse, you won’t have to just put up with your interior fear, doubts and pain, you will often be derided, mocked, and ridiculed by many other people who think you’re simply a fool. All of the recent weight of the evidence will be on their side. Not only that, but experience teaches that they don’t come alone, they come in crowds. The criticism can be deafening, snide and cruel and this can be devastating to your psyche. According to a March 22, 2012 article in Psychology Today magazine listed “The (Only) 5 Fears we all Share”:
1. Extinction;
2. Mutilation;
3. Loss of Autonomy;
4. Separation and
5. Ego-death.
Each of these also plays a part in feeding your self-doubt and desire to abandon your discipline, but 3, 4 and 5 are the ones that are the cruelest in this instance because they feed everything you are feeling. Loss of autonomy is the feeling of “being controlled by circumstances beyond our control.” Separation is the feeling of “rejection, (and) not (being) respected or valued by anyone else.” And ego-death is “fear of humiliation, shame…or the shattering…of one’s constructed sense…of capability and worthiness.”
The only thing you can do is hang on to the idea that “this too, shall pass.” Not much of a lifeline, is it? I go on at length about this because I have been there more times than I care to remember. Indeed, absent discipline, all of the other six emotional and psychological traits that are pitfalls to successful active investing are worthless. And the question you must answer honestly is—in the throes of underperformance or rocky market conditions, do you really have the discipline to remain unemotional and stick to your plan? According to a recent post by Ben Carlson discussing Charlie Munger’s ability to withstand drawdowns, he wrote: “Many people simply weren’t born with the correct wiring to be so unemotional…The ability and willingness to take risk are not always equal for most investors. Charlie Munger is a one-of-kind. It’s good for investors to remind themselves of this when trying to emulate him. Very few can.”
I believe that if you possess these seven traits and can really enforce a disciplined commitment to them, over time, you can do significantly better than passively indexing your portfolio. But as Ben points out, very few can.
If you are one of the few, I think our current environment and the rush of investors into passive products will only increase your chance of doing much better than an index, but you must be brutally honest with yourself. Keep a detailed journal of all of your investments and note when you succeed and when you fail. Then work on your weak points until they are gone. If you can manage this, you will become a member of a shrinking, and yet potentially lucrative club, that of long-term, active investors.
17 notes
·
View notes
Text
Some Great Books to Read on Vacation, Part 2: J Through Z
“Juliet, Naked.” By Nick Hornby
“Last Chance to See.” By Douglas Adams and Mark Carwardine
“The Lemon Table.” By Julian Barnes
“The Lessons of History.” By Will and Ariel Durant
“Letters of Note.” By Shaun Usher
“London Fields.” By Martin Amis
“Major Pettigrew’s Last Stand: A Novel.” By HelenSimons
“Middlesex: A Novel.” By Jeffrey Eugenides
“Money: A Suicide Note.” By Martin Amis
“Mystic River.” By Dennis Lehane
“No Country for Old Men.” By Cormac McCarthy
“Nutshell: A Novel.” By Ian McEwan
“On Chesil Beach.” By Ian McEwan
“On the Meaning of Life.” By Will Durant
“Open City: A Novel.” By Teju Cole
“The Photograph.” By Penelope Lively
“A Prayer for Owen Meany: A Novel.” By John Irving
“The Pregnant Widow.” By Martin Amis
“The Rachel Papers.” By Martin Amis
“The Rape of Europa: The Fate of Europe’s Treasures in the Third Reich and the Second World War.” By Lynn H. Nicholas
“The Razor’s Edge.” By W. Somerset Maugham
“Ready Player One.” By Ernest Cline
“The Remains of the Day.” By Kazuo Ishiguro
“Rewire Your Brain: Think Your Way to a Better Life.” By John B. Arden
“The Right Stuff.” By Tom Wolfe
“The Road.” By Cormac McCarthy
“The Road to Lichfield.” By Penelope Lively
“Rules for Old Men Waiting: A Novel.” By Peter Pouncey
“Sapiens: A Brief History of Humankind.” By Yuval Noah Harari
“Saturday.” By Ian McEwan
“The Screwtape Letters.” By C.S. Lewis
“Seabiscuit: An American Legend.” By Laura Hillenbrand
“The Selfish Gene.” By Richard Dawkins
“The Sense of an Ending.” By Julian Barnes
“The Shipping News: A Novel.” By Annie Proulx
“Shutter Island.” By Dennis Lehane
Slade House: A Novel.” By David Mitchell
“The Snowball: Warren Buffett and the Business of Life.” By Alice Schroeder
“Solar.” By Ian McEwan
“The Stars My Destination.” By Alfred Bester
“Station Eleven: A novel.” By Emily St. John
“Status Anxiety.” By Alain De Botton
“Steve Jobs.” By Walter Isaacson
“Subliminal: How Your Unconscious Mind Rules Your Behavior.” By Leonard Modinow
“Success.” By Martin Amis
“Sweet Tooth: A Novel.” By Ian McEwan
“Talking it Over.” By Julian Barnes
“The Tender Bar: A Memoir.” By J.R. Moehringer
“The Thousand Autumns of Jacob de Zoet: A Novel.” By David Mitchell
“Tools of Titans.” By Timothy Ferriss
“The Ture Believer: Thoughts on the Nature of Mass Movements.” By Eric Hoffer
Twins: And What The Tell Us About Who We Are.” By Lawrence Wright
“Ubik.” By Philip K. Dick
“Unbroken: A World War II Story of Survival, Resilience, and Redemption.” By Laura Hillenbrand
“Water for Elephants: A Novel.” By Sara Gruen
“What do You Care What Other People Think?” By Richard P. Feynman
“When Breath Becomes Air.” By Paul Kalanithi
“A Widow for One Year.” By John Irving
“Wolf Hall: A Novel.” By Hilary Mantel
“World War Z: An Oral History of the Zombie War.” By Max Brooks
“You are the Placebo: Making Your Mind Matter.” By Dr. Joe Dispenza
“Zen and the Art of Motorcycle Maintenance.” By Robert M. Pirsig
3 notes
·
View notes
Text
Some Great Books to Read on Vacation, Part 1: A Through I
“Adapt: Why Success Always Starts with Failure.” By Tim Hartford
“All the Light We Cannot See: A Novel” By Anthony Doerr
“At Play in the Fields of the Lord.” By Peter Matthiessen
“Beautiful Ruins.” By Jess Walter
“Before She Met Me.” By Julian Barnes
“The Black Dahlia.” By James Ellroy
“The Blank Slate: The Modern Denial of Human Nature” By Steven Pinker
“Boyd: The Fighter Pilot Who Changed the Art of War.” By Robert Coram
“Bring Up the Bodies: A Novel (Wolf Hall Series 2).” By Hilary Mantel
“Brute: The Life of Victor Krulak, U.S. Marine.” By Robert Coram
“Central Station.” By Lavie Tidhar
“The Children Act.” By Ian Mcewan
“Churchill.” By Paul Johnson
“The Cider House Rules.” By John Irving
“Cleopatra: A Life.” By Stacy Schiff
“Cloud Atlas: A Novel.” By David Mitchell
“A Confederacy of Dunces.” By John Kennedy Toole
“The Corrections: A Novel.” By Jonathan Franzen
“Creativity, Inc.: Overcoming The Unseen Forces That Stand In The Way Of True Inspiration.” By Ed Catmull
“The Daily Stoic: 366 Meditations On Wisdom, Perseverance, And The Art Of Living.” By Ryan Holiday and Stephen Hanselman
“Dead Babies.” By Martin Amis
“The Devil in the White City: Murder, Magic, And Madness At The Fair That Changed America.” By Eric Larson
“The Dog Stars.” By Peter Heller
“The Doors of Perception Includes Heaven and Hell.” By Aldous Huxley
“Dune.” By Frank Herbert
“England, England.” By Julian Barnes
“The Fall: A Novel.” By Simon Mawer
“The Forever War.” By Joe Haldeman
“Foundation.” By Isaac Asimov (and all of its follow on books)
“Genius: The Life and Science of Richard Feynman.” By James Gleick
“Ghostwritten.” By David Mitchell
“The Glass Room.” By Simon Mawer
“The Great Gatsby.” By F. Scott Fitzgerald
“Here is New York.” By E.B. White
“The Hitchhiker’s Guide to the Galaxy.” By Douglas Adams
“The Hobbit.” By J.R.R. Tolkien
“How to Fail at Almost Everything and Still Win Big: Kind of the Story of my Life.” By Scott Adams
“How to Win Friends and Influence People.” By Dale Carnegie
“An Incomplete Education: 3,684 Things You Should Have Learned But Probably Didn’t.” By Judy Jones and William Wilson
“Influence.” By Robert B. Cialdini
“Into Thin Air.” By Jon Krakauer
2 notes
·
View notes
Text
The Value of Value Factors
Value investing seems to be attracting the attention of investors again. The following excerpt from my book “What Works on Wall Street, 4th Edition” makes the case that over the long-term, investors who focus on stocks with the best value characteristics almost always come out on top. Let’s see why:
“An analysis of the past behavior of stocks grouped by defining factors such as PE ratio, price-to-sales ratio and EBITDA/EV shows that rather than careening about like a drunken monkey, the stock market methodically rewards certain types of stocks while punishing others. What’s more, had you simply read and followed the advice in the last edition of this book you could have avoided the carnage that investors in the highest valued stocks suffered between 2000 and 2003. The severe bear market of 2007 through 2009 was more difficult in that much of it was caused by panic selling that affected all stocks, regardless of their valuations, but would nevertheless leave you better positioned to take advantage of the resurgence of stock prices in the last three quarters of 2009. And even though this book has been in the public domain since 1996, nothing has really changed regarding the longer term performance of overpriced companies: They do horribly over the long term.
There’s nothing random about Figure 1. Stocks with the best scores on our composited value ratios, as well as all of the other ratios tested, dramatically outperform the All Stocks universe. Just as importantly, those with the worst scores on our composited value ratios, as well as stocks with high price-to-book, high price-to-cashflow and high price-to-sales ratios underperform dramatically. The symmetry is striking. Indeed, ten of the groups ranked by very high valuations such as earnings-to-price, EBITDA-to-enterprise value, sales-to-price and all of our value composites underperformed U.S. T-bills! What’s more, the richly valued strategies that did so poorly had higher standard deviations of return than the value strategies that significantly outperformed the All Stocks universe.
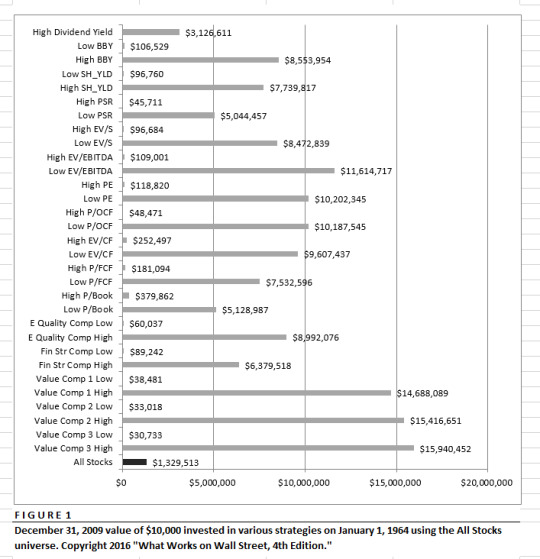
Risk Doesn’t Always Equal Reward
An important principal of the Capital Asset Pricing Model is that risk is compensated. It steers investors seeking higher returns to stocks with higher standard deviations. Yet the results of this evidence conflict with that tenant. Nine of the 14 strategies that outperform the All Stocks universe did so with lower standard deviations of return than the All Stocks universe. However, higher risk does not always lead to higher returns. The higher risk of the high price-to-earnings, price-to-book, price-to-cash flow and price-to-sales ratios went uncompensated. Indeed, each of the strategies significantly underperformed the All Stocks universe. Buying the stocks in decile one of our Value Composite Three turns $10,000 into $15,940,452 with a standard deviation of return of 17.68 percent, but buying the stocks in Value Composite Three in decile ten—those securities with the richest valuations—turns $10,000 into just $30,733, with a higher standard deviation of return of 28.14 percent.
This remains largely true even when you use the CRSP dataset to analyze an additional 37 years of data. Between 1926 and 2009, buying the decile of stocks from All Stocks with the highest shareholder yield earned an average annual compound return of 13.22 percent and had a standard deviation of return of 20.19 percent. That’s a higher return and lower standard deviation of return than an investment in the All Stocks universe returned, where its average annual compound return was 10.46 percent with a standard deviation of 21.67 percent. And in keeping with what we saw with the 1963-2009 returns, an investment in the decile of stocks from All Stocks with the lowest shareholder yield—i.e., those companies that were issuing the most stock—had an average annual compound return of 6.07 percent with a standard deviation of return of 25.78 percent. Thus for both the shorter period between 1963 and 2009 and the longer 1926 through 2009 period, the strategy that had much higher returns had a lower standard deviation of return than both the All Stocks universe and the decile ten of the same factor.
Is It Worth the Risk?
Many of the sexiest stocks with the most compelling stories also come with high PEs, price-to-book, price-to-cash flow or price-to-sales ratios and have abysmal absolute and risk-adjusted returns.. Nothing demonstrated this more forcefully then the performance of the strategies between 1997 and March of 2000 and then in the aftermath of the burst bubble. During the stock market bubble of the late 1990s, investors pushed the prices of richly valued stocks to unprecedented levels. An investor who believed the market-bubble mantra that it was “different this time” and focused on buying the “story” stocks with no earnings, little sales but great stories about a bright future (think Anything.com) would have done extraordinarily well in the three years after the revised edition of What Works on Wall Street came out in 1997. An investor who stuck with the time-tested strategies featured in my book would have felt like a fool comparing his or her portfolio’s performance to the high-ratio “story” stocks in March of 2000, the top of the stock market bubble.
Between January 1, 1997 and March 31, 2000, the decile of stocks from the All Stocks universe with the worst scores on Value Composite One compounded at 39.47percent per year, more than doubling $10,000 into $29,482 in three years and three months. Other speculative names did equally as well, with the decile of stocks from All Stocks with the highest price-to-book ratios growing a $10,000 investment into $27,772, a compound return of 36.92 percent. All of the highest valuation stocks trounced All Stocks over that brief period, leaving those focusing on the shorter term to think that maybe it really was different this time. But anyone familiar with past market bubbles knows that ultimately, the laws of economics reassert their grip on market activity. Investors back in 2000 would have done well to remember Horace’s Ars Poetica, in which he states: “Many shall be restored that are now fallen, and many shall fall that now are in honor.”
For fall they did, and they fell hard. A near-sighted investor entering the market at its peak in March of 2000 would face true devastation. A $10,000 investment in decile ten of Value Composite One on March 31st, 2000 would have been worth just $1,161 at the end of 2009, an average annual compound loss of 19.67 percent! A similar $10,000 investment in the ten percent of stocks from All Stocks with the worst sales-to-enterprise value would have been worth just $1,283, a loss of 18.84 percent a year! A similar fate happened to all of the other stocks with sky-high valuations.
You must always consider risk before investing in strategies that buy stocks significantly different from the market. Remember that high risk does not always mean high reward—all the higher-risk strategies are eventually dashed on the rocks.
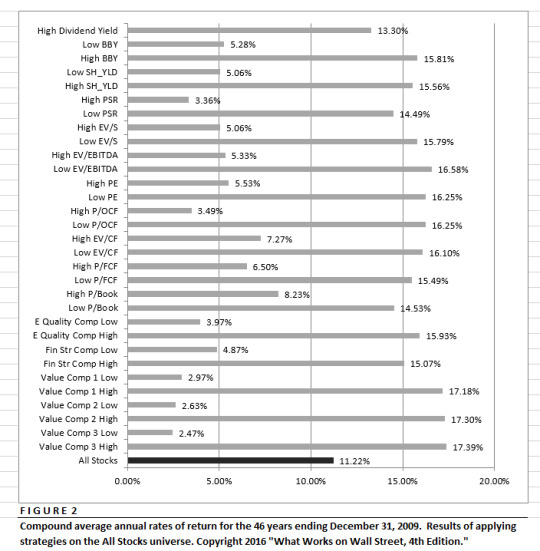
Embrace Consistency
You should also look for strategies that do well over time and have the highest base rates of beating the universe from which they are selected. Stocks that score well on the various Composited Value Factors as well as those with the best EBITDA-to-enterprise value, the highest buyback and shareholder yield, the lowest PE ratios and price-to-sales and price-to-cash flow ratios all have excellent long-term base rates. On the other hand, stocks with the worst scores on the composited Value Factors, as well as those with high PE ratios, price-to-sales ratios and low shareholder and buyback yield all have horrible base rates and usually only do well in unsustainable market bubbles. You must remember this the next time some hot sector is soaring and you are hearing all of the predictably short-term reasons why the old rules of valuation no longer apply. They always apply and have for all of the recorded evidence we have on stock market valuation.
Implications
Value strategies work, rewarding patient investors who stick with them through bull and bear. But it’s sticking with them that’s extraordinarily hard. Since we all filter today’s market performance through our decision making process, it’s almost always the glamorous, high expectations, high ratio stocks that grab our attention. They are the stocks we see zooming up in price, they are the ones that our friends and fellow investors talk about, and they are the ones in which investors focus their attention and buying power. Yet they are the very stocks that consistently disappoint investors over the long term.
High-ratio strategies (e.g., high PE, high price-to-book, etc.) consistently underperform their universes over the long-term. They take more risk and offer less reward. They have some spectacular runs that encourage investors to pay unwarranted prices for the stocks with the best story or most sizzle. But they consistently disappoint and should be avoided unless there are extremely compelling strategic reasons for buying the stock.
Learning to Focus on the Long Term
Let’s say you bought the second edition of this book in 1998 and truly understood the dangers of investing in over-valued stocks. Yet in real time you would have watched those very stocks soar—month in and month out—for the next two years. Two years feels like an eternity to the average investor, and I believe that even armed with all this information you would have had a tough time staying away from those high-flying story stocks. Yes, the long term data says to avoid these issues, but gosh, they are the only ones moving up in price, maybe there really is something to this “new economy” paradigm shift that everyone is talking and writing about in the media.
If you were like the typical investor, little by little you would relax the rules, becoming more and more willing to take a flyer on some of the rapidly growing shares being touted on CNBC or in research reports. And then, much like the drug user who thinks he’s just experimenting, you’d have been hooked. Unfortunately, in all likelihood you’d have gotten hooked nearer the end of the speculative market environment—and it would have cost you a fortune. To truly take advantage of the evidence presented in this book, you have to internalize this message and stay focused on the much longer term. In no period over the last 46 years did the high flying, richly valued stocks stay ahead over the long term. They always ended up crashing and burning. The hot stocks of 1997-2000 were technology and internet issues, but the hot stocks of tomorrow will quite likely come from a different industry with a new hot story. Remember that the market always reverts to basic economics and that it will be no different for those future hot stocks than it was for those in the past. Only then will you be able to take full advantage of all the long term evidence presented in this book.
You’ll also need to think about the long-term results of our strategies after bear markets like those of 2000-2003 and 2007-2009. The back-to-back severe bear markets of the last decade soured many people on ever investing in the stock market, and such an asset allocation mistake will most certainly radically reduce the returns you earn on your investments. According to the Investment Company Institute, between December 31st, 2006 and August 11, 2010, investors yanked nearly $159 billion from equity funds and poured more than $709 billion into bond funds. Given that bond yields are close to historic lows, that is almost certainly going to be a losing investment as time goes on, as when yield increase, bond prices decline. It’s hard to keep the long term prospects for equities in mind after suffering such a serious rout yet it is when equities are well priced with low valuations and high dividend yields that they go on to offer great returns for investors who had the courage to go against short-term pessimism and stay true to their long-term asset allocation.”
3 notes
·
View notes
Text
Short-term Luck Versus Long-term Skill
Daniel Kahneman, one of the fathers of behavior economics, said one of his favorite papers was “On the Psychology of Prediction (1973).” He claims in the paper that intuitive predictions are often unreliable because people base their predictions on how well an event fits a story. In behavioral economics, this phenomena is called a judgmental heuristic—representativeness, or how familiar you are personally with the story. This is one of the worst ways to make a forecast, because it uses a highly limited data set and allows the law of small numbers to mislead you and your forecast. For example, one study showed that when a doctor is told that a procedure works 50 percent of the time (essentially a coin toss probability or base rate) he or she could get the majority of patients to undergo the procedure if he or she simply added “The last patient who did this is doing great!” The story of success eliminates consideration of the base rate.
I recommend that to successfully make predictions about the long-term results of something such as an investment strategy or the overall direction of a market, you must consider three things:
1. The long-term base rate of the success or failure of the strategy you are evaluating;
2. The tendency of systems where both luck and skill are involved to revert to the mean and;
3. What happened historically after certain extreme observations.
So, for example, when I wrote the commentary entitled “A Generational Buying Opportunity” in March of 2009, I was not relying on any particular insight that I might have had at the time, but rather on the data available to me about what happens in markets after they reach an extreme inflection point. It’s important to remember that the stock market is a complex, adaptive system with feedback loops that has elements of both luck and skill. Luck, in the stock market, essentially holds sway over the short-term and is a specific chance occurrence that affects the overall market or individual stock or portfolio can be either good or bad. Luck is a residual—it’s what is left over after you subtract skill from the outcome.
How much luck is involved determines the range of outcomes—where little luck is involved, a good process will almost always lead to a good outcome. Where a measure of luck is involved, a good process will usually have a good outcome, but only over longer periods of time. The luck/skill continuum in investing is almost entirely a function of time. Over shorter periods, your results are highly contingent on luck and chance. This is vital to understand because you might see a bad process provide excellent results due entirely to chance and a good process provide poor results for the same reason.
Consider a simple intuitive strategy of buying the 50 stocks with the best annual sales gains. But consider this not in the abstract but in the context of what had happened in the previous five years:
Year Annual Return S&P 500 return
Year one 7.90% 16.48%
Year two 32.20% 12.45%
Year three -5.95% -10.06%
Year four 107.37% 23.98%
Year five 20.37% 11.06%
Five-year
Average Annual
Return 27.34% 10.16%
$10,000 invested in the strategy grew to $33,482 dwarfing the same investment in the S&P 500, which grew to $16,220. The three-year return (which is the metric that almost all investors look at when deciding if they want to invest or not) was even more compelling, with the strategy returning an average annual return of 32.90% compared to just 7.39% for the S&P 5000. Also consider that these returns would not appear in a vacuum—if it was a fund it would probably have a five start Morningstar rating; it would probably be featured in business news stories quite favorably and the “long-term” proof would say that this intuitive strategy made a great deal of sense and would attract a lot of investors.
Here’s the catch—the returns shown are from “What Works on Wall Street” and are for the period from 1964 through 1968, when, much like the late 1990s, speculative stocks soared. Investors without access to the very long-term results to this investment strategy would not have the perspective that the longer term brings, and without these tools, might have jumped into this strategy right before it went on to crash and burn. As the data from What Works on Wall Street makes plain, over the very long term, this is a horrible strategy that returns less then U.S. T-bills over the long-term. Had this investor had access to long-term returns, he or she would have seen that buying stocks based just on their annual growth of sales was a horrible way to invest—the strategy returned just 3.88 percent per year between 1964 and 2009! $10,000 invested in the 50 stocks from All Stocks with the best annual sales growth grew to just $57,631 at the end of 2009, whereas the same $10,000 invested in U.S. T-Bills compounded at 5.57 percent per year, turning $10,0000 into $120,778. In contrast, if the investor had simply put the money in an index like the S&P 500, the $10,000 would have earned 9.46 percent per year, with the $10,000 growing to $639,144! An investment in All Stocks would have done significantly better, earning 11.22 percent per year and turning the $10,000 into $1.33 million! What the investor would have missed during the phase of exciting performance for this strategy is that, in the end, valuation matters, a lot.
This is a good example of why Kahneman’s paper is so important—people make forecasts not on the data, but how well the prediction fits their perspective and the story behind it. Extrapolating from a small data set can be disastrous to long-term results. The “Most Dangerous Equation” was derived by Abraham de Moivre and states that the variation of the mean is inversely proportional to the size of the sample. A small sample tells you nothing about the true direction of results. Using a small sample—as we see above—can lead to costly errors over the long term.
What this tells us
1. Investors are well advised to look at short-term performance as a worthless indicator for what will happen over the long-term. Indeed, short-term performance can be among the most misleading to investors and should be heavily discounted. The stock market combines both luck and skill, with luck more pronounced over short time periods, and skill more telling over long periods of time.
2. Investors should make decisions using the long-term base rates a strategy exhibits—in other words, they should concentrate on what is probable rather than what is possible. If you organized your life around things that might possibly happen to you, you’d probably never leave your house, and when you did, it would only be to buy a lottery ticket. Consider, on a drive to the supermarket, it is highly probable that you will get there, buy your groceries and get back home to unpack them without incident. But what’s possible? Almost anything—it’s possible a plane flying overhead could lose an engine falling directly on your car and instantly killing you. It’s possible another car runs a red light and kills you on impact. It’s possible that you get carjacked and your assailant kills you in the process. You get the point—anything is possible but highly improbable. It’s only when you think in terms of probability that you will get in your car and go, yet few investors do so when making investment decisions. Our brains create cause and effect narratives after something has occurred that seem to make sense, however improbable the event. Witness anyone who invested in the stocks with the highest sales gains after a great short-term run.
3. In the stock market, short term trends are mostly random and heavily influenced by luck. To succeed, you must ignore them and invest in strategies that have the highest probability (base rate) of succeeding in the future.
4. You will not win the lottery. Avoid buying tickets and avoid what my son, Patrick O’Shaughnessy, calls lottery stocks.
5. Over short periods of time, a good investment strategy can lead to poor results just as a poor investment strategy can lead to good results. Do your homework; understand how a strategy performs over long periods of time and stick with it. If you can do just this one thing, you will be ahead of the vast majority of investors over the long-term.
36 notes
·
View notes
Text
The Unreliable Experts: getting in the way of outstanding performance
Given the current turmoil, I thought it would be a good time to revisit the one predictable thing in the market--Human behavior. What follows is Chapter Two of “What Works on Wall Street.”
“What ails the truth is that it is mainly uncomfortable, and often dull. The human mind seeks something more amusing, and more caressing.”
~H. L. Mencken
Everyone is guilty of faulty decision-making, not just the scions of Wall Street. An accountant must offer an opinion on the credit worthiness of a firm. A college administrator must decide which students to accept into a graduate program. A psychologist must decide if the patient’s problems are neurosis or psychosis. A doctor must decide if it’s liver cancer or not. More prosaically, a bookie must try to handicap the next horse race.
All these are activities in which an expert predicts an outcome. They occur every day and make up the fabric of our lives. Generally, predictions are made in two ways. Most common is for a person to run through a variety of possible outcomes in his or her head, essentially relying on personal knowledge, experience, and common sense to reach a decision. This is known as a clinical or intuitive approach, and it is how most traditional active money managers make choices. Stock analysts may pour over a company's financial statements, interview management, talk to customers and competitors, and finally try to make an overall forecast for that company's health and long-term potential. The graduate school administrator might use a host of data, from college grade point average and interviews with applicants, to determine if a student should be accepted. This type of judgment relies on the perceptiveness of the forecaster. Psychologists have shown in numerous studies that when people are confronted with vast amounts of data, their brains create mental shortcuts to make decisions. The shortcuts, called heuristics, are the rules of thumb on which most intuitive forecasters rely when making any number of complex decisions or forecasts in their field.
The other way to reach a decision is the actuarial or quantitative approach. Here, the forecaster makes no subjective judgments, nor does she rely on a rule of thumb heuristic. Rather, only empirical relationships between the data and the desired outcome are used to reach conclusions. This method relies solely on proven relationships using larger samples of data, in which the data are systematically weighed and integrated. It's similar to the structured portfolio selection process I discussed in Chapter 1. The graduate school administrator might use a model that finds college grade point average highly correlated to graduate school success and admit only those who made a certain grade. A money manager might rely on stock selection technique that employs long-term, empirical tests (like those in this book) that proves the strategies efficacy over the span of 50 or more years. In almost every instance, we naturally prefer qualitative, intuitive methods. In almost every instance, we’re wrong.
Human judgment is limited
David Faust writes in his revolutionary book, the Limits of Scientific Reasoning, that: “human judgment is far more limited than we think. We have a surprisingly restricted capacity to manage or interpret complex information." Studying a wide range of professionals, from medical doctors making diagnoses to experts making predictions of job success in academic or military training, Faust found that human judges were consistently outperformed by simple actuarial models. Like traditional money managers, most professionals cannot beat the passive implementation of time-tested formulas.
Another researcher, Paul Meehl, offered the first comprehensive review of statistical prediction (similar to an empirical, systematic approach) and clinical prediction (similar to an intuitive, traditional heuristic approach) in his 1954 study, Clinical Versus Statistical Prediction: A Theoretical Analysis and Review of the Literature. He reviewed 20 studies that compared clinical and statistical predictions for three things: academic success, response to electric shock therapy, and criminal recidivism. In almost every instance, Meehl found that simple actuarial models outperformed the human judges. In predicting academic success in college, for example, a model using just high school grade point average and the level attained on an aptitude test (such as the SAT) outperformed the judgment of admissions officers at several colleges. Robyn Dawes, in his book House of Cards: Psychology and Psychotherapy Built on Myth, tells us more. He refers to Jack Sawyer, a researcher who published a review of 45 studies comparing the two forecasting techniques: in none was the clinical, intuitive method -- the one favored by most people -- found to be superior. What's more, Sawyer included instances in which the human judges had more information than the model and were given a result of the quantitative models before being asked for prediction. The actuarial models still beat the human judges!
Psychology researcher L. R. Goldberg went further: he devised a simple model based on the results of the Minnesota Multiphasic Personality Inventory (MMPI), a personality test commonly used to distinguish between neurosis and psychosis, to determine into which category a patient falls. His test achieved a success rate of 70 percent. He found that no human expert could match his model’s result. The best judge achieved an overall success ratio of 67 percent. Reasoning that his human judges might do better with practice, he gave training packets consisting of 300 additional MMPI profiles to his judges, along with immediate feedback on their accuracy. Even after the practice sessions, none of the human judges matched the model's success ratio of 70 percent.
What's the problem?
The problem doesn't seem to be lack of insight on the part of human judges. One study of pathologists predicting survival time following the initial diagnosis of Hodgkin's disease, a form of cancer, found that the human judges were vastly outperformed by a simple actuarial formula. Oddly, the model used exactly the same criteria that the judges themselves said they used. The judges were largely unable to use their own ideas properly. They used perceptive, intelligent criteria, but were unable to take advantage of its predictive ability. The judges themselves, not the value or their insights, were responsible for their own dismal predictive performance.
Why models beat humans
In a famous cartoon, Walt Kelly’s character Pogo says: “we've met the enemy, and he is us.”This illustrates our dilemma. Models beat the human forecasters because they reliably and consistently apply the same criteria time after time. In almost every instance, it is the total reliability of application of the model that accounts for its superior performance. Models never vary. They are always consistent. They are never moody, never fight with their spouse, are never hung over from a night on the town, and never get bored. They don't favor vivid, interesting stories over reams of statistical data. They never take anything personally. They don't have egos. They're not out to prove anything. If they were people, they’d be the death of any party.
People, on the other hand, are far more interesting. It's far more natural to react emotionally or personalize the problem than is to dispassionately review broad statistical occurrences -- and so much more fun! It's much more natural for us to look at the limited set of our personal experiences and then generalize from this small sample to create a rule of thumb heuristic. We are a bundle of inconsistencies, and although making us interesting, it plays havoc with our ability to successfully invest our money. In most instances, money managers, like the college administrators, doctors, and accountants mentioned above, favor the intuitive method of forecasting. They all follow the same path: analyze the company, interview the management, talk to customers and competitors, etc. Most, if not all, money managers think that they have the superior insights and intelligence to help them to pick winning stocks, yet 70 percent of them are routinely outperformed by the S&P 500. They are victims of their own overconfidence in their ability to outsmart and out guess everyone else on Wall Street. Even though virtually every study conducted over the last 60 years finds that simple, actuarially-based models created with a large data sample will outperform traditional active managers, they refuse to admit this simple fact, clinging to the belief that, while that may be true for other investors, it's not true for them.
Each of us, it seems, believe that we are above average. Sadly, this cannot be true statistically. Yet, in tests of people's belief in their own ability -- typically people are asked to rank their ability as drivers -- virtually everyone puts their own ability in the upper 10 to 20 percent! It may be tempting to dismiss this as a foible that highly trained professionals would not stumble into, yet Professor Nick Bostrom, the Director of the Future of Humanity Institute at Oxford University points out, in his paper Existential Risks: Analyzing Human Extinction and Related Hazard,s that “Bias seems to be present even among highly educated people. According to one survey, almost half of all sociologists believed that they would become one of the top ten in their field, and 94% of sociologists thought they were better at their jobs than their average colleagues.” In his 1997 paper the Psychology of the Nonprofessional Investor, Nobel laureate Daniel Kahneman says: "the biases of judgment and decision-making have sometimes been called cognitive illusions. Like visual illusions, the mistakes of intuitive reasoning are not easily eliminated... merely learning about illusions does not eliminate them." Kahneman goes on to say that, like our investors above, the majority of investors are dramatically over confident and optimistic, prone to illusion of control where none exists. Kahneman also points out that the reason it is so difficult for investors to correct the false beliefs is because they also suffer from hindsight bias, a condition that he described thus: “psychological evidence indicates people can rarely reconstruct, after the fact, what they thought about the probability of an event before it occurred. Most are honestly deceived when they exaggerate their earlier estimate of the probability that the event would occur... because of another hindsight bias, events that the best informed experts did not anticipate often appear almost inevitable after they occur."
If Kahneman’s insight seems hard to believe, go back and see how many of the "experts" were calling for a NASDAQ crash in the early part of the year 2000—and contrast that with the number of people who now say it was inevitable. Or go to the library and browse business magazines from the summer of 2007 -- were any of them filled with dire warnings about the coming crash in real estate and credit markets and the worst stock market downturn since the Great Depression? On January 1, 2008, would a panel of Wall Street’s top analysts, economists, market forecasters, stock pickers, and money managers ever have predicted that in less than two years, Bear Stearns would be forced to sell itself to J.P. Morgan Chase for a fraction of book value because of a run on the bank? That Lehman Brothers, a firm with more than 156 years of operating history, would collapse into bankruptcy? That Merrill Lynch-- the thundering herd -- would be forced to sell itself to the Bank of America to avoid its own collapse? That Goldman Sachs and J.P. Morgan, kings of the investment bankers, would be forced to declare themselves ordinary banks? My guess is that no matter how diligently you search, you will find no such warnings. After the fact, we see a plethora of books, articles, and documentaries chronicling the crash, with many authors claiming it was inevitable. That’s hindsight bias.
What's more, even investors who were guided by a quantitative stock selection system can let their human inconsistencies hogtie them. A September 16, 2004 issue of the Wall Street Journal includes an article entitled A Winning Stock Pickers Losing Fund. The story centers on the Value Line Investment Survey, which is one of the top independent stock research services and has a remarkable long-term record of identifying winners. According to the Wall Street Journal, "the company also runs a mutual fund, and in one of Wall Street's odd paradoxes, it has performed terribly. Investors following the Value Line approach to buying and selling stocks would've racked up cumulative gains of nearly 76% over the five years ended in December, according to the investment research firm. That period includes the worst bear market in a generation [Author’s note: they were referring to the downturn on 2000-2003, not what turned out to be the worse downturn of 2008-2009]. By contrast, the mutual fund -- one of the nation's oldest, having started in 1950 -- lost the cumulative 19% over the same period. The discrepancy has a lot to do with the fact that the Value Line fund, despite its name, does not rigorously follow the weekly investment advice printed by its parent Value Line publishing." In other words, the managers of the fund ignore their own data, thinking they can improve on the quantitative selection process! The article goes on to point out that another closed-end fund, the First Trust Value Line Fund, adheres closely to the Value Line survey advice, and has earned gains more in line with the underlying research.
Base rates are boring
The majority of investors, as well as anyone else using traditional, intuitive forecasting methods, are overwhelmed by their human nature. They use information unreliably, one time including a stock in a portfolio and another time excluding it, even though in each instance the information is the same. Our decision-making is systematically flawed because we prefer gut reactions and individual, colorful stories to boring base rates. Base rates are among the most illuminating statistics that exist. They're just like batting averages. For example, if a town of 100,000 people had 70,000 lawyers and 30,000 engineers, the base rate for lawyers is 70 percent. When used in the stock market, these rates tell you what to expect from certain class of stocks (e.g., all stocks with high dividend yields) and what that variable shows for how that category of stocks have performed over many decades of data. We have found that since the original publication of this book in 1996, the performance of the various factors we studied has persisted. Remember that the base rates tell you nothing about how each individual member of that class will behave, rather they inform at the level of all stocks with high dividend yields or whatever factor is being reviewed.
Most statistical prediction techniques use base rates. 75 percent of university students with grade point averages above 3.50 go on to do well in graduate school. Smokers are twice as likely to get cancer. The average 70-year old in the United states can expect, based on actuarial tables, to live another 13 ½ years. Stocks with low PE ratios outperform the market 99 percent of all rolling ten-year periods between 1964 and 2009. The best way to predict the future is to bet with the base rate that is derived from a large sample. Yet, numerous studies have found that people make full use of base rate information only when there is a lack of descriptive data. In one example, people are told that out of a sample of 100 people, 70 are lawyers and 30 are engineers. When provided with no additional information and asked to guess the occupation of a randomly selected 10, people use the base rate information, saying that all 10 are lawyers, by doing so they ensure themselves of getting the most right.
However, when worthless yet descriptive data are added, such as "Dick is a highly motivated 30-year-old married man who is well-liked by his colleagues," people largely ignored the base rate information in favor of their "feel" for the person. They're certain that their unique insights will help them make a better forecast, even when the additional information is meaningless. We prefer descriptive data to impersonal statistics because it better represents our individual experience. Then when stereotypical information is added, such as "Dick is 30 years old, married, shows no interest in politics or social issues, and likes to spend free time on his many hobbies, which include carpentry and mathematical puzzles," people totally ignore the base rate and say that Dick’s an engineer, despite a 70 percent chance that he is a lawyer. This bias has been proven time and again with numerous tests over a range of subjects. People always default to making predictions based upon their individual experience and intuition.
It's difficult to blame people. Base rates are boring; experience is vivid and fun. The only way anyone will pay 100 times a company's earnings for a stock if it's got a tremendous story. Never mind that stocks with high PE ratios beat the market less than 1 percent of the time over all rolling 10-year periods between 1964 and 2009—the story is so compelling, you’re happy to throw the base rates out the window.
The individual versus the group
Human nature makes it virtually impossible to forgo the specific information of an individual case in favor of the results of a great number of cases. We're interested in this stock and this company, not with this class of stocks or with this class of companies. Large numbers mean nothing to us. As Stalin chillingly said: "one death is a tragedy, a million, a statistic." When making an investment, we almost always do so on a stock-by-stock basis, rarely thinking about the overall strategy. If a story about one stock is compelling enough, were willing to ignore what the base rates tell us about an entire class of stocks.
Imagine if the life insurance industry made decisions on a case-by-case basis. An agent visits you at your home, checks out your spouse and children, and finally makes a judgment based on his gut feeling. How many people who should get coverage would be denied, and how many millions of dollars in premiums would be lost? The reverse is also true. Someone who should be denied life insurance might be extended coverage because the agent’s gut feeling was this individual is different, despite what actuarial tables say. The company would lose millions in additional payouts. The reason life insurance companies are so profitable, however, is because they base coverage and premiums solely on what the actuarial tables tell them. Actuarial tables are developed using huge databases of human mortality statistics based on underlying characteristics such as weight, family history of disease, blood work, blood pressure, smoking and drinking habits, and prior history.
They tell you what to expect the central tendencies of a large group will be. If you are 33 years old, have no family history of heart disease or cancer, are a non-smoker and moderate drinker, have normal blood pressure and excellent blood work your chances of being extended life insurance at a low rate are excellent. Why? Because the mortality tables say that it is highly unlikely for you to die anytime soon. Does that mean that the life insurance companies will make money on all 33-year-olds? No. There will be rare instances where a freak accident kills some of these healthy young people, but the vast majority of them will go on living and paying their premiums to the life insurance company.
The same thing happens when we think in terms of individual stocks, rather than stock selection strategies. A case-by-case approach wreaks havoc with returns, because it virtually guarantees that many of our choices will at least partially include our emotions. This is a highly unreliable, unsystematic way to buy stocks, yet it's the most natural and the most common. In the 13 years since the initial publication of this book, I have given hundreds of presentations about its findings. I always note people nodding their heads when I tell them that low price sales stocks do vastly better than stocks with high price to sales. They agree because this is a simple fact and it makes intuitive sense to them that paying less for every dollar of sales should lead to higher returns than paying more for every dollar of sales. But when I give them some of the actual names of stocks that meet these criteria, their demeanor visibly changes. Hands will go up with statements like: "what a dog" or "I hate that industry," simply because we have now provided them with specific individual stocks about which they may have ingrained prejudices. Combating these personal feelings, even when we are aware of the bias, is a very difficult task indeed.
Personal experience preferred
We also place more reliance on personal experience than impersonal base rates. An excellent example is the 1972 presidential campaign. The reporters on the campaign trail with George McGovern unanimously agreed that he could not lose by more than 10 percent, even though they knew he lagged the in the polls by 20 percent, and that no major poll had been wrong by more than 3 percent in 24 years. These tough, intelligent people bet against the base rate because the concrete evidence of their personal experience overwhelmed them. They saw huge crowds of supporters, felt their enthusiasm, and trusted their feelings. In much the same way, a market analyst who has visited the company and knows the president will largely ignore the statistical information that tells him the company is a poor investment if the company’s executives do a good job in persuading him that while that might be true in general, it does not hold for their company because of any number of colorful stories they might tell him. In social science terms, he's overweighting the vivid story and underweighting the pallid statistics.
Investors do this all the time, and a story told to me by a colleague clearly illustrates that this can lead to disastrous results. At an investment conference in 2001, a portfolio manager who owned a large stake in Enron was asked repeatedly what was going on with the company. Enron shares had fallen from an August 2000 high of $90 per share to the mid-40s and investors wanted to know what the portfolio manager’s thoughts were about the future of Enron. The manager responded that he felt everything was fine at Enron; in fact, he had recently attended a barbecue at the CFOs home where many upper management executives were present. They had all assured him that everything was fine at Enron; the manager went on to say that he was so relieved with their explanation that he was buying more Enron shares. Late in 2001, Enron filed for bankruptcy and its shares traded at one dollar. Clearly, this manager’s judgment was clouded by a reliance on stories and personal relationships, which blinded him to the facts. His relationship with the executives, many of whom went on to plead guilty to securities fraud and other fraudulent management practices, helped him turn a blind eye to what the market seemed to think—There was something rotten at Enron’s core.
There are many similar examples to prove the point. According to Barton Biggs’ book Wealth, War and Wisdom, there is ample evidence that so-called experts making intuitive forecasts are right less than half the time and that “they were worse than dart-throwing monkeys in forecasting outcomes when multiple probabilities were involved.” And the study he was referring to did not use a small sample -- it covered 284 experts who made 82,361 forecasts over a period of years. The book concluded that most of these errors were made because analysts made decisions using intuitive, emotional heuristics. Biggs is not alone—in his book Value Investing: Tools and Techniques for Intelligent Investment, James Montier writes: “One of the recurring themes of my research is that we just can’t forecast. There isn’t a shred of evidence to suggest that we can. This, of course, doesn’t stop everyone from trying. Last year, Rui Antunes of our quant team looked at the short-term forecasting ability of analysts. The results aren’t kind to my brethren. The average 24-month forecast error is around 94%, the average 12-month forecast error is around 45%.”
In his book Expert Political Judgment, Philip Tetlock said, "human performance suffers because we are, deep down, deterministic thinkers with an aversion to probabilistic strategies that accept the inevitability of error." In other words, even though the rational thing to do is bet with the base rate and accept that we will not always be right, we are forever rejecting the long-term evidence in the face of the short-term hunch, even though the probability of being correct plummets.
In regard to the stock market, many have hypothesized that analysts get much more confident about their predictions after they have met the management of the company and formed personal opinions about their talent -- or lack thereof. They often can be seen clinging to these opinions even after factual events have proved them wrong. Think of all of the investors who, at the end of the 1990s, based their investment decisions just on their most recent personal experience in the market. For this intuitive investor, the only game in town was technology stocks and other large-cap growth fare. Every bit of their personally experience suggested that it was different this time, that a “new era “had dawned, and that only those who implicitly rejected history would do well going forward. And the majority of them held on to that belief through the crash of 2000-2003, so certain were they that a rebound was right around the corner. Only after 2 1/2 years of "new personal experience" did these hapless intuitive investors learn that it wasn't different this time. Indeed, investors began falling for new catch phrases after the heart-pounding losses of 2008 and early 2009, when many investors started buying into the concept that the bear market low in March 2009 was the “new normal.” Proponents of this “new normal” believe that returns in the future are destined to be disappointing and that investors should once again ignore history and change their behavior based upon short-term market conditions. I believe that several years from now, that catchphrase will be found in the same dustbin of history where the “new era” currently languishes. Yet through it all, most investors held on to their inherent biases towards overconfidence.
Simple versus complex
We also prefer the complex and artificial to the simple and unadorned. We are certain that investment success requires an incredibly complex ability to judge a host of variables correctly and then act upon that knowledge. Prof. Alex Bavelas designed a fascinating experiment in which two subjects, Smith and Jones, face individual projection screens. They cannot see or communicate with each other. They're told that the purpose of the experiment is to learn to recognize the difference between healthy and sick cells. They must learn to distinguish between the two using trial and error. In front of each are two buttons marked Healthy and Sick, along with two signal lights marked Rght and Wrong. Every time the slide is projected, they guess if it's healthy or sick by pressing the button so marked. After they guess, their signal light will flash Right or Wrong, informing them if they have guessed correctly.
Here's the hitch—only Smith gets true feedback. If he's correct, his light flashes Right, if he's wrong, it flashes Wrong. Because he's getting true feedback, Smith soon starts getting around 80% correct, because it's a matter of simple discrimination.
Jones's situation is entirely different. He doesn't get true feedback based on guesses. Rather, the feedback he gets is based on Smith's guesses! It doesn't matter if he's right or wrong about a particular slide; he’s told he’s right if Smith guessed right or wrong if Smith guessed wrong. Of course, Jones doesn't know this. He's been told that a true order exists that he can discover from the feedback. He entered searching for order when there is no way to find it.
The moderator then asks Smith and Jones to discuss the rules they use for judging healthy and sick cells. Smith, who got true feedback, offers rules are simple, concrete, and to the point. Jones on the other hand, uses rules that are, out of necessity, subtle, complex, and highly adorned. After all, he had to base his opinions on contradictory guesses and hunches.
The amazing thing is that Smith doesn't think Jones's explanations are absurd, crazy, or unnecessarily complicated. He's impressed by the "brilliance" of Jones's method and feels inferior and vulnerable because of the pedestrian simplicity of his own rules. The more complicated and ornate Jones's explanations, the more likely they are to convince Smith.
Before the next test with new slides, the two are asked to guess who will do better than in the first time around. All Joneses and most Smiths say that Jones will. In fact, Jones shows no improvement at all. Smith, on the other hand, does significantly worse than he did the first time around, because he's now making guesses based on some of the complicated rules he learned from Jones.
A simple solution
William of Ockham, a 14th century Franciscan monk from the village of Ockham, in Surrey, England, developed the principle of parsimony, now called Occam's razor. For centuries it has been a guiding principle of modern science. It axioms -- such as “what can be done with fewer assumptions is done in vain with more," and "entities are not to be multiplied without necessity” -- boil down to this: Keep it simple, sweetheart. Occam's razor shows that most often, the simplest theory is the best.
This is also the key to successful investing. Successful investing, however, runs contrary to human nature. We make the simple complex, follow the crowd, we allow our love of a story about some stock inflame our emotions and dictate decisions, buying and selling based on tips and hunches, and approach each investment decision on a case-by-case basis, with no underlying consistency or strategy. We are optimistically over-confident in our own abilities, prone to hindsight bias, and quite willing to ignore over 80 years of facts that show this to be so. When making investment decisions, we do everything in the present tense. And, because we time-weight information, we give the most recent events the greatest import. Indeed, behavioral economists call this tendency recency bias which is the tendency to remember more recent events or observations more clearly and to overweight recent information and underweight events from the more distant past. We then extrapolate anything that has been working well recently very far out in time, assuming it will always be so. How else could the majority of investors have concentrated their portfolios in large-cap growth stocks and technology shares right before the technology bubble burst in 2000 and the biggest bear market for the NASDAQ since the 1970s ensued?
More recently, on the heels of the market crash of 2008-2009, investors have learned a far different lesson. Because the decade from 2000 through 2009 was the worst for US stock performance in 110 years, investors have pulled trillions of dollars from stocks and moved their investment into bonds, the asset class that has done the best recently, ignoring the fact that 110 years of market history shows us that bonds almost never outperform equities over long periods of time.
It's extremely difficult not to make decisions this way. Think about the last time you really goofed. Time passes and you see: what was I thinking! It's so obvious that I was wrong, why didn't I see it? The mistake becomes obvious when you see the situation historically, drained of emotion and feeling. When the mistake was made, you had to contend with emotion. Emotion often wins, since, as John Junor said, "an ounce of emotion is equal to a ton of facts."
This isn't a phenomenon reserved for the unsophisticated. Pension sponsors have access to the best research and talent that money can buy, yet are notorious for investing heavily in stocks just as the bear market begins and for firing managers at the absolute bottom of their cycle. Institutional investors say they make decisions objectively and unemotionally, but they don't. The authors of the book Fortune and Folly found that, although institutional investor’s desks are cluttered with in-depth, analytical reports, the majority of pension executives select outside managers using gut feelings. They also retain managers with consistently poor performance simply because they have good personal relationships with them.
The path to achieving investment success is to study long-term results and find a strategy or group of strategies that make sense. Remember to consider risk (the standard deviation of return, more on that later) and choose a level that is acceptable. Then stay on that path. To succeed, let history guide you. Successful investors look at history. They understand and react to the present in terms of the past. Yesterday and tomorrow, as well as today, make up their now. Something as simple as looking at strategies best and worst years is a good example. Knowing the potential parameters of a strategy gives investors a tremendous advantage over the uninformed. If the maximum expected losses from a strategy are 35 percent and the strategy is down 15 percent, instead of panicking, an informed investor can feel happy that things aren't as bad as they could be. This knowledge tempers expectations and emotions, giving informed investor's a perspective that acts as an emotional pressure valve. Thinking historically, they let what they know transcend how they feel. This is the only way to perform well.
The data in this book gives perspective. It helps you understand the hills and valleys are part of every investment scheme and are to be expected, not feared. It tells you what to expect from various classes of stocks. Don't second guess. Don't change your mind. Don't reject an individual stock – if it meets the criteria of your strategy -- because you think that individual security will do poorly. Don't try to outsmart. Looking at decades of data, you see that many strategies have periods during which they didn't do as well as the S&P 500, but also had many that did much better. Understand, see the long-term, and let it work. If you do, your chance of succeeding is very high. If you don't, no amount of knowledge or data will help you see, and you'll find yourself with the 80 percent of underperformers thinking: "what went wrong?"
13 notes
·
View notes
Text
Mother Nature designed you to be a bad investor
Mother Nature has it in for your investment results. She has programmed all of us to make a lot of mistakes when making investment decisions. Using the world’s largest twin registry, the Swedish Twin Registry, matched with detailed data on identical twins’ (who share 100 percent of their genes) investment behaviors, allowed researchers Henrik Cronqvist and Stephan Siegel to tease out how much our genetic programming affected our investment behavior. In their paper, “The Genetics of Investment Biases,” the authors state:
“For a long list of investment ‘biases,’ including lack of diversification, excessive trading, and the disposition effect, we find that genetic differences explain up to 45% of the remaining variation across individual investors, after controlling for observable individual characteristics. The evidence is consistent with a view that investment biases are manifestations of innate and evolutionary ancient features of human behavior.”
In other words, all of the things that helped us survive as a species tend to make us horrible investors. Here’s psychologist Philip Zimbardo’s take:
“Because of the rapid change of the world around us since our birth, we humans are living anachronisms. Our world has changed dramatically in the past 150 years. Human physiology, in contrast, took millions of years to create and has not changed much in 150,000 years. Your body—even if it is in mint condition—is designed for success in the past. It is an antique biological machine that evolved in response to a world that no longer exists. Although we live in a world in which computer processing speed doubles roughly every twenty-four months, human information processing has not expanded substantially over the past 150,000 years. Our physiology is clearly behind the times.”
Our very humanity serves as a significant headwind to long-term investment success. It’s why each generation commits the very same investment mistakes time after time—selling near market bottoms; buying enthusiastically after the market has gone significantly higher; failing to do any real homework on an investment’s particular merits, all of which generally leads to very poor results.
I have long said that the four horsemen of the investment apocalypse are fear, greed, hope and ignorance. And note, that of the four, only one is not an emotion. These four things have wiped out more value in an investor’s portfolio than even the most vicious bear market. So what are we to do?
First, take this article to your investment advisor—and if you don’t have one, I highly recommend you find one for this plan to work. Tell your advisor that you want to work with them on building a rules-based methodology to guide your investments. Acknowledge that you realize at some point in the future you will become extremely emotional about some component of your overall investment portfolio and that you give them permission—I would go so far as actually writing up your plan and have you and your advisor sign it—so that they can show it to you when things look particularly bleak. It really doesn’t have to be anything fancy—indeed, it could be a simple commitment to keep your overall portfolio allocation in line with what you agree seems a prudent allocation.
So, for example, if you have decided that you want 60 percent of your investments in stocks and 40 percent in bonds, this agreement allows your advisor to sell down an asset as it exceeds the allocation and move the money toward assets that have declined and are below the allocation you agreed to when you started. Think of how well this would have worked during the financial crisis: Instead of panic selling your stock holdings, this simple agreement would have you selling some of your bond holdings—which did well—and reallocating those funds to equities. Of course, almost no one actually did that during the crisis. Yet, if you had this rules-based system in place, coupled with your new knowledge of how nature has stacked the deck against our succeeding with our investments, you would have. And would have been very happy you did, looking back from today’s vantage point. It might not be nice to fool Mother Nature, but it’s the only way to ensure investment success.
10 notes
·
View notes
Text
Hey 54-year-old boomers, stocks are still the best thing to hold until you turn 65.
“The Chinese use two brush strokes to write the word ‘crisis.’ One brush stroke stands for danger; the other for opportunity. In a crisis, be aware of the danger—but recognize the opportunity.”
~John F. Kennedy
As stock prices skid lower and lower, ask yourself this question: “When do I need the money that I currently have invested in the stock market?” Chances are, you don’t need it tomorrow. And if you DO need it tomorrow, you should never have invested in the stock market in the first place. I recommend that you need a minimum five-year time horizon before you should invest any money in stocks. Let’s say that you, like me, are 54 years old and reckon that you will need the money at age 65. That’s an 11-year time horizon. Next, look at what the possible outcomes are over that 11 year holding period. Between 1926 and 2014, here are the average, inflation-adjusted gains for four asset classes:
*S&P 500: inflation-adjusted average cumulative 11-year return is 136 percent, with $10,000 growing to $23,600.
*U.S. Long-term Treasury bond: inflation-adjusted average cumulative 11-year return is 37 percent, with $10,000 growing to $13,700.
*U.S. Intermediate-term Treasury bond: inflation-adjusted average cumulative 11-year return is 30 percent, with $10,000 growing to $13,000.
*U.S. T-bills: inflation-adjusted average cumulative 11-year return is 6 percent, with $10,000 growing to $10,600.
Now clearly, stocks—the asset class that appears the most risky right now and over the short-term--provides the best return of all of the basic investments available to you right now. And keep in mind, U.S. bonds are coming off their best returns ever, so it is very unlikely that they will provide returns near the long-term averages—indeed, they are far more likely to provide very poor returns over the next 11 years.
For those bears among us, what about if we match the worst 11-year returns for each asset class over the next 11 years, something I think is highly unlikely, especially for stocks. Here are the worst 11-year returns for each of the four asset classes:
*S&P 500: inflation-adjusted worst cumulative 11-year return is -36 percent, with $10,000 falling to $6,400.
*U.S. Long-term Treasury bond: inflation-adjusted worst cumulative 11-year return is -42 percent, with $10,000 falling to $5,800.
*U.S. Intermediate-term Treasury bond: inflation-adjusted worst cumulative 11-year return is -37 percent, with $10,000 falling to $6,300.
*U.S. T-bills: inflation-adjusted worst cumulative 11-year return is -43 percent, with $10,000 falling to $5,700.
Amazing—even if you are expecting the next 11 years to duplicate the worst 11-year periods for each asset class, you’re still better off remaining in stocks, with all the others providing worse returns.
The next thing you need to consider are the odds of negative returns for each asset class over the next 11 years. Between 1926 and 2014, here’s the percentage of the times each asset class provided inflation-adjusted 11-year losses (of any magnitude):
*S&P 500: 17 percent of all rolling 11-year holding periods.
*U.S. Long-term Treasury bond: 43 percent of all rolling 11-year holding periods.
*U.S. Intermediate-term Treasury bond: 29 percent of all rolling 11-year holding periods.
*U.S. T-bills: 38 percent of all rolling 11-year holding periods.
There you have it—whatever metric you choose to look at points to stocks as the least risky asset for you to hold over the next 11 years. They have the fewest negative 11-year returns; their worst-case scenario is the best of the four asset classes and their average 11-year inflation-adjusted returns are dramatically better than the other three.
So, if you are a fellow 54-year-old, don’t think about what is happening to your portfolio today, think of where you want it to be when you’re 65.
7 notes
·
View notes
Text
Price-to-Book Value Ratios: A Long-Term Winner with Long Periods of Underperformance
Many investors believe that price-to-book value ratios are more important than price-to-earnings (“PE”) ratios when looking for a bargain. They argue that earnings can be easily manipulated by a clever chief financial officer, using an old joke as an example: A company wants to hire a new chief financial officer. Each candidate is asked just one question. “What does two plus two equal?” Each candidate answers four, with the exception of the one they hire. Her answer was: “What number did you have in mind?”
You find the price-to-book ratio by dividing the current price of the stock by the book value per share. Here, we use the common equity liquidating value per share as a proxy for book value per share. Essentially, investors who buy stocks with low price-to-book value ratios believe they are getting stocks at a price close to their liquidating value, and that they will be rewarded for not paying high prices for assets.
Price-to-book has long been a favorite value ratio. Ben Graham, the founder of modern securities analysis, made it a central factor in his rules for investing featured in The Intelligent Investor, saying that to maintain a “margin of safety” one should pay no more than 1.2 times book value for a stock. (Graham realized that companies with a lot of intangible assets, such as brand recognition, could be profitable investments and argued that for such companies one could pay as much as 2.5 times book and still do well.)
Eugene Fama and Ken French immortalized price-to-book in their three-factor model published originally in the June 1992 edition of Journal of Finance, in which they claimed that a simple three-factor model could explain almost all of a portfolio’s return. The three factors were:
The portfolio’s exposure to the market itself;
The portfolio’s exposure to small-cap stocks and
The portfolio’s price-to-book ratio.
Fama and French went on to create both large-cap and small-cap value and growth portfolios using price-to-book value ratios as their guide. Large and small-cap value portfolios were comprised of the large and small stocks that were in the bottom 30 percent by price-to-book (i.e., the 30 percent of stocks with the lowest price-to-book value ratios), whereas large and small-cap growth portfolios were those with stocks in the highest 30 percent based upon price-to-book ratios. These portfolios originate in 1927 and show the long-term efficacy of value, as opposed to growth, investing.
Several other studies confirmed these findings, but over shorter periods of time. One featured in the January 11th, 1989 edition of The Wall Street Journal, was a study conducted by Professor Marc Reinganum, then a professor at the University of Iowa and currently a Senior Managing Director at State Street Global Advisors. Reinganum’s study looked at the common characteristics of 222 stocks that tripled in price in a calendar year in the 1970-1983 period. One of his findings was that many of the winners had a per share price that was less than the per share book value. Finally, in his “Decile Portfolios of the New York Stock Exchange, 1967-1984” Working Paper, Yale School of Management, 1986, Roger Ibbotson showed that the decile of stocks with the lowest price-to-book value ratio earned compound annual returns of 14.36 percent whereas the stocks in the decile of stocks with the highest price-to-book ratios earned compound annual returns of just 6.06 percent.
What Works on Wall Street has Similar Findings, But…
When we look at the composited results for our All Stocks and Large Stocks universes over the entire 1927-2013 period, we also find that buying stocks with low price-to-book value ratios works, but we find that there are long sub-periods where low price-to-book value ratios, especially the lowest ten percent, do not work well at all. For example, using our data to look at the same period that Roger Ibbotson studied, 1967-1984, we find very similar results to Ibbotson’s. The table below shows the results for each of the ten deciles from the All Stocks universe by price-to-book value, with decile one containing the ten percent of stocks with the lowest price-to-book value ratios and decile ten containing the ten percent with the highest price-to-book value ratios. Note that for we are sorting by book-to-price rather than price to-book and this the inversion.
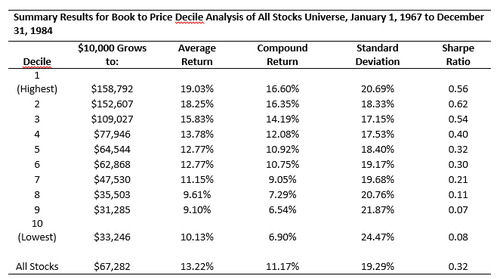
They descend in near perfect order for the 18 years studied, with the stocks with the lowest price-to-book ratios earning 16.60 percent and then declining with each dollar more an investor is willing to pay for book value to deciles nine and ten, which earn 6.54 percent and 6.90 percent respectively. As you can see by looking at the table, in each instance, an investor in decile eight, nine or ten would have been better off investing in U.S. T-bills, which earned 7.43 percent over the same period.
Yet, over longer periods of time, the results do not hold to the pattern found for these 18 years. Indeed, we will see in a moment that analyzing the results for stocks based on their price-to-book value ratios underlines and highlights why we should always seek access to the longest datasets we can find, as they offer much better indications of what investors should expect from various types of investing.
Now that we have the CRSP data and the Fama and French price-to-book value data, we can see that for the 36-year period from 1927 through 1963 (when our COMPUSTAT dataset begins), featured in the table below, the decile of stocks with the lowest price-to-book value ratios was actually the worst performing of all the deciles! (Please keep in mind that the stocks with the highest book to price are actually those with the lowest price-to-book. Deciles two, three; four and five all outperformed the All Stocks universe, showing that stocks with lower price-to-book value ratios did well, but not those with the lowest.
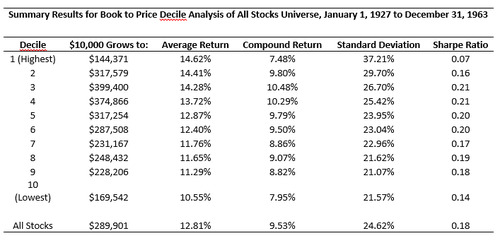
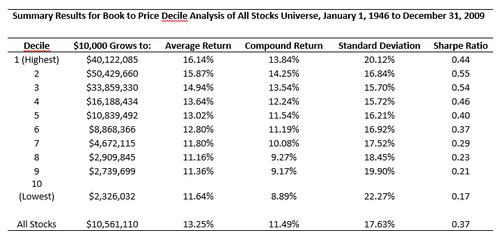
Over the same period, an examination of the Fama-French Large Value and Small Value indexes returns, available through EnCorr Analyzer, earned an average annual compound return of 10.81 percent and 11.77 percent, respectively. There are two reasons why this might be so: First, Fama and French allowed microcap stocks that What Works on Wall Street excludes, and second, as mentioned earlier, the Fama and French data looks at the lowest 30 percent by price-to-book value (essentially deciles one, two and three combined.) Finally, to get a sense of what buying stocks with low price-to-book ratios looks like post-World War II, look at the table below—where we see once again the familiar pattern of stocks with the lowest price-to-book ratios handily beating both the All Stocks universe and stocks with the highest price-to-book ratios. Deciles one and two each beat the All Stocks universe by an average annual compound return of 2.35 percent or more, whereas deciles nine and ten both underperform the All Stocks universe by an average annual compound return of 2.33 percent or more.
What Sub-period Analysis Teaches Us
By looking at the various sub-periods, we learn three important lessons:
The results for shorter periods of time should be taken with a large grain of salt. If we only looked at the 1967-1984 results, we would think that buying stocks with the lowest price-to-book value ratios was a fantastic way to buy stocks, whereas if we looked at the 1927-1963 data, we would see that while stocks with lower price-to-book value ratios did well, you should actually avoid the stocks with the lowest price-to-book value ratios at all costs, as they were the worst performing decile for that period. Factors that exhibit such variance over various time periods should be used carefully. Also, we’ve seen that other factors, such as buyback yield, shareholder yield and price momentum do not exhibit such erratic performance patterns and are therefore more stable than those factors--like price-to-book--which do.
It may be best to combine factors in a composited format so that if one is underperforming—as we saw with stocks from All Stocks with the lowest price-to-book value ratios between 1926 and 1963—the other factors, such as PE, price-to-sales, price-to-cash flow, etc. may be working better and therefore strengthen the efficacy of an overall value approach. We will revisit this approach in Chapter Fifteen.
Finally, we might also note that one horrific period for any factor can ripple forward for quite some time, perhaps masking the overall value of the factor. Looking at the table below, we see that almost all of the damage done to the stocks from All Stocks with the lowest price-to-book value ratios was done during the Great Depression. Between 1927 and 1939, the stocks in decile one—the ten percent of stocks from All Stocks with the lowest price-to-book value ratios—actually lost 6.55 percent per year, whereas stocks in decile nine—those stocks from All Stocks with the second highest price-to-book value ratios actually gained 4.78 percent per year. This could be the result of value stocks being a proxy for companies in distress. As Robert Haugen points out in his paper “The Effects of Intrigue, Liquidity, Imprecision, and Bias on the Cross-Section of Expected Stock Returns”, “They (Fama and French) argue that firms with low price-to-book ratios (value stocks) tend to be companies in distress. This being the case, the high returns to these stocks may come as no surprise to the market. The high expected returns to value stocks may be risk premiums that investors require as compensation for investing in companies that are in relatively weak financial condition”
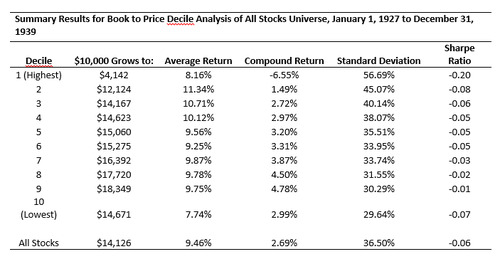
Obviously, if stocks with low price-to-book ratios are a proxy for weak, risky companies, it would be no surprise that a great economic depression might send many of them into bankruptcy, thus sending them to the bottom of the performance list. Indeed, the performance of stocks with low price-to-book ratios during the recent market crash of 2007-2009 exhibit similar performance—investors, perhaps for the first time since the Great Depression, were expecting extremely weak economic conditions, and the performance of low price-to-book stocks ended up at the bottom, as the table below shows us.
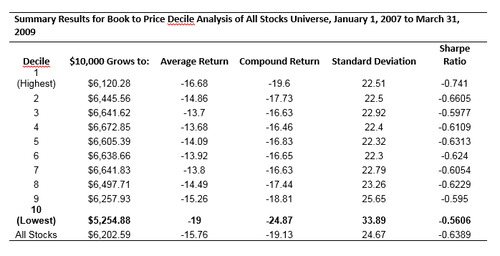
It’s also instructive to see that the more data we have access to, the more we are able to learn. In the case of picking stocks on price-to-book value ratios, here’s what the last 88 years demonstrate:
• Be wary of studies that cover only a limited period of time. For instance, Roger Ibbotson’s “Decile Portfolios of the New York Stock Exchange, 1967-1984” showed that the decile of stocks with the lowest price-to-book value ratios earned compound annual returns of 14.36 percent whereas the stocks in the decile of stocks with the highest price-to-book ratios earned compound annual returns of just 6.06 percent. But that was only 17 years of data, and as we have seen, such a limited dataset limits your ability to draw true conclusions as to how robust the results actually are.
•It is not always the lowest absolute rankings of a value factor that do the best. One of the reasons we moved to decile analysis for this version of the book was because looking at the highest and lowest 50 stocks might be too restrictive. Here, we see that most of the value of price-to-book is unlocked in the second and third deciles. It is worth studying all of the deciles for all the factors we cover to see how uniform the return patterns are for each decile.
• Because of the skewed nature of the returns to decile one in the 1920s and 1930s, an analysis of the group between 1926 and 1963 shows that buying low price-to-book stocks failed to beat the All Stocks universe. As we dug deeper, we saw that this was largely due to the beating they took in the 1930s, and serves as a reminder that we should always go as deep into the data as possible.
• Finally, this highlights the dangers of relying on a single factor. Had you conducted a study in 1963 for the period 1926 through 1963, you would have concluded that price-to-book was truly erratic, with both the cheapest stocks—decile one—and the most expensive stocks—decile ten—underperforming the All Stocks universe. Between 1926 and 1963, an investment in the All Stocks universe earned an average annual compound return of 9.43 percent whereas an investment in decile one by price-to-book earned just 7.41 percent, but decile ten earned 7.71 percent. Only the fullness of time revealed the erratic nature of the price-to-book ratio. This also argues the importance of looking at a variety of factors, as I demonstrated in my post about our value composite.
Here are the results for the full 88 years, from January 1st, 1927 through November 30, 2013. (Sorry for the stub period, we’re constantly updating the data.)

12 notes
·
View notes
Text
101 Years on Wall Street
A great book for investors to read to get a long-term, historical perspective on the stock market’s ups and downs is “101 Years on Wall Street” by John Dennis Brown. It chronicles each year from 1890 through 1990, and as you read about each year, several things will become obvious—investors have not changed at all! Panics? We’ve had a ton of them. To wit, here’s Brown on 1907: “The autumn panic of 1907 was the worst since 1893. And the last great mercantile and commercial crisis of the era, one played out with classic excesses.” It took J.P. Morgan (the man) to step in and solve the crisis and it spurred the creation of the Federal Reserve.
How about manias? Here’s Brown on the speculative fever of 1928: “Street dealers accommodated the new stock junkies with pools, manipulations, and an orgy of stock offerings. And, best of all, with higher prices. Radio Corporation was a real fix, being levitated from 85 to 420. Warner Brothers celebrated talking pictures and a new Al Jolson contract with a long run from 13 to 138.”
Reading over all the years, you can see that nothing has changed. Radio and talking pictures were the internet startups of that era, and as you can probably guess, were crushed as badly as the net companies where in the early 2000’s. RCA went from a high of 114.75 to a low of 2.50! Busts followed booms, and only the names of the stocks that were everyone’s darlings changed. In the 1960’s and ‘70s it was the nifty fifty, a group of 50 popular stocks that investors believed should be bought and never sold, no matter what the valuation.
If all of this sounds painfully familiar, it’s because it is. It seems that investors can never learn from the past, and are forever condemned to repeat it. The four horseman of the investor apocalypse are fear; greed; hope and ignorance. Note that only the last one is not an emotion—fear, greed and hope are responsible for more investment loses than any bear market. I’ve been in this business professionally since 1987 and have tried to convince investors that simple rules, if followed, can save you an enormous amount of heartache and provide you with a vastly more profitable outcome.
Yet human nature is a hard thing to overcome. H. L. Mencken said “What ails the truth is that it is mainly uncomfortable, and often dull. The human mind seeks something more amusing, and more caressing.” We are designed by evolution to respond to stories and pay greater attention to those that fit into our preprogramed narrative. It’s what makes us believe we have the skills to pick the winning stocks, to time the market by getting out near the top and back in near the bottom.
All of the factual evidence serves as proof that we can’t. Reading “101 Years on Wall Street” might help you understand that nothing has fundamentally changed for investors and truly understanding that should help you vastly improve your investment strategy.
7 notes
·
View notes
Text
Sticking to a long-term strategy in a short-term world
CNBC asked me to participate in a program called the Platinum Portfolio, in which each manager was asked to come on Squawk Box in the spring with three stocks they thought would do well over the next year. I happily accepted the invitation – and picked my stocks in April. I participated in my second interview on Monday – the official checkpoint on the performance of my picks. Spoiler alert: the interview drove home the very nature of our time-tested, long-term approach to investing.
Let’s take a step back for some context here. My whole investment view is that you buy the shares that score the best on our various factor composites, (Value; Earnings Quality; Financial Strength and dividend yield).
To build a Global High Dividend Yield portfolio, we look for stocks that:
are cheap, based upon our value composite;
have good earnings quality, i.e., their books are clean and their account practices are sound;
have good Financial Strength, or the ability to continue to pay a good dividend.
We then buy all the stocks from this group paying the highest dividend yields. Since we run our screens once a month, a stock that continues to meet our criteria gets a larger weight in the portfolio, as its multiple appearances in the screens add to our conviction that they should be among the better performers in the portfolio as a whole. So we end up with a concentrated, conviction-weighted portfolio.
Now, back to my Platinum Portfolio segment.
The three stocks I focused on for CNBC’s Platinum Portfolio are:
Canadian Oil Sands Ltd ($COSWF), which has a market cap of $8.7 Billion; a dividend yield of 7.14% and is cheaper than 68% of the stocks in our Large Stocks Universe based on our value composite.
Ecopetrol SA ($EC), which has a market cap of $64 Billion; a dividend yield of 7.55% and is cheaper than 81% of the stocks in our Large Stocks Universe based on our value composite.
Telefonica Brasil ($VIV), which has a market cap of $14.1 Billion; a dividend yield of 3.95% and is cheaper than 93% of the stocks in our Large Stocks Universe based on our value composite.
So far, so good.
Wait. Not so fast. At the time of segment earlier this week, the three stocks were down on average 6.42% since I debuted them in April, whereas the MSCI ACWI ($ACWI) was up 4.61% over the same period. (We use the ACWI because all three names are non-U.S. companies.) So, the question becomes, do we keep these names or switch to better names? It’s a natural question – and one that gets at the very heart of my investment view: look long term. Because if we as investors let the short-term drive us, the results will be predictably bad. And I passionately believe the only way to have long-term success investing in equities is to have a rules-based buy and sell discipline.
Don’t listen to your gut
I can’t imagine how someone who isn’t using a rules-based process could handle having three of their picks down when the market is up. The stress of making gut decisions must be killer. But I think the long-term results of making gut decisions in investing is overwhelmingly negative. According to a study by Dalbar, for the 30 years ending in 2013, the average equity fund investor earned just 3.69% a year versus a total return for the S&P 500 ($SPX) of 11.11% per year! Indeed, the average equity fund investor would have been better off leaving their money in U.S. T-Bills, which earned 4. 01% a year over the same period. What’s worse, Dalbar said that “attempts to correct irrational investor behavior through education have been futile.” (Story here.)
The whole point of quantitative investing is to use a strategy that has done very well over the long-term and has a very high base rate of beating its appropriate benchmark. But another benefit of using a strategy tested over the long-term is knowing going into it that you will have a failure rate. If a strategy has a 70% annual base rate for beating its benchmark, you know that you will underperform the benchmark in three of every 10 years. Conventional investors would never buy a stock that they thought was going to go down, whereas we quants place all of our faith in the probabilities – not possibilities – of success, and accept willingly that we’ll have our share of losers.
Now, I have no idea how the three stocks I selected will end up doing when they reach the one-year mark (we use an annual rebalancing method), but I do know what the odds of our strategy of buying cheap, high-quality global stocks are—high. Without the discipline of our automated buy and sell rules, I am quite sure that I would behave just as emotionally as the next guy. But my experience on Squawk Box really drives home the difficulty conventional investors must face in trying to achieve long-term success in a short-term world.
Finally, if an investor can’t embrace a quantitative, rules-based investment strategy, my recommendation is simple—put your money in an index fund and remove the stress and uncertainty that all of the short-term news throws your way.
12 notes
·
View notes