Text
The Supply and Demand of the Playstation 5
Aaron Bautista
Student ID - #84903108
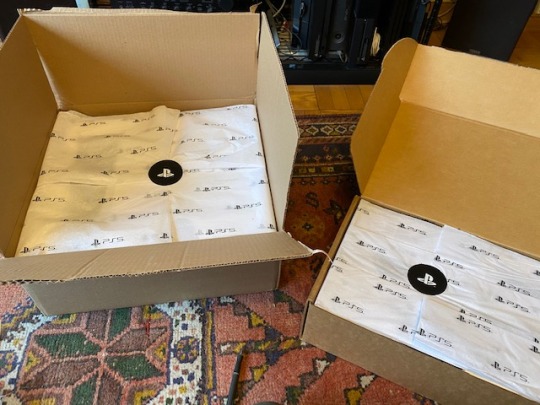
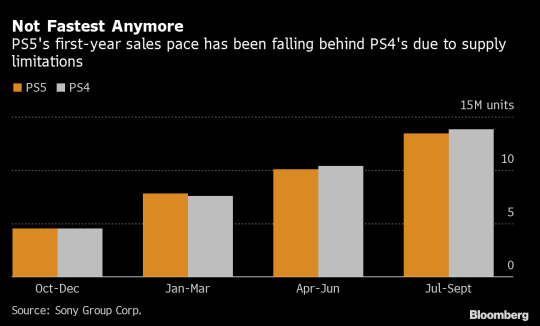
The PlayStation 5 came out on November 12, 2020, in the United States, Canada, Mexico, Australia, New Zealand, Japan, and South Korea and then on November 19, 2020 to the rest of the world. When the Playstation 5 first came out there was such a high demand due to its popularity and the shortage of available consoles that people who got their hands on one started selling them at absurd prices. With such a high demand, it created a shortened supply and to this day there is still a demand for them.
As a result of the high demand and limited supply, the PlayStation 5 has been difficult to obtain for many consumers, with some retailers selling out their entire stock within minutes of restocking. The PlayStation 5 is heavily pointed towards demand while the supply is struggling to keep up. When a product is in high demand and the supply cannot keep up with the demand, it can result in scarcity or stock shortages.
Even though the PlayStation 5 is in high demand, there were still a number of issues that were going on at the time. Some issues were supply chain issues like manufacturing and shipping delays due to the COVID-19 pandemic. The pandemic resulted in shortages in many regions.
The high demand for the PlayStation 5 has led to a shortage in supply, which made people frustrated who were looking forward to getting the console. It was important when the PlayStation came out because it showed companies how important it is to have the right supply for certain products that are in demand. Now Sony believes that they have the right tools to ensure that their consoles won’t be sold out in minutes and that it would be available to everyone.
Works cited
Magill, Kate. “Sony Forecasts PS5 Supply Won't Meet Demand.” Supply Chain Dive, 26 May 2022, https://www.supplychaindive.com/news/Sony-forecasts-inventory-shortfall-amid-supply-constraints-in-Shanghai/624422/.
Orland, Kyle. “Sony Expects PS5 Will Still Be in Short Supply until 2023.” Ars Technica, 10 May 2022, https://arstechnica.com/gaming/2022/05/sony-expects-ps5-will-still-be-in-short-supply-until-2023/.
Holt, Kris. “Sony Says Getting a PS5 Should Be Much Easier Now.” Forbes, Forbes Magazine, 6 Jan. 2023, https://www.forbes.com/sites/krisholt/2023/01/04/sony-says-getting-a-ps5-should-be-much-easier-now/?sh=3dcb732729d0.
0 notes
Text
0 notes
Text
The Pandemic Impact on the Global Economy & Our Daily Lives
Catherine Valle Meraz
Student ID #: 67786651
Discussion: Thursday @ 8PM

The pandemic has had a significant impact on the global economy and our daily lives, making it an ideal topic to explore various economic concepts. Here are some concepts to explore:
Preferences and Rationality
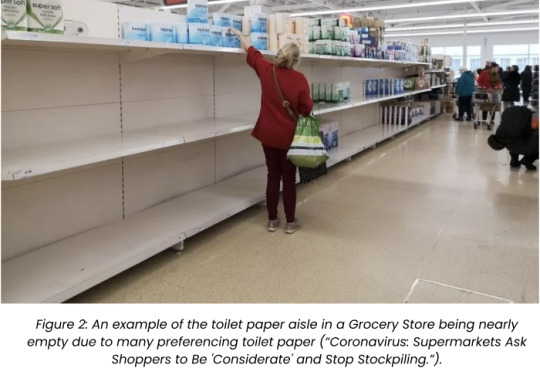
The COVID-19 pandemic has dramatically affected consumer preferences and rationality in the US economy. With lockdowns, social distancing measures, and financial uncertainty, consumers' needs and wants have shifted. According to recent research, many consumers have become more cautious in their spending and have developed a preference for essential goods, such as food, cleaning products, and personal protective equipment (Crosta et al.). During the pandemic, we have had to make difficult choices about how we spend our money and time.
I will be demonstrating how people's preferences and rationality have been affected by the pandemic, and how they have made decisions about consumption and leisure activities with a personal example.

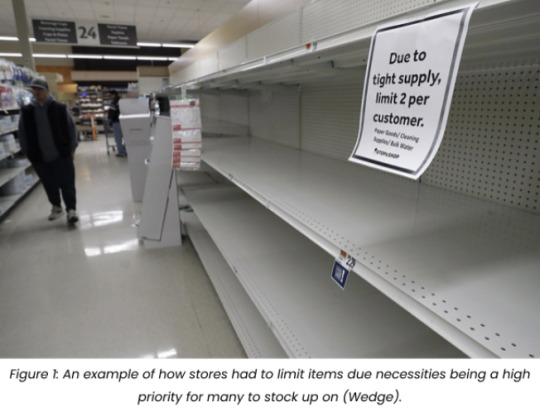
At the beginning of the pandemic in March of 2020 there was a lot of fear and misinformation circulating quickly due to the rise of Social Media. At that moment in time I lived with an immunocompromised grandmother and siblings. So as all that news spread about the pandemic many went to panic. After hearing the news, my family was worried that we would be left with nothing if we didn't panic buy as well. We prioritized disinfecting supplies instead of regular cleaning supplies to ensure the safety of our immunocompromised family members. Along with non-perishable food instead of easily perishable food, water, and most importantly TOILET PAPER! Can’t survive without toilet paper, the public made it seem since it was everyone's favorite item to purchase during this time. Leading stores had to ration two per customer to ensure that there was enough for everyone.
In conclusion, the pandemic has led to significant shifts in consumer preferences, leading to changes in the economy. The preference for essential goods has affected some industries negatively, while other industries have experienced growth.
Market Efficiency and Supply & Demand
As a result of the shift in consumer preferences towards essential goods, many businesses in industries such as hospitality and travel have suffered significant losses. However, other industries, such as e-commerce and home delivery services, have seen a surge in demand, leading to job creation and growth in these sectors.

Explanation for Figure 3:
I am comparing the Demand of consumers that receive at home deliveries and the supply of Dashers. Many people including my family resorted to Doordashing in order to not leave the house during the Pandemic. Leading to an Increase in Demand.
Many people lost their jobs during the Pandemic and resorted to Doordashing to receive an income especially since it was a high demand during the pandemic. Leading to an Increase in DoorDashers.
The pandemic has also brought to light the value of social decision-making and teamwork in handling public health crises.
Details describing my Supply and Demand Curve. These description are originally provided by the article “How to Understand and Leverage Supply and Demand”, which I have changed to fit the descriptions of my graph:
The horizontal axis on the supply and demand diagram represents Quantity. The vertical axis represents Price.
The Supply Curve is plotted as a line with an upward slope, pointing up and to the right.The quantity of the good increases, the supply curve shifts right. If quantity decreases, the supply curve moves left.
The Demand Curve is plotted as a line with a negative slope, pointing down and to the right. If the quantity demanded increases, the downward-sloping demand curve moves right. If demand decreases, the curve moves left. (“How to Understand and Leverage Supply and Demand.”)
Opportunity Cost
Opportunity expenses for Americans have been significantly impacted by the COVID-19 pandemic. People have been compelled to weigh the risks of different activities against the benefits due to restrictions on travel, socializing, and employment. For instance, many employees have been forced to choose between remaining at home and running the risk of financial instability or going to work and possibly exposing themselves to the virus. As patients evaluate the advantages of seeking medical attention against the potential risks of being exposed to COVID-19, the pandemic has also had an impact on healthcare choices. The expense of lost productivity and lowered growth potential are just two examples of the economic effects of these choices that have been estimated through studies. Overall, the pandemic has made Americans reevaluate their priorities and carefully consider their choices.
In conclusion, the pandemic has provided an opportunity to explore various economic concepts and their application in our daily lives.
Work Cited
Crosta, Adolfo Di, et al. “Psychological Factors and Consumer Behavior during the COVID-19 Pandemic.” PLOS ONE, Public Library of Science, 16 Aug. 2021, https://journals.plos.org/plosone/article?id=10.1371%2Fjournal.pone.0256095.
Wedge, Dave. “Will Grocery Stores Start Running out of Food?” Boston Magazine, Metro Corporation , 30 Mar. 2020, https://www.bostonmagazine.com/news/2020/03/30/grocery-store-food-supply/.
“Coronavirus: Supermarkets Ask Shoppers to Be 'Considerate' and Stop Stockpiling.” BBC News, BBC, 15 Mar. 2020, https://www.bbc.com/news/business-51883440.
“How to Understand and Leverage Supply and Demand.” MiroBlog, 17 May 2022, https://miro.com/blog/supply-and-demand-diagram/#:~:text=If%20the%20available%20quantity%20of,sloping%20demand%20curve%20moves%20right. Hensley, Scott. "What Is Opportunity Cost? How COVID-19 Is Changing Our Idea Of Trade-Offs." NPR, 29 Apr. 2020, https://www.npr.org/sections/health-shots/2020/04/29/846586428/what-is-opportunity-cost-how-covid-19-is-changing-our-idea-of-trade-offs.

1 note
·
View note
Text
Community Discovery
Name: Chingchi Tao Student ID: 001095251
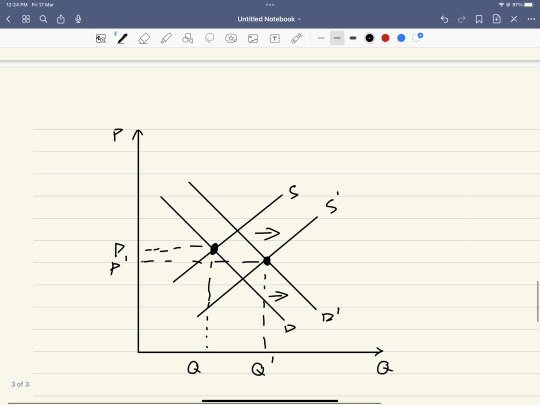
The first example around my life is the supermarket near my home, the supermarket prices are relatively average with other supermarkets, the price of most goods is normal, but the supermarket always has a part of the goods are sold at a discount, these goods are much cheaper than other supermarkets, and the more strange is that these goods are not because the shelf life of the goods to be discounted, but some of the more easy to save It is worth noting that these goods are sold at a much higher rate than the same goods sold in other supermarkets.
When we apply what we learned in economics class to this supermarket, it is easy to see that this is a very typical supply and demand relationship: there are many supermarkets in the city, but supermarkets and supermarkets are in competition with each other, if people want to buy something most people will choose the closest supermarket to their homes, so the audience of supermarkets is the people within a certain distance from the supermarket, if a supermarket If a supermarket wants to get more profit and take away customers from other supermarkets, then the supermarket must lower its price, according to the law of the demand, after the price of goods falls, people's demand will rise. This supermarket sold a lot of easy-to-preserve food at a discount, which brought consumers lower prices and higher demand. The supermarkets gained more customers through this method, and although the price of goods fell, the quantity of goods increased, and the demand and supply of goods in the supermarkets also increased, and the supermarkets made more profits in this way.
2
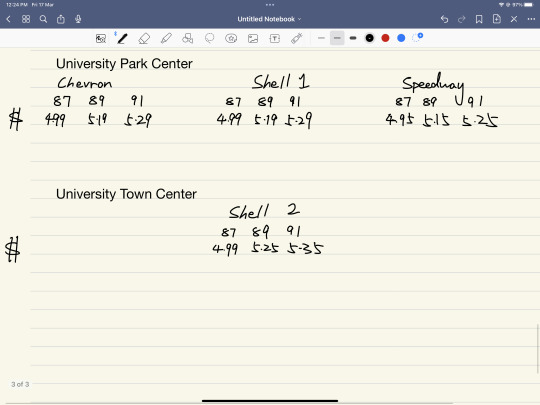
The second example is the example of gas stations in my community and school community. There are three gas stations in University Park Center and one gas station in University Town Center.
I would like to explore the relationship between these three gas stations. First, due to the special nature of oil, gas stations are Oligopoly.
From the UPC we can easily see that Chevron and Shell are part of a cooperative relationship, most of them are separated by a road, in order to check and balance each other, so that customers do not make too many choices, the prices of these two gas stations are the same. At first I was curious, if one of the gas stations put out a lower price, then the other gas station's profit will not be much lower and thus cannot make money, but since I learned the nash equilibrium I found the mystery, because they are both oligopoly, if one party to lower the price to fire the other party's profit, then the other party also Will lower the price to get profit, these two gas stations will be for profit has been each other to lower each other's prices, they both profits will be mutually reduced until there is no profit.
The special thing is that Speedway is also in the vicinity of these two gas stations, but its price will be relatively lower because its oil quality is a little lower than the other two gas stations, so its price will be cheaper, and the cheaper price will attract more customers.
When we turn the perspective to UTC, we can easily find that the second Shell's oil price is higher than the first Shell's. This is because there is only one gas station in this community, and the second Shell plays a monopoly role in this, a monopoly scene allows Shell to control the price of oil as it wishes.
0 notes
Text
Collusion - The Hidden Side of Sports
Connor Phipps (48258868)
Discussion: Thursday 8pm
The term "collusion" refers to covert collaboration between two or more people or groups for a wrongous or criminal goal. Business, politics, and sports are just a few of the settings where collusion can happen. Collusion can have detrimental effects on customers, the economy, and society, despite the fact that it is frequently difficult to detect.
Collusion can also happen in sports, for instance when team owners work together to set salary caps or restrict player mobility. This kind of collaboration can be detrimental to both the participants and the spectators who pay to see them compete. In politics, collusion can happen when people or organizations work together covertly to influence elections or gain an unfair advantage.
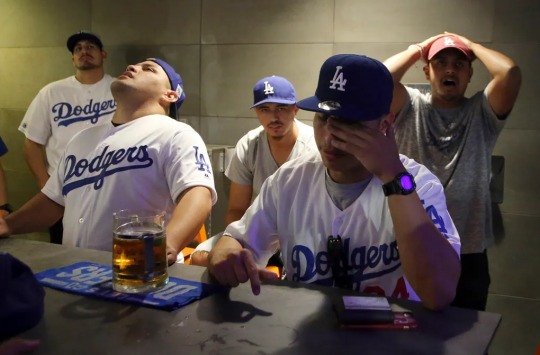
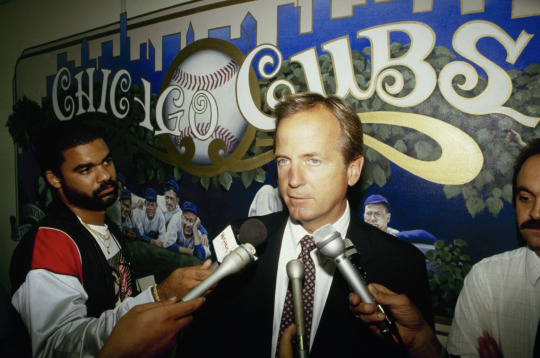
As a frequent viewer of Major League Baseball, I have always admired the sport for its spirit of competition and the sense of fandom it produces. But I've been upset and disillusioned about the league's collusion issue. In addition to harming the players who are not fairly compensated for their skills, this also distorts the playing field and jeopardizes the integrity of the game. As a fan, I like to think that players' skill and effort on the field, not management's plotting behind the scenes, dictate the results of games. My faith in the sport's fairness is destroyed by collusion, and it is tougher for me to love it as much as I once did.
In the late 1990s and early 2000s, Major League Baseball (MLB) saw certain instances of collusion. Several organizations were charged with conspiring to reduce player pay at the time by deciding not to sign lucrative contracts with free agents.
An MLB player made an average of $1.07 million in 1995. It had barely climbed to $2.38 million by 2001. This was in spite of the fact that the league's earnings during that time period went from $1.9 billion in 1995 to $3.5 billion in 2001, a huge rise.
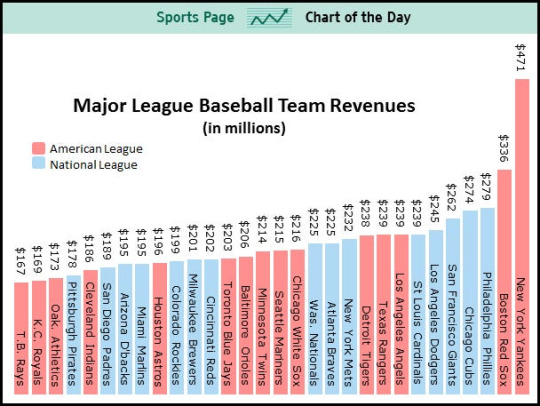
Figure 1: Team Revenues all in the millions

Figure 2: Player Revenues huge difference between team and player revenues

The MLB Players' Union filed a grievance against the league in 1998, alleging collusion amongst team owners. The union charged that teams were working together to avoid competing with one another for free-agent players, which was driving down wages. The dispute was arbitrated, and in 2000, the players were given $280 million in damages when the arbitrator found in favor of the players' union.
This collusion had significant results. Several gifted athletes failed to secure the contracts they merited, and some were forced to retire early or accept pay below what was fair. Teams with smaller payrolls were at a disadvantage relative to those with greater payrolls, which had an effect on the competitive balance of the league.
Overall, this example shows the real-world consequences of collusion in sports, including its impact on player salaries and the overall competitive balance of a league. It also highlights the importance of holding organizations accountable for engaging in collusion and ensuring that players are able to earn fair compensation for their skills and contributions to the sport.
Works cited
“MLB Collusion, Explained.” Google, Google, https://www.google.com/amp/s/www.sbnation.com/platform/amp/mlb/2018/1/18/16882650/mlb-collusion-offseason-free-agency-explainer.
“Baseball Strike in 1994-95 Began 25 Years Ago - MLB | NBC Sports.” Google, Google, https://www.google.com/amp/s/mlb.nbcsports.com/2019/08/12/baseball-strike-in-1994-95-began-25-years-ago/amp/.
Jablon, Robert. “LA Dodger Fans Face Heartbreaking Ending to Magical Year.” The Seattle Times, 1 Nov. 2017, www.seattletimes.com/news/la-baseball-fans-prepare-for-a-once-in-a-lifetime-moment.
Gaines, Cork. “CHART: MLB Salaries Had Largest Increase in 7 Years and This Is Just the Start.” Business Insider, 19 Dec. 2013, www.businessinsider.com/chart-mlb-salaries-had-largest-increase-in-7-years-and-this-is-just-the-start-2013-12.
---. “MLB Team Revenues Show the True Disparity Between the Haves and Have Nots.” Business Insider, 28 Mar. 2013, www.businessinsider.com/team-revenues-show-the-true-disparity-in-major-league-baseball-sports-chart-of-the-day-2013-3.
"Baseball Collusion: It's a Case of Suing the Bosses," by John Feinstein, The Washington Post, published on November 1, 1987.
"Collusion Case Splits Baseball Owners and Players," by Ross Newhan, The Los Angeles Times, published on January 14, 1990.
"Collusion Was the Dark Secret Behind Baseball's Free-Agent Chill," by Murray Chass, The New York Times, published on October 28, 1990.
Baseball Collusion: It's a Case of Suing the Bosses," by John Feinstein, The Washington Post, published on November 1, 1987.
3 notes
·
View notes
Text
0 notes
Text
The Effect of the Pandemic on Hand Sanitizer Demand and Supply
Group (in alphabetical order):
Kiana Lynn Burnett (64165073)
Nicholas Evangelos Georggin (74892012)
Cherry Dang Khuc (74908795)
Shannon Simone Thompson (79858235)
Introduction:
When the COVID-19 pandemic began, many people across the world sprawled into a panic. Staying clean and sanitary became a necessity. Due to many CDC regulations and suggestions, one of the best ways to stay sanitary in keeping away from the virus was by washing one’s hands for at least 20 seconds. However, a sink with running water and a bar of soap was not always accessible for many. The main solution to cleaning one’s hands in a quick and efficient manner was through the use of hand sanitizer (“Handwashing in Communities”). According to the CDC, it was recommended that consumers should use an alcohol-based hand sanitizer that contains at least 60% alcohol by volume. At the beginning of the pandemic, the demand for hand sanitizer had increased dramatically, almost becoming necessary for many people to go about their daily lives (“Handwashing in Communities”). According to United States Pharmacopeia, the demand for alcohol-based hand sanitizers had surpassed its normal demand-supply equilibrium amount and thus created a shortage of traditional hand sanitizer. The consumer demand for hand sanitizer increased drastically and created a smaller supply of hand sanitizer as a result (“Hand Sanitizer Toolkit”). We will analyze several aspects of this shift in the hand sanitizer market as caused by the COVID-19 Pandemic.

Picture from (“Hand Sanitizer Toolkit”).
The Increase of Hand Sanitizer:
Forbes Business Insights reports that COVID-19 has brought along “a rapid demand in hand sanitizers across [the world]” (“Impact of COVID-19”). With the large increase in the demand for hand sanitizer, there existed a subsequent increase in price as illustrated in the graphic below.

Figure A. Hand Sanitizer Equilibrium (Considering Changed Demand).
With an increase in demand, the blue D-curve in the graph above will move toward a greater quantity demanded (i.e. further in the positive direction along the Q-axis). This causes the new demand D’-curve to indicate an equilibrium of a higher price and higher quantity demanded. This means that, due to greater demand, the price will have to be higher in order to compensate for the greater quantity demanded.
While the demand for hand sanitizer increased in this manner and the equilibrium point was shifted, less hand sanitizer became available in order to attain this new equilibrium. CNBC reports that several firms around the world set rations on the quantity of hand sanitizer that could be bought. This means that people were required to buy a lesser amount of the product in question for a higher price than what it was initially (Taylor). Because of this, the supply of hand sanitizer as represented on the graph is shifted in the direction of a lesser quantity of hand sanitizer (i.e. further in the negative direction along the Q-axis).
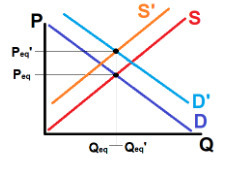
Figure B. Hand Sanitizer Equilibrium (Considering Both Changed Supply and Demand).
With the supply decrease as mentioned above, the red D-curve in the graph above will move in the negative-Q direction to produce the orange S’-curve. This shift causes a subsequent shift in the point of equilibrium. Because of considerations made with respect to both demand and supply as explained above, the equilibrium price of hand sanitizer is much greater than what it was initially. Also, since there was a shift in equilibrium in both the positive and negative directions, the change in equilibrium quantity is depicted here as negligible. In the end, this means that consumers would be required to pay more during the pandemic to enjoy the same quantity of hand sanitizer that they used to buy at a lower price before the pandemic.

Picture from (Han)
Price Gougers:
The COVID-19 pandemic caused panic as people around the world feared that they would indeed catch the illness if they were not careful. Hand sanitizer was a way for people to protect themselves against the virus and to continue in this very effort. However, the increased demand and diminishing supply of hand sanitizer were caused by this sense of panic, and as such, local stores sold out of hand sanitizer quite often during this time. The New York Times reported that “Shoppers had already picked the shelves clean of recognizable brands like Purell, Germ-X, and even local drugstore formulations” (Han). The article further states that people tried to remedy this by taking to the internet to shop for other more readily available hand sanitizers to be delivered to their homes. This led to online parties selling their own small and relatively unknown hand sanitizer brands for upwards of $100: much more than the initial equilibrium price of hand sanitizer (Han).
These actions perpetrated by price gougers were charging above the now-increased competitive market equilibrium price in order to increase their revenue and, by extension, their own profit. Total revenue is defined as the total quantity produced multiplied by the price of the product, while profit is defined as the revenue minus the cost. Assuming that it costs the same amount to produce a bottle of hand sanitizer across all firms in a market, then selling the hand sanitizer at a higher price will lead to higher revenue and higher profit as illustrated below.
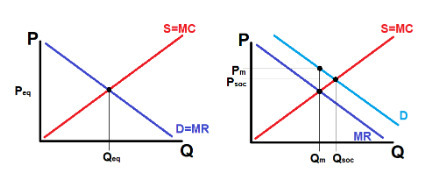
Figures C and D. Competitive Market Graphic (P=MC=MR; competitive in structure) and “Price Gouger” Market Graphic (P > MC=MR; monopolistic in structure).
(Revenue of the price gougers is above market cost since a competitive market P=MC=MR)
No Name Brands:
Meanwhile, a number of new brand names came into the hand sanitizer market. Because there was a rationing of hand sanitizer as described earlier, these brands manufactured hand sanitizers using denatured ethanol; the result is a hand sanitizer with a very pungent smell that is not pleasant to use (Han). These two different products – alcohol-based hand sanitizer (Mahmood, et al.) and ethanol-based hand sanitizer (Han) – act as substitute goods. When the available supply of one of these products is down, then the price for that product increases. Since there was too much demand for alcohol-based sanitizers and not enough supply to fulfill that demand, the relationship between substitute goods dictates there would be an increase in the demand for ethanol-based sanitizers to compensate.
Personal Testimonials (How this affected us):
Kiana: With the increase in hand sanitizer demand from the general public, it made it harder to stay sanitary on the go. In my personal experience, I would oftentimes have to save and share the bottles we had with my family just to make sure we didn’t run out. Once other brand names started to make more with substitute ingredients, it became much easier to make sure I stayed healthy. I will be honest tho, the alcohol-based sanitizer that UCI uses which has denatured ethanol in it does not smell too nice. There was a period of time when I would actively have to carry my own hand sanitizer in my bag just so I did not have to use the ones UCI provided.
Nicholas: When the pandemic started, I was very scared about how I could keep myself well and protect against the virus. Even before the pandemic, I was very careful to wash my hands frequently as a common method of keeping clean. Once the pandemic started, however, I felt obligated to look for other easier or more accessible methods to keep clean. I frequently used a small single-person hand sanitizer that could be carried around in a bag or in a car, yet it was not lost on me how several people around the nation and the world were struggling to find enough hand sanitizers for their own uses. In response to this, I needed to ensure that I was wisely using whatever hand sanitizer I could. I carefully used my own single-person bottle while also using whatever sanitizers were available at school or at other places of business that I visit. Of course, I was still quite scared as I, along with many other people, could not buy as much hand sanitizer as we would have preferred, especially under these COVID-based circumstances. When doing the research for this project and upon discovering the extent to which the market had shifted and price gougers were operating, I was astonished. I found it incredible how there were firms that could take advantage of one of the greatest public health emergencies of our day and charge upwards of $100 for hand sanitizer. We always talk about the characteristics of the market or of a product in this class but seldom do we talk about how the people themselves are personally affected. I suppose that this was an intriguing experience to discover this new dimension of the field of economics; this project has allowed us to learn something new outside of the classroom.
Cherry: The pandemic caused an increasing demand for hand sanitizers and there was not a large enough supply to meet the demand. Thus, many sellers popped up with hand sanitizers made from denatured ethanol. This hand sanitizer does not smell pleasant. I remember my first time out at Irvine Spectrum after the lockdown was lifted. I walked passed a dispenser and put my hand out for some hand sanitizer. I was met with a pungent smell which caused me to run to the restroom to wash my hands with soap and water. I later hopped online to find out that many hand sanitizers smell like vinegar or tequila due to the substitute ingredients used. When my mom saw GermX in stock at Sams Club, we stocked up on 5 big bottles that have still lasted us until now.
Shannon: During the pandemic, my family and I shared a concern to make sure we were all well protected from germs as we could be. This meant bringing a bottle of hand sanitizer along with us no matter where we went. At the beginning of the pandemic, we would find ourselves having to go to third-party stores in order to find hand sanitizer because oftentimes it would be sold out anywhere else. Once other brands started making their own hand sanitizer with different ingredients, we no longer had to go to third-party stores like we once had to. Though at times I would notice that the new brands of hand sanitizers would leave my hands feeling a bit sticky along with an off-putting smell, it resulted in us being able to stay protected against the virus by having something quick and easy on the go to prevent the spread of illnesses.
Works Cited:
Han, Gregory. “Why Do Hand Sanitizers Suddenly Smell So Awful?” The New York Times, 07 July 2020, https://www.nytimes.com/wirecutter/blog/why-hand-sanitizers-smell/.
“Hand Sanitizer Toolkit.” United States Pharmacopeia, 10 March 2022, https://www.usp.org/covid-19/hand-sanitizer-information.
“Handwashing in Communities: Clean Hands Save Lives.” Centers for Disease Control and Prevention, 30 September 2022, https://www.cdc.gov/handwashing/.
“Impact of COVID-19 on Hand Sanitizer Market Size, Share, Industry Analysis and Regional Forecast, 2019-2026.” Forbes Business Insights, https://www.fortunebusinessinsights.com/impact-of-covid-19-on-hand-sanitizer-market-102719.
Mahmood, Adeel, et al. “COVID-19 and frequent use of hand sanitizers; human health and environmental hazards by exposure pathways.” National Library of Medicine, 10 November 2020, https://www.ncbi.nlm.nih.gov/pmc/articles/PMC7320712/.
Taylor, Chloe. “Sales of hand sanitizer are skyrocketing due to the coronavirus, leading to rationing and price hikes.” CNBC, 04 March 2020,
https://www.cnbc.com/2020/03/03/coronavirus-hand-sanitizer-sales-surge-leading-to-price-hikes.html.
0 notes
Text
Kevin Yu - 91652909
Wenqi Song - 19097398
America Garcia - 52606257
Edward Kim - 40798622
On March 11, 2020, the World Health Organization declared Covid-19 a global pandemic. This set a domino effect for all industries, people, and places around the world. In the U.S., businesses and schools quickly pivoted to distanced and online formats, people were forced to stay at home, and we experienced the quickest recession in the history of this country. One industry, however, was hit harder than most: the airline industry.
With all the shutdowns and travel bans around the world, aviation seemingly hit rock bottom overnight. Airlines’ main service for customers is flights, so without being able to fly even at a fraction of the capacity that they previously could, their main source of revenue was essentially eliminated. This impact on the airline industry was not merely felt here in the United States, but around the world, in some cases even more so. Take a look at the graphic below and one can understand the type of impact that was felt.
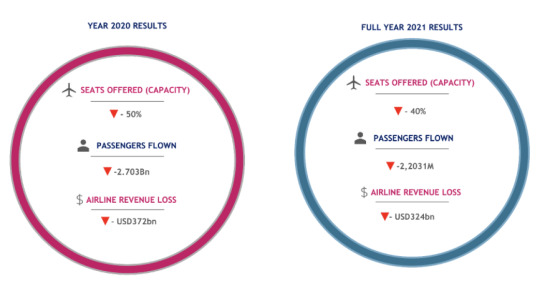
This impact hit the smallest of airlines the hardest. The biggest airlines in the world—think United or Delta—were able to survive the pandemic by using their fleets to fly cargo, charter, and repatriation flights. Unfortunately, many smaller airlines were unable to do so, and as of February 11, 2023, 64 airlines have gone bankrupt during the pandemic.
Although the airline industry is poised to bounce back and the future is looking brighter, it is a fact that the Covid-19 pandemic has changed civil aviation forever. In this blog, we are going to examine the impact of Covid-19 and subsequent events and policies on the airline industry during the peak of Covid-19 in 2020 and 2021 by examining the busiest trans-Atlantic route in the world: London (LHR) - New York (JFK).
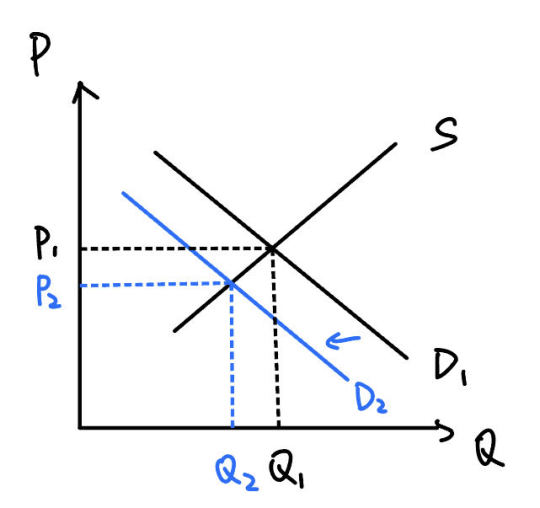
Based on the graph above, there is a shift to the left for demand as the amount of interest in purchasing airplane tickets would decrease due to the restrictions involved from government during the incidents of the CoronaVirus. Due to this shift, in order to offset the changes, the quantity amounts needed for people to purchase need to be increased resulting in the prices for airplane tickets to decrease as some of the reasoning to why people would not want to purchase the tickets could be factors of self-quarantine/isolation for a 14 day period before being lifted as well as fear for the virus spread. Decreasing the price in turn would result in some people being interested or affect people in deciding whether or not to purchase.

Within this graph, we could see that the blue box would represent the consumer surplus meaning that is the price the consumer would pay based on the difference between the maximum customers are willing to pay to the equilibrium market price. In this case, the consumer surplus would be a small amount due to the fact of Coronavirus resulting in fewer people being interested in purchasing the tickets as well as the amount of worth provided on a quarantine isolation requirement. Whereas the producer surplus is the difference between the highest amount a consumer is content to pay for the product with the product market price. Similar to the factors seen in the consumer surplus, the producer surplus would also be at a smaller space as the effects of the Coronavirus results in people being less likely to find high amounts of worth for their product being the airplane tickets during a time of crisis and fear.
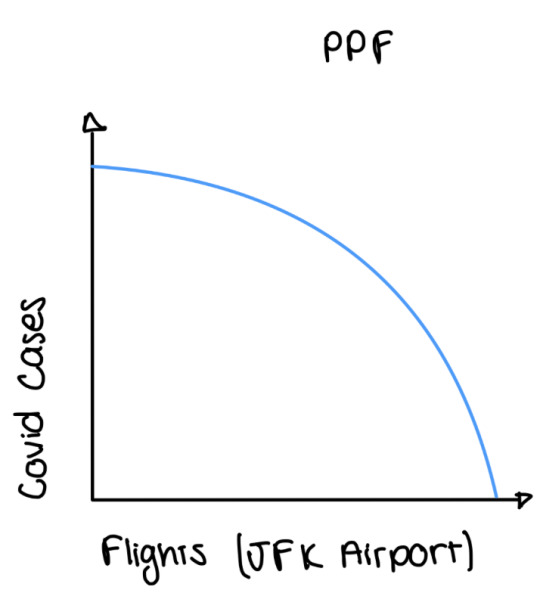
The graph would show an increasing opportunity cost due to how the amount of flights traveling within the JFK airport results in an increased value for the amount of Covid cases found. As airplane travels were to increase, the spread of the Corona virus would increase at an exponential rate, whereas with less cases of Coronavirus involving air travel would be at a small rate based on the amount of passengers willing to travel. As there has been a connection between the rates for Covid cases and airplane flights found within the JFK airport, Covid cases increase based on the more flights held within the JFK airport. With less space in the airplane and even fewer flights held, the amount of Coronavirus cases would decrease by a bit compared if there were more flights held.
Overall, this example was quite relevant to our daily lives during the peak of the pandemic. During the summer of 2020, our group member, Kevin, had made plans to travel to Europe. One of us specifically had already booked flights at the end of 2019 and was planning a nice trip. Unfortunately, after the pandemic hit, he requested a refund. Luckily, he had travel insurance so he was able to get his money back. Regardless if the government stepped in, he would not have gone on the trip as he originally planned because of fear and concern that was caused by Covid-19. Like him, millions around the world canceled their travel plans because of this concern. This indicates a clear decrease in the market demand for flights, and this greatly shook the airline industry. Only time will tell when the industry will stabilize.
0 notes
Text
Name: Ruben Munante-Navarro
44291496
OfferUp
Recently, my parents moved to a new city in Los Angeles County and as they were packing up they came across my old electronics in storage that I used during my high school years. Instead of throwing them away they asked me if I wanted them. I had an old amplifier and an outdated tablet. At first I debated whether to throw them out or not because they were junk but then I thought to myself “people always buy junk online”. So I put them up for sale on OfferUp.
Determining Price
To determine the price of the electronics, I researched how much people were demanding for the tablet and amplifier on other reselling sites. To my surprise people were asking on average about $100 for the amplifier and $30 for the tablet, so I set prices to the average of ten different listings I found on facebook marketplace and sold it as a bundle.
Explicit Costs
My parents had gifted them to me when I was younger so I assumed that all my gains would be profit. However, I forgot to account for the price of the 70 mile round trip I needed to take to LA county in order to pick up the electronics. At the time gas was up $5.38 at my nearest ARCO gas station and my Honda Accord has a combined MPG of 25 miles/gallon. After making some calculations, my explicit costs cae out to $15.06.
Implicit Costs
Since I live in Irvine, the trip would take me 1 hour and 45 minutes. I also assumed it would take another 2 hours to chit chat with my parents and catch up with them. It was week 5 in the school quarter, midterms were 3 days away and I was behind on 2 of my classes. To efficiently understand the course material I knew it would take me a total of 7 hours to catch up with these classes. On top of that, I had to study for my 6 unit anatomy course. When I came back from picking up my amplifier and tablet, the trip had amounted to a total of 4 hours. I was just accepted into USC's dental program and according to my contingent acceptance I need at least C’s in all my courses, so I value my study time highly, I decided that each study hour should equate above the minimum wage. As a student my hourly wage in the labor market would offer me $15 and since I am on track to the dental field I felt that it was justified to value my study time at $20 because that is what dental assistants are being paid. Since I am in between a current student and a future dentist I wanted to compare my study time to a medical professional with vocational training in the dental field. So my opportunity cost would be $80 because I decided to pick them up. After the calculations my possible profit would be after I included the implicit costs.
I had no place to store these things so I placed them on top of my already crammed desk. I contemplated storing them in the trunk of my car but I did not want unnecessary damage or excess heat damage to the internals of these outdated electronics. My decision came at the sacrifice of my comfort as I studied at my desk.
Possible Profit
The 70 mile round trip took a total of 4 hour and the gas to get there came out to a total of $95.06 in costs. After including opportunity costs and explicit costs my possible profit came out to $35.
Offers
Initially I didn’t know that the market was not offering even close to my price point, but after 4 weeks of sacrificing my comfort when I studied, I felt that it was justified to sell them both for a total of $90. My actual profit unfortunately equated to -$5.
Producer Surplus
I noticed that I was above the efficiency equilibrium because the market did not demand these prices. If I realized this before I would have not bothered to sell them.
0 notes
Link
0 notes
Text
The impact of pandemic on the the masks.
Name: Jiahao Chen
ID:61983564
Thursday. 8.p.m.discussion
During the pandemic period, the mask become a necessity. People need to buy and use it everyday. At the beginning of the pandemic, the price of mask even up to almost 0.5 dollar per mask. When the pandemic appears, people’s demand to the masks increases. So as the demand increase, the company would like to supply more masks at a higher price and the demand curve will shift to the right. From another perspective, the reason that the price will change a lot is the productivity of the company. In the short run, the company can’t set more factories to produce the masks and the marginal cost will increase as they produce more masks. However, in the long run, they can set more factories and produce the masks at low price. In case, the price of masks will not be higher too much.
0 notes
Text
Airfare During Holidays and Breaks
Name: Olivia Urbano
94688356
Finding flights home–whether it is a domestic or an international flight–can be costly. Thinking about the dates you are going to be flying requires planning ahead of time, especially during the holidays. Students at UC Irvine who live out of state and want to go home have to think about the price of tickets during the time they want to fly.
While I was looking at flights during spring break, a time when many other students want to go home, like many holidays, I expected an increase in price. A ticket from John Wayne to Detroit during a less busy and less demanding time may range from $600 to $800. However, the price of a ticket on the last day of finals, where the demand rises, the price skyrockets to $1600, more than doubling the price.
March 18-25 (high demand - Spring Break)

April 15-22 (low demand)

There is a huge increase in the demand for tickets, but no change in supply because the number of seats on this specific plane does not increase. In this case, the population of buyers, or those who wanted to fly, increased, causing the shift in demand.
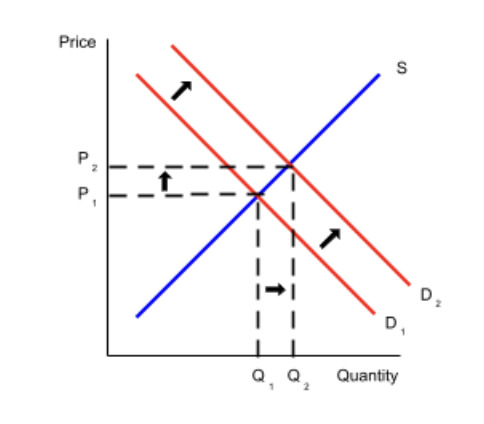
No matter what happens to the price, people will continue to buy tickets–whether it is a necessity for a job or wanting to visit family across the country. Since the demand increases and the supply remains unchanged, the equilibrium price and quantity increases as well. Despite the dramatic increase in flight prices, the demand for them has not dropped (aside from times during Covid in 2020), which means airline tickets are considered a relatively inelastic good.
0 notes
Text
Opportunity Cost at Work in my Life during College and Forward
Name: Ho Yoon
ID: 72905700
Spending my final year at UCI and studying Econ20A, there was one concept above all other cool and interesting concepts that I have learned during this quarter that put me to ponder every night: Opportunity Cost. Opportunity cost, by definition, represent the potential benefits someone could miss by choosing to do one thing over another. So, in the big picture, I first thought about attending UCI in the first place. The 4 years that I commit to college education, was it worth the opportunity cost? To answer this question, I had to imagine what else I could have done during the 4 years alternatively.
First of all, I could have worked during those 4 years, making money instead of spending them on college education. So, by attending college, the opportunity cost for me was all of the money that I would have made during the 4 years plus the amount of money I spent on college education. This was huge when I thought about it. So, did I pick the wrong opportunity cost?
Next, I had to think about what could come about in my future by attending college for 4 years and pay the associated opportunity cost. By completing Bachelor's degree, I would be able to attend graduate school, which require 4 years of college work to be accepted. And by completing graduate school, I would have access to job that I could only dream of having. This, consequently, would result in higher salaries earned for the duration of my leftover lifetime which far exceeds the 4~8 years of opportunity costs that I had to sacrifice.
Finally, what if I had not attended college and worked for 4 years? I would have made 4 years worth of savings and I would have saved the tuition money as well. By choosing to work instead of attending college, I would have accumulated 4 years worth amount of salaries at the opportunity cost
of future and dreams.
While opportunity cost is often associated with money and financial situation, it is not strictly limited to financial opportunity. Rather, it shows the degree of plus and minus aspect of the consequences due to the choices that we make. After comparing the opportunity costs of both of the possible routes that I could have taken in the past 4 years, I came to conclusion that the opportunity cost was far less than if I would have just worked for the past 4 years. The aspect of achieving dream far outweighs the mere amount of cash I would have accumulated during that time. Furthermore, utilizing the similar concept, I have decided to choose to take the opportunity cost of the next 4 years to attend the graduate school to complete my academic journey to reach the end of my dream. I think this, if not anything else, perfectly demonstrates the concept of opportunity cost at work in my very own life. And for the rest of my life, I will be using this concept to make decisions on how I would be spending my allotted time in my life, constantly thinking about which opportunity cost to take moving forward for the best.
0 notes
Text
The Effect of a Game Update on a Market
Name: Alexander Rex Ma
ID: 89372982
In this past month, I picked up an MMORPG newly released to the Western audience: Lost Ark. As with most MMORPGs, the game features a market and auction house system with an economy defined by the behaviors of its player base; in essence, a microcosm of a real-world economy. Last week, there was an announcement of a new update with the potential to increase the chances of enhancement rates for the games' current endgame content. This would allow for more players to access the content at a faster pace. This announcement rippled throughout the community and two major strategies emerging: buy out materials from the marketplace for upgrading gear now before rates were lowered and everyone was trying to upgrade their gear OR sell your own materials to accrue gold and purchase materials as soon as the update dropped to upgrade your gear with higher chances. In economics, the update announcement was essentially a shift on demand and supply on the market. However, because the enhancement rate increases were not guaranteed, I personally decided to risk purchasing materials before the update and upgrade my gear before I believed prices would skyrocket. The following is what I believed would be the graph of the market following the update:

A rightwards shift in demand caused by players wanting to upgrade their gear with higher enhancement rates and a leftwards shift in supply as materials are bought out. This would cause an increase in equilibrium price. However, when the update was released, two major effects happened:
1. Prices did not skyrocket as I believed them to
2. Enhancement rates were NOT increased
As of writing this post, these are the current prices of upgrade materials in the market compared to their average day prices:

The important materials such as Guardian/Destruction Stone Crystals and Honor Leapstones were either lower than their average day prices or barely above their average day prices. What I failed to consider was the influx of players entering this portion of the games' content and the inelasticity of upgrade materials that would affect the marketplace In reality, what the graph of the in games' market economy was like this:
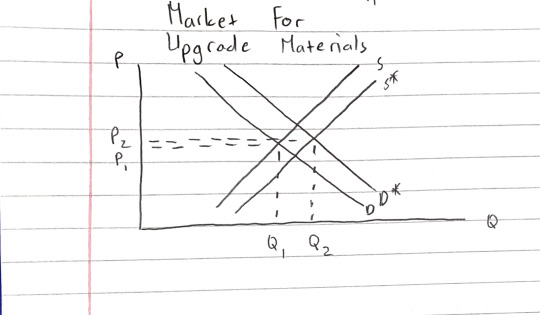
Because more players are entering this portion of the games' content, there will be an increase in supply of upgrade materials in the marketplace. However, because upgrade materials are an inelastic good that will always be demanded by players REGARDLESS OF ENHANCEMENT RATES, the demand for them did not drastically increase before or after the update. As such, the average price for upgrade materials increased slightly whereas quantity demanded greatly increased. Overall, whether a player decided to purchase or sell materials before or after the update, the result of a player's enhancement experience would be the same: keep on trying until your gear upgraded while suffering at the hands of bad RNG.
0 notes
Text
Impact on BTS Concert Ticket Prices
Jessica Martinez
ID: 54181705
Thursdays 8pm, TA Karan Talathi

BTS is a worldwide famous South Korean Pop Group made up of seven members. This globally successful group announced that they were going to hold their concert, Permission To Dance on Stage, in Los Angeles in late November to early December of 2021.
Fans were extremely excited and a bit surprised to hear this news. Why? Because the COVID-19 Pandemic was still present, so public health protocols called to lower maximum capacities for any public event. BTS’s last concert in 2020, the “Map Of The Soul Tour,” was also canceled due to COVID-19 safety protocols.
The Demand for PTD on Stage tickets was incredibly high. Fans who had their tickets canceled in 2020 have been eagerly waiting a whole year for a second chance to see their favorite artist. However, now more fans were grouped into the mix as BTS gained even more recognition across the globe. After a long break of concerts, there were more fans willing to cross state borders and even some extremely dedicated fans who jumped from other countries.
If we were to look at this from an economic perspective, the Demand Curve would shift to the right because there was a high number of consumers and high expectations for this tour.
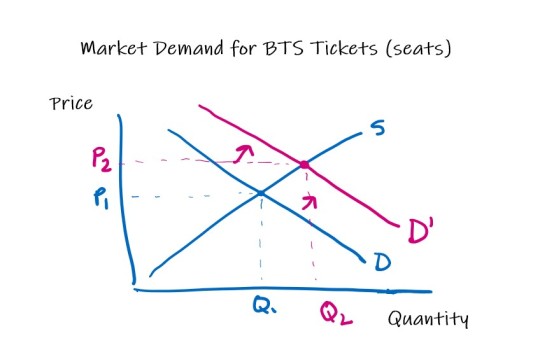
However, this was not the only shift in the market. Due to the COVID-19 Pandemic, seat availability decreased. Although the SOFI Stadium venue could hold a maximum capacity of 100,000 people, this number was significantly lowered to be compliant with pandemic safety protocols.
In the economic sense, this would be shown in a shift of the Supply Curve to the left. There are not as many tickets or seats available to the public since they have to limit their max capacity.
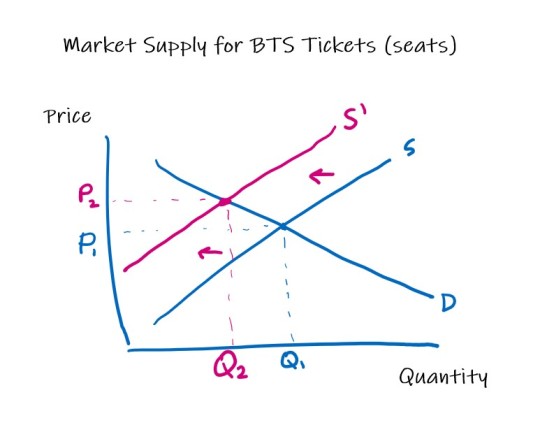
Since these two shifts are happening at the same time for the market of BTS tickets/seats, the combination of these two shifts would be as described. As Demand increases, both price and quantity also increase. However, the seller has to abide by laws and decrease supply in tickets/seats. As a result, quantity decreases but prices increase. After both market shifts, the end result would be the higher prices for the same quantity of tickets/seats.
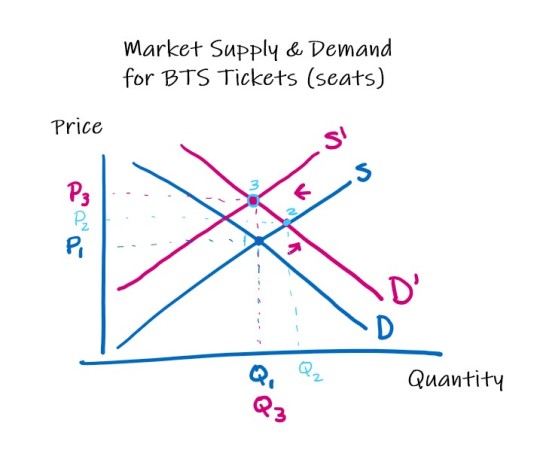
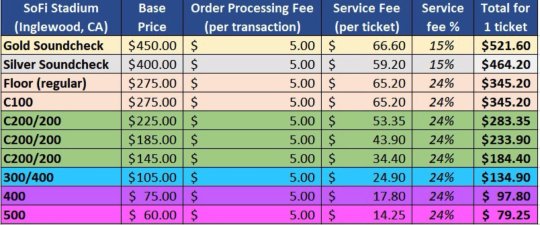
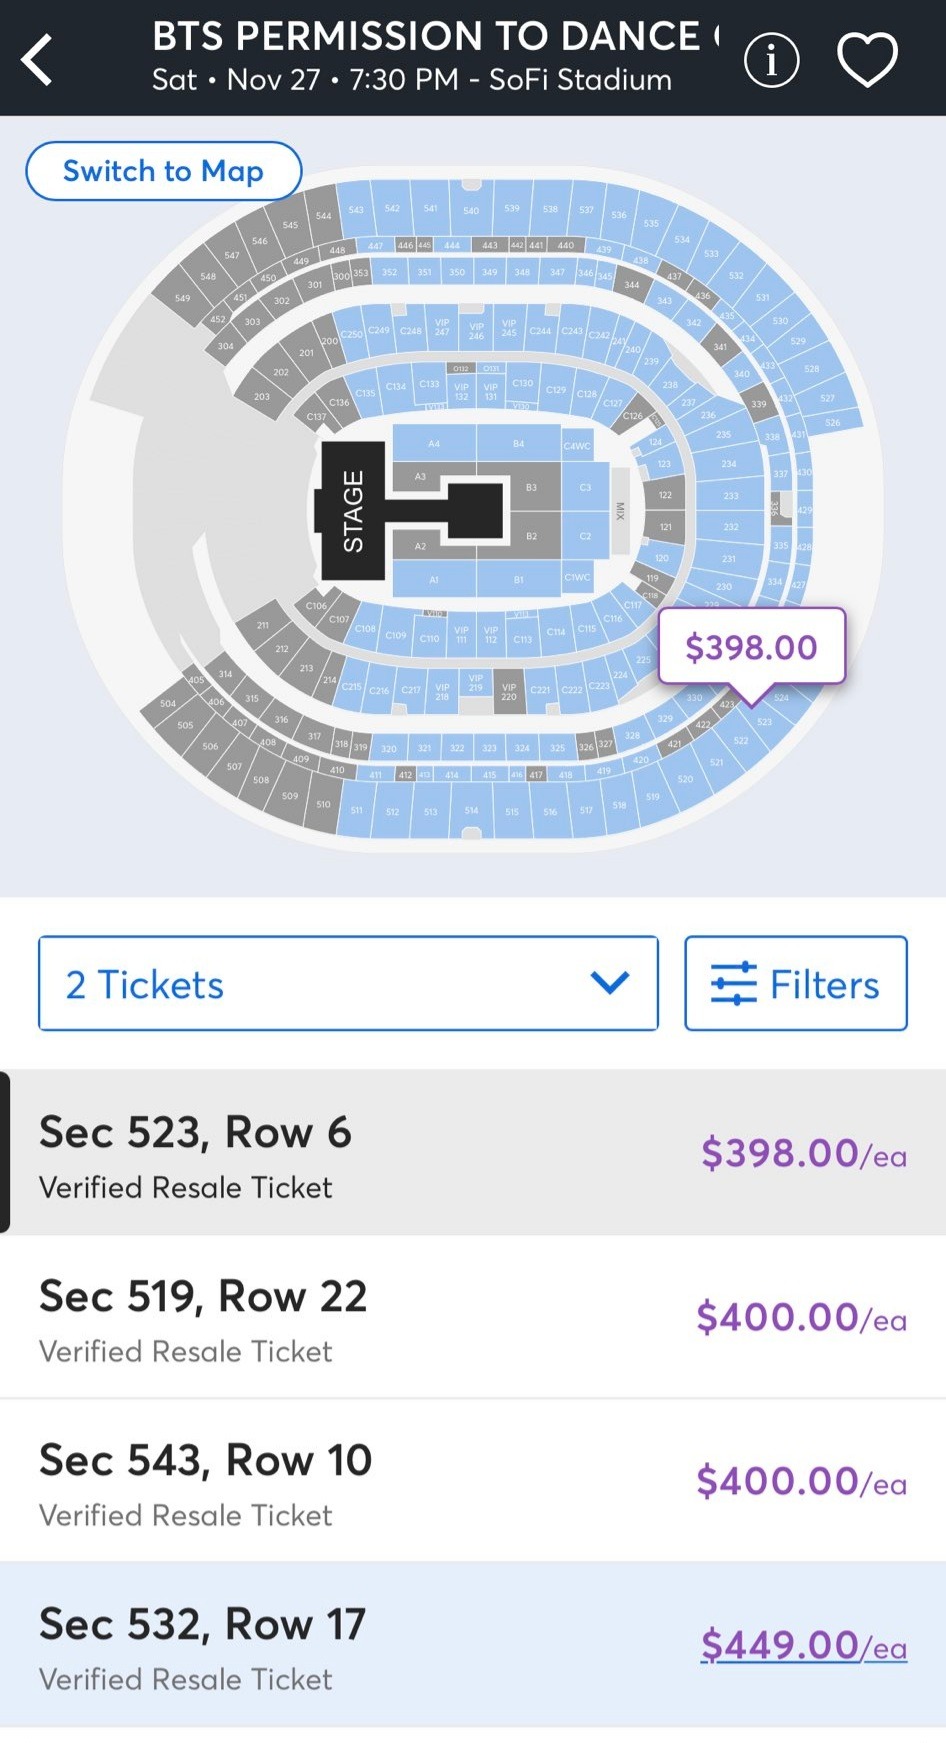
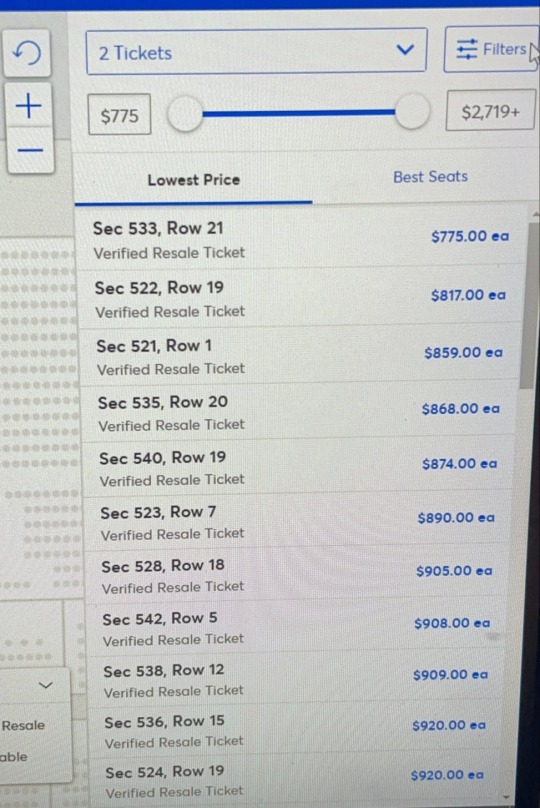
This result was indeed true and indicative of what would happen in reality. As soon as tickets to the PTD On Stage Concert were sold out, resellers dramatically increased the prices they sold their tickets for. The pictures below show the total amount that each ticket in various sections originally cost. Because resellers knew demand was high and that tickets were finite and limited, they made the decision to raise their prices. And due to their actions, I was not able to get tickets for the concert.
0 notes
Text
International trade and current price of Gas in the US
Name: Ali Al Dawood
ID#: 93578138
Thursday. 8.p.m. discussion
Very recently the gas prices especially in California have experienced a dramatic growth due to the war in Ukraine. Russia is one of the biggest oil producers in the world, but as its attack on Ukraine started, traders, shippers, and financiers stopped importing oil from Russia. The US has also stopped importing oil from Russia, which would cause a dramatic change in the oil price in the US since roughly 8% of the crude oil import came from Russia last year. So, this has led to lowering the supply of oil which is essentially the source of gas, thus shifting the supply curve for the demand and supply graph to the left as shown below:
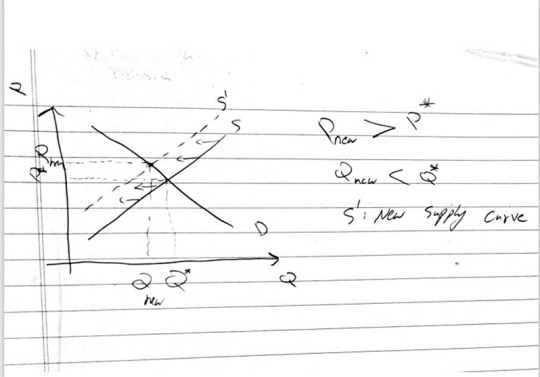
This shift in price would cause consumers to consider other substitute goods, such as buying electric vehicles, or moving closer to the work place so that they minimize the consumption of gas. So in the long run, the demand curve for the gas would shift to the left as a result of the presence of substitute good and that the market for gas is more elastic in the long run, which would lead the price to return to the original equilibrium price in the long run.
0 notes
Text
Impact of Substitutes on the Automobile Industry (Subaru BRZ vs Toyota 86)
Name of student - AbhiramaShankara Srinath
ID - 71877825
I recently helped one of my roommates in deciding what his first car should be. He finally bought a Subaru BRZ. A close substitute to this car is the Toyota 86 (in terms of performance and appearance). While I spent weeks researching these cars, the economist in me took interest to study the effect that these car substitutes had on each others’ markets.

Both of them were introduced into the automobile industry simultaneously towards the end of 2012. Over the years, the trends in prices and demand for these cars have been telling. To make our inferences easier, I have inserted a table below. While this is not a simple market like the ones we studied in this course, we can still observe trends based on concepts learned in class. As a result, some of the numbers show delayed effects.
*Each year shows an increase in price due to the addition of new features (similar features are added in both cars)

We observe that in the first couple years of production, despite higher prices, Toyota sells more cars due to their popularity in the automobile market.
But, with the establishment of the Subaru BRZ as a reliable substitute which is available at a lower price, the demand for it begins to exceed that of the 86, which starts to see a steady decline. This is a result of the reduced price of the 86's substitute - the BRZ. This causes the equilibrium price of the 86 to go down in comparison to the BRZ (whose price jump will be much higher).
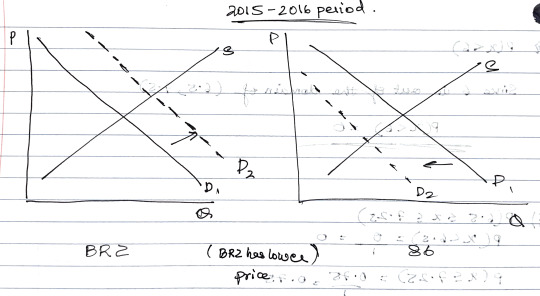
However, we observe a decline in the sales of the BRZ between years 2017 and 2018. This can be attributed to the price spike in the cost of the BRZ. Meanwhile, the demand for the 86 increases 4133 to 6846. This is a result of the lower prices of the 86 (the substitute) during these years. This causes a shift in the equilibrium for the 86, resulting in a higher equilibrium price, while that of the BRZ goes lower (the jump in price)
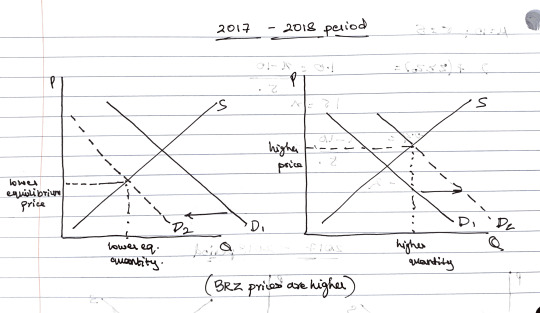
These clearly observable trends show us how the market for a product is affected by the presence of substitutes. When we see the price of one good rise above its substitute, the demand for the substitute increases. This increase eventually causes an upward shift in equilibrium price and quantity. Meanwhile, the demand for the original good goes down, causing a lowering shift on its equilibrium price and quantity.
0 notes