#years active 1944-97 & 2011
Photo
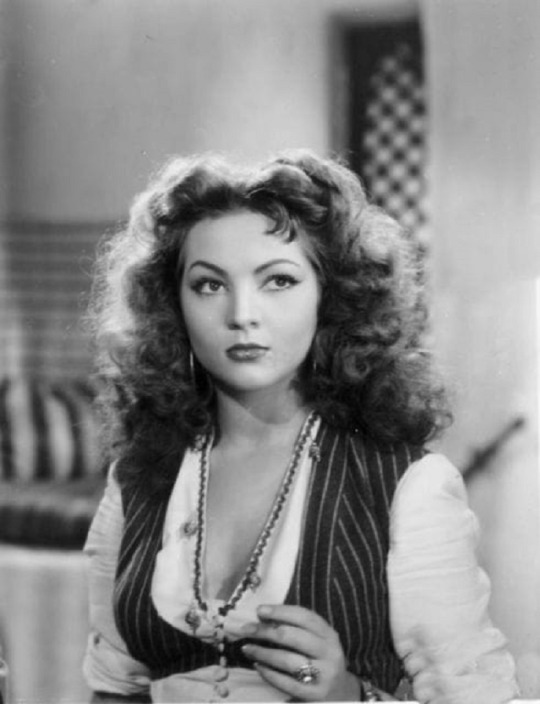

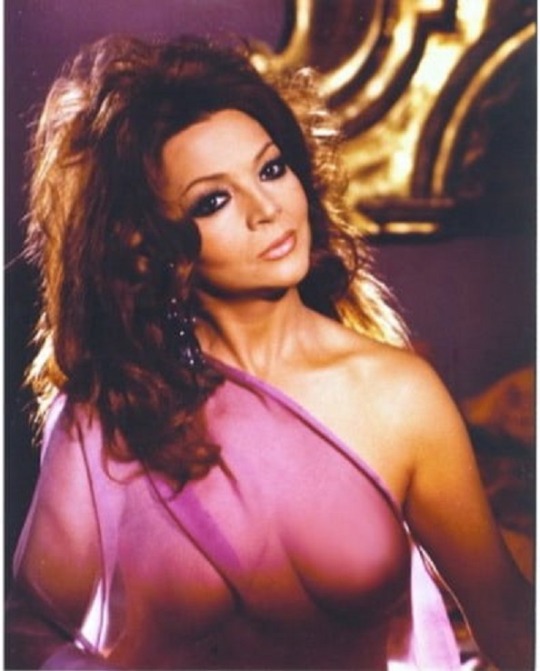
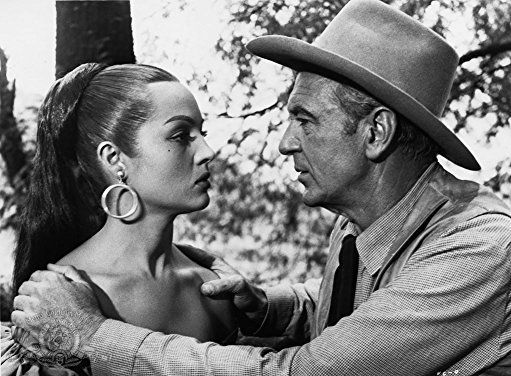
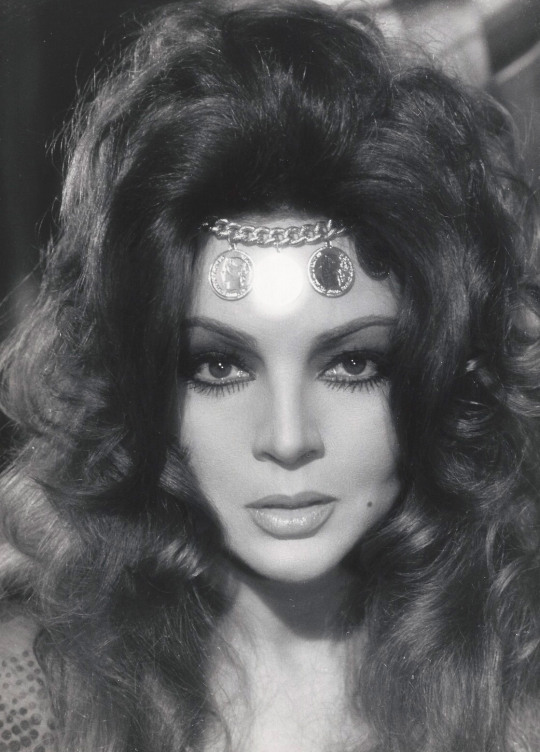


Happy Birthday To Beautiful Spanish Actress Sara Montiel
(Born 10th March 1928)
Pics Sources: Listal.com & Bing Images
#sara montiel#birthday girl#born 8th march 1928#beautiful spanish actress#singer#nickname: saritisima#film debut in 1944 (15 years old)#voluptuous#famous for her roles in the last torch song (1957) and la violetera (1958) - both films became the highest grossing films in spanish history#the soundtracks to both films reportedly outsold elvis presley and frank sinatra in the world market (I.M.D.B)#best known in usa for her roles in vera cruz (1954) - run of the arrow (1957)#53 acting credits#years active 1944-97 & 2011#pics sources: listal.com & bing images
89 notes
·
View notes
Text
No geologist at the IPCC? Wonder why...
27 Simple Bullet Points Prove Global Warming by the Sun, not CO2: By a Geologist for a Change
Dr Roger Higgs, Geoclastica Ltd, Technical Note on ResearchGate https://www.researchgate.net/publication/332245803_27_bullet_points_prove_global_warming_by_the_sun_not_CO2_by_a_GEOLOGIST_for_a_change
1) The IPCC (United Nations Intergovernmental Panel on Climate Change) has no geologists among the 100s of authors of its last major report (2013-14) & at most 1 in the next (2022; see my Tech. Note 2019-10). Thus IPCC focuses on only the last 150 years (since thermometer records began, c. 1850), yet Earth is 30 million (sic) times older, 4.5 billion years! Geologists know Earth has always warmed and cooled. Climate change is perfectly normal.
2) The IPCC’s very existence relies on public belief in man-made or ‘anthropogenic’ global warming (AGW) by CO2. IPCC authors, mostly government & university researchers, are biased by strong vested interests in AGW (publications; continuance of salaries; research grants). Similarly, universities have sacrificed their impartiality by hosting institutes mandated to confirm & act on AGW, e.g. Grantham Institute (Imperial College), Tyndall Centre.
3) The often-parroted ‘97% consensus among scientists that global warming is man’s fault’ (CO2 emissions) is untrue. It refers in fact to surveys of just a relatively small group of ‘climate scientists’ (a new type of generalist scientist, with strong incentives for bias; see Bullets 2 & 15), moreover only those who are ‘actively publishing’.
4) No educated person ‘denies’ modern global warming; it’s been measured (Bullet 11). ‘Global warming deniers’ is a deceitful term for man-made global warming doubters & deniers (most of Earth’s real scientists?).
5) CO2 is a ‘greenhouse gas’. But as CO2 rises, its theoretical heat-trapping ability sharply declines, already 67% ‘used up’ at 100 parts per million (ppm) CO2, 84% at 300ppm (NB 275ppm when industrial CO2 output began; Bullet 8), 87% at 400ppm (today 415ppm, or 0.04%) and >99% at 1000ppm. Moreover, Climate Sensitivity (CS), the warming due to doubling CO2, is guesswork. IPCC ‘estimates’ CS from climate models (circular reasoning) as probably between 1.5 & 4.5 (300% contrast!), but models are defective (Bullet 6). In reality CS might be very near zero, perhaps explaining why up to 7,000ppm in Phanerozoic time (Bullet 7) did not cause ‘runaway’ warming.
6) IPCC climate models are so full of assumptions as to be useless or (worse) misleading, e.g. forecast 1995-2015 warming was 2-3 times too high! Bullet 19 gives another drastic failure. Even Wiki (2019) admits: “Each model simulation has a different guess at processes that scientist don't understand sufficiently well”. Models also dismiss the sun’s fluctuations & omit the multi-decade delay between these & the resulting warming or cooling. This time-lag is due to ocean thermal inertia (mixing-time), grossly underestimated by IPCC (Bullets 15, 21).
7) For ~75% of the last 550 million years, CO2 was 2 to 15 times higher than now. Evolution flourished, with CO2 enabling plant photosynthesis, the basis of all life. Extinction events due to overheating by CO2 are unknown.
8) Through the last 12,000 years (our current ‘Holocene’ interglacial epoch), CO2 was a mere 250 to 290 ppm, near plant-starvation level (about 150ppm), until about 1850 when industrial CO2 emissions began, making CO2 climb steeply. CO2 today is still only 415ppm, or 0.01%, i.e. less than half of one-tenth of 1% of our atmosphere.
9) Until man began adding CO2 about 1850, warming (determined from ‘proxies’ like tree rings) since the 1700AD Little Ice Age nadir was accompanied by slowly rising CO2 (measured in ice cores). A simple explanation is the well-known release of CO2 by warming ocean water (decreasing its CO2-holding capacity).
10) Other evidence, besides Bullet 9, that rising CO2 is a consequence, not cause, of global warming is Humlum’s demonstration that changes in CO2 growth rate lag behind changes in warming rate (by about 1 year); and also ...
11) Since the ~1850 start of man’s CO2 additions, thermometer-measured global warming (1.3 degrees C) was interrupted by frequent minor coolings of 1-3yrs (not all attributable to mega-volcano ‘winters’) & two substantial coolings (0.2 deg) of 30yrs (1878-1910, 1944-1976), plus the 1998-2013 ‘warming pause’ (Wiki). In contrast, CO2’s rise has accelerated, with only a brief pause (1887-97) & a mini-reversal (1940-45), both during the 30-yr coolings.
12) This unsteady ‘sawtooth’ Modern Warming resembles the sawtooth rise of the sun’s magnetic output from 1901 toward a rare solar ‘Grand Maximum’ (GM; peak 1991), unmatched since 300AD! See Bullet 21.
13) Warming reached a peak in Feb 2016. Since then, Earth has cooled >3 years. NB no mega-eruption since 1991.
14) The ‘Svensmark Theory’ says rising solar-magnetic output deflects cosmic rays, thus reducing cloudiness, allowing more of the sun’s warmth to heat the land and ocean instead of being reflected by clouds. In support, a NASA study of satellite data spanning 1979-2011 (‘Modern Warming’; Bullet 12) showed decreasing cloud cover.
15) Potsdam Institute for Climate Impact Research vocal climate scientist Dr Stefan Rahmstorf (Wiki) wrongly said in 2008: "there is no viable alternative ... [to CO2 as driver of 1940-2005 warming, as] ... different authors agree that solar activity did not significantly increase”. Yet in 1999, physicist Dr Michael Lockwood FRS (Wiki) wrote in prestigious Nature journal: "the total magnetic flux leaving the Sun has risen by a factor of 1.4 since 1964” & 2.3 since 1901 !
16) Lockwood showed averaged solar magnetic flux increased 230% from 1901 to 1995, i.e. more than doubled ! The final peak value was 5 times the starting minimum value ! Bullets 17 & 18 likewise back Svensmark’s theory.
17) After the ~300AD solar GM (Bullet 12), in 0.5cm/yr), all reaching higher than today, long before industrial CO2. 27) If we stop expanding fossil-fuel use, CO2 will soon stabilise at a new equilibrium (nearer optimum for plants).
2 notes
·
View notes
Text
Kay County, Oklahoma - Wikipedia

County in the United States
Kay County is a county located in the U.S. state of Oklahoma. As of the 2010 census, the population was 46,562.[1] Its county seat is Newkirk,[2] and the largest city is Ponca City.
Kay County comprises the Ponca City, OK Micropolitan Statistical Area. It is in north central Oklahoma on the Kansas state line.
Before statehood, Kay County was formed from the “Cherokee Strip” or “Cherokee Outlet” and originally designated as county “K.” Its name means simply that.[3][4] Kay County is the only county to keep its same name as the Oklahoma area moved from a territory to a state.
History
After the Civil War, the Cherokee Nation had to allow the Federal Government to relocate other Native American tribes to settle in the area known as the Cherokee Outlet, The Kansa (Kaw) arrived in June 1873, settling in what would become the northeastern part of Kay County. The Ponca followed in 1877. The Nez Perce came from the Pacific Northwest in 1879, but remained only until 1885, when they returned to their earlier homeland. Their assigned land in Oklahoma was then occupied by the Tonkawa and Lipan Apache people.[3]
The Chilocco Indian Agricultural School, north of Newkirk, was a boarding school for Indians that operated from 1884 to 1980. Its enrollment peaked at 1,300 in the 1950s and its graduates include members of 126 Indian tribes. The distinguished old buildings of the school were constructed of local limestone.[5]
In 2010, the Keystone-Cushing Pipeline (Phase II) was constructed north to south through Kay County to Cushing in Payne County.
Geography
According to the U.S. Census Bureau, the county has a total area of 945 square miles (2,450 km2), of which 920 square miles (2,400 km2) is land and 25 square miles (65 km2) (2.7%) is water.[6] The highest point in Kay County, Oklahoma, is west of North Sage Lane (36′56″12°N, 96′53″40°W), at 1,310 feet (400 m) above sea level. The lowest point is 891 feet (272 m) where the Arkansas River leaves the county.[7]
The northern boundary is the border with Kansas and its eastern boundary is with Osage County. Kaw Lake, a large reservoir on the Arkansas River completed in 1975 includes most of the water area of the country. East of Kaw Lake and the Arkansas River is the region called the Osage Hills or The Osage, a tall-grass prairie region of large livestock, mostly cattle, ranches. West of the Arkansas River the land is flatter and a mixture of cultivated lands and livestock ranches. Principal rivers flowing through the county are the Chikaskia River, the Arkansas River and the Salt Fork of the Arkansas River.[3]
Major highways
Adjacent counties
Demographics
Historical population Census Pop. %± 190022,530—191026,99919.8%192034,90729.3%193050,18643.8%194047,084−6.2%195048,8923.8%196051,0424.4%197048,791−4.4%198049,8522.2%199048,056−3.6%200048,0800.0%201046,562−3.2%Est. 201644,943[8]−3.5%U.S. Decennial Census[9]
1790-1960[10] 1900-1990[11]
1990-2000[12] 2010-2013[1]
As of the census[13] of 2000, there were 48,080 people, 19,157 households, and 13,141 families residing in the county. The population density was 52 people per square mile (20/km²). There were 21,804 housing units at an average density of 24 per square mile (9/km²). The racial makeup of the county was 84.16% White, 1.79% Black or African American, 7.53% Native American, 0.53% Asian, 0.02% Pacific Islander, 1.98% from other races, and 4.00% from two or more races. 4.25% of the population were Hispanic or Latino of any race.
There were 19,157 households out of which 31.90% had children under the age of 18 living with them, 54.70% were married couples living together, 10.20% had a female householder with no husband present, and 31.40% were non-families. 27.90% of all households were made up of individuals and 13.10% had someone living alone who was 65 years of age or older. The average household size was 2.45 and the average family size was 2.99.
In the county, the population was spread out with 26.40% under the age of 18, 8.80% from 18 to 24, 25.00% from 25 to 44, 22.80% from 45 to 64, and 17.00% who were 65 years of age or older. The median age was 38 years. For every 100 females there were 93.70 males. For every 100 females age 18 and over, there were 89.90 males.
The median income for a household in the county was $30,762, and the median income for a family was $38,144. Males had a median income of $30,431 versus $19,617 for females. The per capita income for the county was $16,643. About 12.40% of families and 16.00% of the population were below the poverty line, including 22.70% of those under age 18 and 9.50% of those age 65 or over.
Life expectancy
Of 3,142 counties in the United States in 2013, Kay County County ranked 2,619 in the average life expectancy at birth of male residents and 2,642 in the life expectancy of female residents, both among the lowest 25 percent of all U.S. counties. Males in Kay County lived an average of 72.5 years and females lived an average of 77.7 years compared to the national average for life expectancy of 76.5 for males and 81.2 for females.
In the 1985-2013 period, the average life expectancy in Kay County for females declined by 0.8 years while male longevity increased by 2.0 years. Compared to the national average for the same period of an increased life expectancy of 5.5 years for men and 3.1 years for women, Kay county ranked in the worst performing 10 percent of all counties. High rates of smoking and obesity for both sexes and a low level of physical activity for males appear to be contributing factors to the relatively short life expectancy.[14]
Politics
Voter Registration and Party Enrollment as of January 15, 2019[15]Party Number of Voters Percentage Democratic 6,934 28.58% Republican 13,553 55.87% Others 3,771 15.54% Total 24,258 100%
Presidential elections results
Presidential elections results[16] Year Republican Democratic Third parties 2016 72.4% 12,172 22.3% 3,738 5.3% 893 2012 71.3% 11,499 28.7% 4,627 2008 70.8% 13,230 29.2% 5,463 2004 70.3% 14,121 29.7% 5,957 2000 64.8% 11,768 33.7% 6,122 1.5% 272 1996 49.9% 9,741 35.3% 6,882 14.8% 2,891 1992 39.9% 9,115 29.1% 6,643 31.0% 7,070 1988 61.5% 12,646 37.7% 7,751 0.8% 167 1984 73.0% 16,731 26.4% 6,044 0.6% 136 1980 67.2% 15,004 28.9% 6,449 4.0% 884 1976 56.3% 12,441 42.4% 9,371 1.2% 274 1972 78.4% 17,244 19.3% 4,246 2.3% 494 1968 59.1% 12,751 27.9% 6,031 13.0% 2,809 1964 51.6% 12,033 48.4% 11,296 1960 64.8% 15,156 35.2% 8,249 1956 64.8% 14,837 35.2% 8,071 1952 66.3% 16,460 33.7% 8,382 1948 47.0% 8,982 53.0% 10,119 1944 52.1% 9,498 47.5% 8,656 0.5% 88 1940 47.9% 10,003 51.4% 10,725 0.8% 156 1936 35.8% 6,671 63.5% 11,846 0.7% 132 1932 31.4% 5,884 68.6% 12,841 1928 76.2% 13,829 23.1% 4,196 0.8% 136 1924 51.2% 7,392 41.9% 6,049 7.0% 1,007 1920 55.5% 5,959 42.3% 4,546 2.2% 231 1916 46.7% 2,482 44.0% 2,340 9.3% 496 1912 47.6% 2,508 45.2% 2,380 7.2% 379
Communities
Unincorporated communities
Notable people
See also
References
^ a b "State & County QuickFacts". United States Census Bureau. Archived from the original on June 6, 2011. Retrieved November 9, 2013.
^ "Find a County". National Association of Counties. Archived from the original on 2011-05-31. Retrieved 2011-06-07.
^ a b c Linda D. Wilson, "KayCounty." Encyclopedia of Oklahoma History and Culture.
^ Gannett, Henry (1905). The Origin of Certain Place Names in the United States. Govt. Print. Off. p. 172.
^ Brumley, Kim. Chilocco: Memories of a Native American Boarding School. Fairfax, OK: Guardian Publishing Co., 2010, p. 37
^ "2010 Census Gazetteer Files". United States Census Bureau. August 22, 2012. Retrieved February 21, 2015.
^ Google Earth
^ "Population and Housing Unit Estimates". Retrieved June 9, 2017.
^ "U.S. Decennial Census". United States Census Bureau. Archived from the original on April 26, 2015. Retrieved February 21, 2015.
^ "Historical Census Browser". University of Virginia Library. Retrieved February 21, 2015.
^ Forstall, Richard L., ed. (March 27, 1995). "Population of Counties by Decennial Census: 1900 to 1990". United States Census Bureau. Retrieved February 21, 2015.
^ "Census 2000 PHC-T-4. Ranking Tables for Counties: 1990 and 2000" (PDF). United States Census Bureau. April 2, 2001. Retrieved February 21, 2015.
^ "American FactFinder". United States Census Bureau. Retrieved 2008-01-31.
^ "Archived copy" (PDF). Archived from the original (PDF) on 2016-04-12. Retrieved 2017-02-20.CS1 maint: Archived copy as title (link)
^ "Oklahoma Registration Statistics by County" (PDF). OK.gov. January 15, 2019. Retrieved 2019-02-27.
^ Leip, David. "Dave Leip's Atlas of U.S. Presidential Elections". uselectionatlas.org. Retrieved 2018-03-29.
Places adjacent to Kay County, Oklahoma
Coordinates: 36°49′N 97°08′W / 36.81°N 97.14°W / 36.81; -97.14
0 notes
Text
Old-School Stats Or Fancy-Pants Analytics? The Red Sox Have An MVP Candidate For Each.
Most years, the American League’s Most Valuable Player award is basically Mike Trout’s hardware to lose. In his five full MLB seasons,1 the Los Angeles Angels outfielder never finished lower than second in MVP voting — winning the honor twice — and he led the AL in wins above replacement2 each of those campaigns.
Before he got hurt in early August, Trout was well on his way to extending that streak this season, positioning himself for another strong run at the MVP (or at least another hearty Trout-for-MVP debate). But Trout’s injury sidelined him for nearly a month, and he wasn’t quite himself after coming back; moreover, his Angels are going nowhere in the standings. Meanwhile, his rivals have been on fire, making their dueling MVP cases — while playing together in the same lineup.
Yes, Mookie Betts and J.D. Martinez of the Boston Red Sox are arguably the two front-runners now for the AL MVP. And the choice between teammates could prove to be yet another battleground in the divide between old- and new-school ways of judging player value. By the advanced metrics, Betts is having a historic season; Martinez, though, could pull off an impressive statistical feat that hasn’t been accomplished since the 1950s.
It makes sense that a pair of MVP candidates would emerge from a season as charmed as the one unfolding in Boston this summer. At 98-46, the Red Sox have the best record in baseball and are tracking to finish the year with 109 wins, which would be the most in MLB since the Seattle Mariners won 116 in 2001. Such a powerhouse team doesn’t happen without multiple great performances, and Betts and Martinez have supplied plenty of greatness this year. (To go with the great pitching season of Chris Sale, who might win the Cy Young despite missing most of August and early September with an injury.)
For his part, Betts has been squarely in the MVP discussion all season long. Though he trailed Trout in WAR early — as Trout seemed to be launching maybe the best individual season in MLB history — Betts also kept surprisingly close to his fellow outfield star with a historic start of his own. After Trout was injured, Betts passed him in WAR and hasn’t really looked back, pouring on a .942 on-base plus slugging (seventh-best in the AL) since the All-Star break with strong defense in right field.
In terms of WAR, Betts is on pace for 10.4 on the season, which would place him in elite company. Since 1901, only 21 batters have ever broken 10 WAR in a season, and all of them either are in the Hall of Fame, would be in the Hall of Fame if not for allegations of performance-enhancing drug use (Barry Bonds and Sammy Sosa) or are currently active (Trout). Betts is also putting on a tour de force in all-around ball-playing: On a rate basis, his season is one of only nine since 19133 in which a qualified batter ranked in the 80th percentile or higher in contact rate, walk rate, isolated power, base-running runs and defensive runs above average.4
Mookie is having an all-around season for the ages
Qualified seasons in which a batter was in the 80th percentile of MLB in contact rate, walk rate, isolated power, base-running runs and defensive value (adjusted for position), 1913-2018
Percentile Rank in… Player Year Team Contact% Walk% Iso. Power Base Running Defensive Value Mookie Betts 2018 Red Sox 89 89 98 96 83 Ian Kinsler 2011 Rangers 95 92 89 88 87 George Brett 1980 Royals 98 82 99 88 86 Fred Lynn 1980 Red Sox 80 87 82 80 82 Joe Morgan 1975 Reds 82 100 88 97 91 Joe Morgan 1973 Reds 82 95 91 95 86 Stan Musial 1944 Cardinals 87 91 96 89 85 Tris Speaker 1919 Indians 98 91 91 82 81 Tris Speaker 1914 Red Sox 97 84 96 92 82
Defensive value includes positional adjustment, so more difficult/valuable positions get more credit.
Sources: Baseball-Reference.com, FanGraphs.com
Ordinarily, an individual season as brilliant as Betts is having — on a team as dominant as Boston has been — would almost automatically guarantee an MVP.
But things have gotten a little complicated recently, as Martinez’s candidacy has been picking up more and more steam. Martinez has a 1.038 OPS this season, and he now ranks seventh in the AL in WAR. More importantly for his MVP case, Martinez also currently sits second in baseball (behind Betts) in batting average, second (behind Khris Davis) in home runs and first in runs batted in.
If he climbs to No. 1 in each category, Martinez would become the first player since Mickey Mantle in 1956 to win the MLB-wide Triple Crown: leading both leagues in average, homers and RBI. Miguel Cabrera famously won the AL Triple Crown in 2012 — the first in baseball since 1967 — and the cachet helped him win the MVP over Trout despite a sizable edge for Trout in WAR.
For MVP voters with a traditional approach to the award, that type of feat would be impossible to ignore, regardless of how great Betts has been. So we could be looking at another referendum on the relative importance of an all-time great WAR season versus greatness in some of the oldest measurements in the book. Pair that with an NL Cy Young race that promises to test voters’ age-old allegiances to pitcher wins, and baseball’s award season should have plenty of nerds-vs.-fogies intrigue this year.
Of course, Martinez still has a lot of work to do to grab the lead in each Triple Crown category. And given some of the recent changes in how award voters view the game, a 10-WAR performance from Betts could carry the day even if Martinez pulls off the old-fashioned feat. Both Red Sox sluggers also still need to hold off potential late MVP surges from Trout or Indians third baseman Jose Ramirez, who’s also enjoying a historically great season. But the potential is there for this award chase to be epic, pitting teammate against teammate and old stats against new ones.
Check out our latest MLB predictions.
from News About Sports https://fivethirtyeight.com/features/old-school-stats-or-fancy-pants-analytics-the-red-sox-have-an-mvp-candidate-for-each/
0 notes
Text
Have You Heard? Trading Gossip Can Be Good for You
New Post has been published on https://getyourgossip.xyz/have-you-heard-trading-gossip-can-be-good-for-you/
Have You Heard? Trading Gossip Can Be Good for You
Call it the Super Bowl of Spelling. This week, a record 516 pint-sized spellers are sweating out their ABCs in the Maryland Ballroom of the Gaylord National Resort and Convention Center in National Harbor, Maryland, hoping to be crowned the 2018 Scripps National Spelling Bee champion. You may know how to spell “victory,” but here are 25 things you might not know about the country’s best-known gathering of logophiles.
1. IT WAS ORGANIZED BY A NEWSPAPER.
The National Spelling Bee was inaugurated in 1925 by Kentucky’s Louisville Courier-Journal as a way to consolidate a number of local spelling bees and generate “general interest among pupils in a dull subject.” (Cash prizes have a tendency to do that.) The E.W. Scripps Company didn’t take ownership of the Bee until 1941.
2. FRANK NEUHAUSER WAS THE BEE’S FIRST OFFICIAL CHAMPION.
Neuhauser, an 11-year-old from Louisville, Kentucky, beat out eight other finalists to become the National Spelling Bee’s first champion. His word for the win? Gladiolus. Yes, the flower. On March 22, 2011, Neuhauser—a retired lawyer—passed away at his home in Silver Spring, Maryland at the age of 97.
3. IN 1926, PAULINE BELL BECAME THE FIRST FEMALE CHAMPION.
In the Bee’s second year, it declared its first female winner, Pauline Bell, who won by correctly spelling the color cerise. Bell kicked off a trend of female winners: Of the Spelling Bee’s 93 champions, 48 of them have been girls. This year, 45 percent of the competitors are girls.
4. THERE WERE NO WINNERS IN 1943, 1944, OR 1945.
That’s because the Spelling Bee was put on hold during World War II.
5. THERE WERE TWO WINNERS ON SIX OCCASIONS
Co-champions have long been a possibility at the National Spelling Bee, and were a reality in 1950, 1957, 1962, 2014, 2015, and 2016, when 11-year-old Nihar Janga of Austin, Texas, and 13-year-old Jairam Hathwar of Corning, New York, both walked away winners. To prevent this continuing trend, the Bee changed the rules in 2017 by requiring all of the spellers still standing at 6 p.m. on the Bee’s final day to complete a written test to be used to break a tie.
6. THE BEE WAS FIRST TELEVISED IN 1946.
The Bee’s national finals were first broadcast live on NBC in 1946. Portions of the Spelling Bee have since been broadcast on PBS and ABC as well. But since 1994, ESPN has been the Bee’s biggest champion, broadcasting near-constant spelling action throughout the entire competition.
7. NO ONE REALLY KNOWS WHERE THE WORD “BEE” COMES FROM.
According to the folks at Scripps:
“The word ‘bee,’ as used in ‘spelling bee,’ is one of those language puzzles that has never been satisfactorily accounted for. A fairly old and widely-used word, it refers to a community social gathering at which friends and neighbors join together in a single activity (sewing, quilting, barn raising, etc.) usually to help one person or family.
“The earliest known example in print is a spinning bee, in 1769 … Spelling bee is apparently an American term. It first appeared in print in 1875, but it seems certain that the word was used orally for several years before that.”
8. MERRIAM-WEBSTER’S UNABRIDGED DICTIONARY IS THE SPELLING BEE BIBLE.
With more than 472,000 word entries, it’s the official dictionary [PDF] of the Scripps National Spelling Bee—and the only one that counts in terms of spelling.
9. KIDS ARE GIVEN A TOTAL OF TWO MINUTES TO SPELL A WORD.
The countdown begins when the pronouncer first pronounces the word.
10. “KNAIDEL” CAUSED A CONTROVERSY IN 2013.
In 2013, New Yorker Arvind Mahankali won the competition by spelling the word “knaidel,” another word for matzo ball. While a number of Yiddish speakers claimed that Mahankali’s spelling was incorrect, the then-13-year-old’s spelling of the word was the same as Merriam-Webster’s, leading the event’s organizers to declare that there was no controversy at all.
11. A TRAFFIC LIGHT HELPS SPELLERS KEEP TRACK OF THE TIME.
Spellers have the benefit of viewing a monitor with a traffic light to keep track of time. For the first 75 seconds, the traffic light is green, followed by 15 seconds of yellow. At the 30-second mark, the light turns red and a countdown clock appears. Neither the judges nor the pronouncer can communicate with the speller once the monitor has shifted into “red light mode.”
12. PRONOUNCER DR. JACQUES BAILLY IS A CHAMPION SPELLER, TOO.
For the past 16 years, Dr. Jacques Bailly has served as the Spelling Bee’s official pronouncer, and was an associate pronouncer for 12 years before that. But his history with the Spelling Bee goes back even further—all the way back to 1980, when he won the whole shebang at the age of 14 by correctly spelling elucubrate.
13. DR. BAILLY DOESN’T PLAY FAVORITES.
“I always want them to get all the words right,” Bailly told TIME in 2009 about sympathizing with the entire lineup of spellers. “I think that’s a lot of the fun of the spelling bee—you root for everybody. And I try to make it clear to the spellers that I’m there to give them absolutely every possible thing that I can to help them—within some limits.” In fact, it’s part of Bailly’s job to help the speller. If he has some word information that he senses could be helpful to the speller, he can offer it up without the speller requesting it.
14. THEY TAKE “THE GIGGLE FACTOR” INTO ACCOUNT.
In a 2003 interview with the St. Petersburg Times, Bailly admitted that in the days leading up to the final event, Spelling Bee officials review every word for a final time and take into account something they call “the giggle factor,” explaining that “A word like ‘titillation’ might cause a sixth-, seventh- or eighth-grader to giggle.”
15. THE FIRST RULE OF THE SPELLING BEE WORD COMMITTEE IS YOU DO NOT TALK ABOUT THE SPELLING BEE WORD COMMITTEE.
Though there is a committee of officials who approve all the words that will be used in any year’s competition, “The first rule of the committee is not admitting that you’re on the committee,” Bee spokesman Chris Kemper told TIME in 2013. “The committee is the secret sauce of the spelling bee and the identity of those on the committee will not be revealed.”
16. BUT DR. BAILLY IS A MEMBER.
“It is true that Jacques is on the word committee,” Kemper admitted to ABC Denver in 2014. “But beyond that, the members of the team and their process is secret.”
17. MISSPELLINGS AREN’T THE ONLY CAUSE FOR DISQUALIFICATION.
In addition to clearly misspelling a word, there are four other reasons a speller can be disqualified. These include not approaching the microphone when it’s the speller’s at-bat (“unless there are extenuating circumstances that, in the judges’ sole discretion, merit holding the speller’s word in reserve and offering it to the speller after all other spellers in the round have spelled and before the close of the round”); engaging in “unsportsmanlike conduct”; altering the letters or sequence of letters in the process of retracing a spelling; or uttering “unintelligible or nonsense sounds” during the spelling process.
18. THE SPELLING BEE REQUIRES MORE THAN JUST SPELLING.
In 2013, vocabulary questions were added to the preliminary rounds, a move that was met with criticism by some, who believe that a spelling bee should be a test of one’s spelling ability only. But the Bee’s executive director, Paige Kimble, says the change in procedure is one that helps reinforce the Bee’s educational purpose. “What we know with the championship-level spellers is that they think of their achievement in terms of spelling and vocabulary being two sides of the same coin,” Kimble told the Associated Press in 2013. “These spellers will be excited at the opportunity to show off their vocabulary knowledge through competition.”
19. PAIGE KIMBLE AND DR. BAILLY GO WAY BACK.
When Dr. Bailly became the Spelling Bee champion back in 1980, it was Kimble (then known as Paige Pipkin) who he defeated. But all was not lost: She won the very next year, and has been working with the organization in a professional capacity since 1984.
20. “SCHWARMEREI” HAS KNOCKED OUT TWO FINALISTS.
This German origin noun, which means excessive sentimentality, has knocked out two finalists in recent years, once in 2004 and again in 2012. The former incident happened to 13-year-old Akshay Buddiga, who famously fainted on stage in the middle of spelling alopecoid earlier in the competition, only to get up and spell the word correctly.
21. “CONNOISSEUR” IS A WORD TO ANTICIPATE.
The French origin noun is the most frequent word on the Scripps National Spelling Bee word lists.
22. GOOD SPELLERS MAKE GREAT SCIENTISTS.
Jeffrey Blitz, who directed the 2002 Oscar-nominated documentary Spellbound about the National Spelling Bee, told TIME how he observed that many Spelling Bee finalists go on to have careers in science and medicine. “Something about the kind of brain that’s not intimidated by the dictionary in childhood seems well-suited to the work of medicine in adulthood,” he noted.
23. MORE THAN ONE-FIFTH OF THIS YEAR’S SPELLERS ARE BEE VETS.
Of 2018’s 516 competitors, 113 of them—nearly 22 percent—have competed previously at the Scripps National Spelling Bee.
25. SIVASAIPRANEETHREDDY DEVIREDDY IS THIS YEAR’S YOUNGEST SPELLER.
In 2017, 5-year-old Edith Fuller became the Bee’s youngest-ever speller. This year, 8-year-old Sivasaipraneethreddy Devireddy (Speller #383), from Mooresville, North Carolina, is the youngest competitor.
An earlier version of this article ran in 2014.
0 notes
Last Seen Blogs
swansbear
Swansbear's Blog

twoconchs
Two Conchs Charters

ikari-shinsei
I am just an artist

syukri567
Untitled

lamusiquelamusica
Music Is Universal