#Nathaniel Rakich and Dhrumil Mehta
Link
via Politics – FiveThirtyEight
Welcome to Pollapalooza, our weekly polling roundup.
Poll of the week
Electability is a very slippery concept, especially in presidential elections, so caution should be taken when saying Jane Candidate can or can’t win a general election. Electability means different things to different people, but whatever it means to them, more Democrats than usual may be prioritizing it when deciding their primary vote in 2020.
When asked whether they would prefer a presidential candidate who “comes closest to [their] views on issues” or one “with the best chance to defeat Donald Trump,” a full 40 percent of Democratic primary voters said it was most important to them to beat President Trump, according to an NBC News/Wall Street Journal poll conducted Feb. 24-27. A larger 56 percent said it was most important to agree with their candidate on the issues, but still — two-fifths of the party’s core voters prized electability over ideological purity.
True, this is far fewer than the share of Democrats who said this in a Monmouth University poll from late January. In that survey, 56 percent chose the more electable candidate, while 33 percent chose the candidate who agreed with them on the issues. However, the difference might be due to how the question was worded. Monmouth gave respondents a choice between “a Democrat you agree with on most issues but would have a hard time beating Donald Trump or a Democrat you do NOT agree with on most issues but would be a stronger candidate against Donald Trump.” Given that stark choice, it’s not all that surprising voters didn’t choose the candidate who they were explicitly told would have a difficult time defeating Trump.
Indeed, compared with similarly worded questions from past NBC News/Wall Street Journal polls, the share of primary voters who value electability is higher this year than it was in the last two presidential elections. NBC News and the Wall Street Journal asked the same question of Democratic primary voters in 2016 and of Republican primary voters in 2012.1 In July 2015, just 20 percent of potential Democratic primary voters chose the more electable candidate, while 79 percent chose the candidate closest to them on the issues. Five months later, the numbers were still very similar. And in October 2011, 31 percent of potential Republican primary voters said it was more important to beat then-President Barack Obama, while 67 percent picked the candidate who was a better ideological fit. However, by January 2012, the gap among Republicans narrowed to the point where it looked like this year’s Democratic numbers: 43 percent wanted to defeat Obama, and 54 percent wanted a candidate they agreed with.
Given how many Democrats see Trump as a uniquely alarming and unacceptable president, it makes sense that opponents would view it as more important to defeat him than they have other presidents. But in an era where the parties are very ideologically polarized, it’s notable that the goal can override those other considerations. That could affect how candidates market themselves to voters, leading to electability-focused pitches we’re not used to hearing in primaries. And it’s worth filing away for the next year, when we try to analyze Democrats’ motivations for settling on specific candidates.
Other polling nuggets
56 percent of Americans approve of how Trump is handling the economy according to a Gallup poll. That’s the highest number the pollster has recorded on this issue since Trump took office.
93 percent of Americans support background checks for all gun buyers according to a Quinnipiac poll. The policy proposal has been popular for a while — it has had between 88 and 97 percent support in every Quinnipiac poll taken since February 2013, shortly after the Sandy Hook massacre.
The same Quinnipiac poll also found that 44 percent of Americans approve of the way that Donald Trump is handling U.S. relations with North Korea. That’s down from 51 percent who approved in July 2018, the month after the summit between Trump and North Korean leader Kim Jong Un in Singapore.
Americans are split on whether they believe Michael Cohen’s testimony to the House Oversight Committee. According to a Monmouth poll, 37 percent believe that he was either “completely” or “mostly” honest in his testimony while 40 percent think that he was either “just partly honest” or “not at all honest”. Responses were split along party lines, with about two-thirds of Republicans saying he was partly or not at all honest and about two-thirds of Democrats saying that he was either partly or completely honest.
A YouGov/Economist poll gave Americans four hypothetical scenarios in which special counsel Robert Mueller’s investigation found wrongdoing by the president or his staff and asked respondents whether they would support starting impeachment proceedings in each scenario. In the situations where Trump was shown to have obstructed justice or to have personally asked for or accepted Russian assistance in the 2016 election, a plurality of Americans said they would support impeachment. But when asked if they’d support impeachment if Trump’s staff had accepted Russian assistance in the campaign,the public was split down the middle. Just 14 percent of Republicans said they would support Congress beginning impeachment proceedings if Trump’s staff had worked with Russia, while more than two-thirds of Democrats said they would support impeachment in the same scenario.
78 percent of Democratic voters in a Morning Consult/Politico poll said they think the U.S. needs a candidate who can “heal the division in our country by bringing people with different views together to make compromises.” Only 15 percent chose the other option, which was a candidate who “will fight back and is willing to break the rules to move the country in a different direction.”
37 percent of registered voters who say they will vote in the Republican primary would like another Republican to challenge Trump for the Republican nomination in 2020, according to an NBC/Wall Street Journal poll. Fifty-nine percent said they do not want a primary challenger and 4 percent were unsure.
According to the same NBC/Wall Street Journal poll, Republicans and Republican-leaning adults are about evenly split on whether they consider themselves to be more of a supporter of the Republican party (47 percent) or more of a supporter of Trump (45 percent). That’s a 6-point decline in support for Trump and a 9-point increase in party loyalty since January.
According to a Gallup poll conducted in February, 59 percent of Americans asked about conflict in the Middle East sympathize more with Israelis and 21 percent sympathize more with Palestinians. That’s a 5 percentage point decrease in those sympathizing with Israelis since last year, while the percentage of those sympathizing with Palestinians was essentially unchanged. The poll also found a steep decline in liberal Democrats’ support for Israelis. Last year, support Israelis outstripped support for Palestinians by 17 points; this year, that number had dropped to 3 points.
As the deadline for Britain’s exit from the European Union approaches, the latest YouGov poll finds that most people still back the choice they made in the initial Brexit referendum in 2016. The poll found that 89 percent of those who voted to remain in the EU still think that leaving the EU was the wrong choice, and 83 percent of those who voted to leave think it was the right decision.
Trump approval
According to FiveThirtyEight’s presidential approval tracker, 41.9 percent of Americans approve of the job Trump is doing as president, while 53.3 percent disapprove (a net approval rating of -11.4 points). At this time last week, 42.3 percent approved and 53.3 percent disapproved (for a net approval rating of -11.0 points). One month ago, Trump had an approval rating of 40.1 percent and a disapproval rating of 55.3 percent, for a net approval rating of -15.2 points.
Check out all the polls we’ve been collecting ahead of the 2020 elections.
1 note
·
View note
Text
Tuesday round-up
Recent coverage of the nomination of Judge Brett Kavanaugh to the Supreme Court focuses on newly released documents from Kavanaugh’s tenure in the office of independent counsel Kenneth Starr. For The Washington Post, Michael Kranish reports that “[a] 1998 memo written by Brett Kavanaugh proposed a series of tough, sexually explicit questions for President Bill Clinton to answer about his affair with Monica Lewinsky, shedding new light on the Supreme Court nominee’s moralistic outlook and his view of presidential power.” Additional coverage comes from Adam Liptak for The New York Times and Joan Biskupic at CNN.
At FiveThirtyEight, Nathaniel Rakich and Dhrumil Mehta look at polling that assesses the effect of potential votes for or against Kavanaugh on the re-election prospects of red-state Senate Democrats. For The Wall Street Journal, Natalie Andrews reports that “[a]s a senator in a state President Trump won by 19 percentage points, [Sen. Claire] McCaskill[, D-Ind.,] summed up her vote on his nomination as ‘damned if you do and damned if you don’t.’”
For The Washington Times, Alex Swoyer reports that Kavanaugh’s “dissents — among more than 300 opinions he has written while on the court [of appeals] — lay out what defenders and critics alike say is a conservative approach to the law, with deference to the political branches and the administration in particular.” At PBS’ Religion & Ethics Newsweekly, Mark Silk writes that “[b]ased on his record as a judge on the D.C. Circuit Court of Appeals, … Kavanaugh appears to be a more nuanced interpreter of the law than some right-wing Christians might hope.”
At Hosts of Error, Will Rosenzweig argues that “Kavanaugh’s ascension to the Court would exacerbate a more troubling trend for the future of our judiciary—a marked increase in political partisanship on the Court separate from the well-documented politicization of the nomination process in Congress.” At Fox News, Brian Flood writes that “a string of would-be media hits on … Kavanaugh[] have fizzled on impact — doing little to dent his image and, in some cases, backfiring on the news outlets that published them.” At National Review, Carrie Severino argues that “Senate Democrats are pushing ahead with their own desperate strategy to bury the confirmation process under a mountain of irrelevant document requests.”
Briefly:
Amy Howe reports for this blog, in a post that originally appeared at Howe on the Court, that during their November argument session, “the justices will hear oral arguments in 12 cases, involving topics that range from the proper method of service for a foreign country to pre-emption by the Atomic Energy Act.”
At Constitution Daily, Scott Bomboy offers “a quick look at three cases the Justices will consider during their first week of arguments.”
In an op-ed for The Denver Post, Michael Farris maintains that Jack Phillips, the cake artist at the center of last term’s Masterpiece Cakeshop case, “is asking the court to put an end to Colorado’s bullying and protect the right of creative professionals like him to decline to express messages or celebrate events that violate their beliefs” by filing a lawsuit against Colorado state officials who “found probable cause to believe that Masterpiece Cakeshop had violated Colorado’s public accommodation law when it declined to create” a custom cake to celebrate a gender transition.
We rely on our readers to send us links for our round-up. If you have or know of a recent (published in the last two or three days) article, post, podcast, or op-ed relating to the Supreme Court that you’d like us to consider for inclusion in the round-up, please send it to roundup [at] scotusblog.com. Thank you!
The post Tuesday round-up appeared first on SCOTUSblog.
from Law http://www.scotusblog.com/2018/08/tuesday-round-up-442/
via http://www.rssmix.com/
0 notes
Text
2018 House Forecast
How do you like your House forecast?
Lite
Keep it simple, please — give me the best forecast you can based on what local and national polls say
Classic
I’ll take the polls, plus all the “fundamentals”: fundraising, past voting in the district, historical trends and more
Deluxe
Gimme the works — the Classic forecasts plus experts’ ratings
Forecasting the race for the House
Published Aug. 16, 2018 at 11:00 AM
7 in 10
Chance Democrats win control (70.4%)
3 in 10
Chance Republicans keep control (29.6%)
AVERAGE
MEDIAN
CURRENTBREAKDOWN
CURRENTBREAKDOWN
Breakdown of seats byparty
↑
Higher
probability
267 D168 R
247 D188 R
227 D208 R
227 R208 D
247 R188 D
80% chance Democrats gain 13 to 55 seats
80% chance Democrats gain 13 to 55 seats
10% chance Democrats gain fewer than 13 seats
10% chance Democrats gain fewer than 13 seats
10% chance Democrats gain more than 55 seats
10% chance Democrats gain more than 55 seats
+55
+32 Democratic seats
AVG. GAIN
+13
Our forecast for every district
The chance of each candidate winning and projected vote share in all 435 House districts
Cartogram
Map
Solid D
≥95% D
Likely D
≥75% D
Lean D
≥60% D
Toss-up
50% nonincumbent party
= one district
District totals by category
189
8
19
10
19
53
137
MAJORITY
Chance of controlling the House
1 in 10
1 in 4
1 in 2
3 in 4
9 in 10
70.4%
70.4%
29.6%
29.6%
NOV. 6
ELECTION DAY
TODAY
AUG. 14, 2018
Seats controlled by each party
157-278
187-248
EVEN
247-188
277-158
227-208
227-208
Popular vote margin
Sept.
Oct.
Nov.
R+10
R+5
0
D+5
D+10
D+7.2
D+7.2
KEY
AVERAGE
80% CHANCE OF FALLING IN RANGE
How the House has swung historically
The projected swing of our current forecast along with the swing of every House election since 1924
Net advantage
Swing
0
100
200
300 seats
0
100
200
300
1926
1930
1934
1938
1942
1946
1950
1954
1958
1962
1966
1970
1974
1978
1982
1986
1990
1994
1998
2002
2006
2010
2014
2018
◄ More Democratic | More Republican ►
COOLIDGE
COOLIDGE
HOOVER
HOOVER
ROOSEVELT
ROOSEVELT
TRUMAN
TRUMAN
EISENHOWER
EISENHOWER
KENNEDY
KENNEDY
JOHNSON
JOHNSON
NIXON
NIXON
FORD
FORD
CARTER
CARTER
REAGAN
REAGAN
H.W. BUSH
H.W. BUSH
CLINTON
CLINTON
W. BUSH
W. BUSH
OBAMA
OBAMA
TRUMP
TRUMP
Most likely outcome
Most likely outcome
How this forecast works
Nate Silver explains the methodology behind our 2018 midterms forecast. Read more …
* For races in which the general election candidates haven’t yet been determined, we’re showing a leading primary candidate until a nominee is picked. Vacant seats are assigned to the party that previously held them for the purposes of seat totals and flips.
Forecast models by Nate Silver. Design and development by Aaron Bycoffe, Rachael Dottle, Ritchie King, Ella Koeze, Andrei Scheinkman, Gus Wezerek and Julia Wolfe. Research by Andrea Jones-Rooy, Dhrumil Mehta, Mai Nguyen and Nathaniel Rakich. Notice any bugs? Send us an email.
from News About Sports https://projects.fivethirtyeight.com/2018-midterm-election-forecast/house/
0 notes
Link
via Politics – FiveThirtyEight
Welcome to Pollapalooza, our weekly polling roundup.
Poll of the week
We at FiveThirtyEight hope you had a very patriotic Fourth of July — whatever that means to you. A YouGov poll, released this week, checked in on Americans’ feelings on patriotism and revealed some stark differences along — what else? — partisan lines.
Overall, the survey found that 76 percent of Americans consider themselves “very” or “somewhat” patriotic. But between Republicans and Democrats, there were pretty big differences: A whopping 97 percent of Republicans placed themselves in the “very” or “somewhat” categories, compared with 71 percent of Democrats. That’s a gap of 26 percentage points. Even more starkly, 72 percent of Republicans consider themselves to be “very” patriotic (the highest level of patriotism), compared with 29 percent of Democrats — a 43-point gap.
The poll also suggests that Democrats may define patriotism differently than their conservative counterparts. Specifically, YouGov found that Democrats are more likely than Republicans to believe that patriotism can include dissent:
52 percent of Democrats told YouGov that someone can criticize U.S. leaders to foreigners and still be considered patriotic, compared with 35 percent of Republicans.
51 percent of Democrats say disobeying a law they think is immoral doesn’t detract from their patriotism, compared with 33 percent of Republicans.
34 percent of Democrats think a person can still be a patriot even if he or she burns the American flag in protest, compared with 10 percent of Republicans.
And 55 percent of Democrats think an American can refuse to serve in a war he or she opposes and still maintain his or her patriotism, compared with 25 percent of Republicans.1
The “patriotism gap” is nothing new. Gallup has asked its respondents how proud they are to be Americans periodically since 2001. According to those polls, one year after the Sept. 11 attacks, 93 percent of Democrats and 99 percent of Republicans said they were either “extremely” or “very” proud to be Americans. The GOP number stayed comfortably in the 90s for the duration of George W. Bush’s presidency, but by January 2007, amid an unpopular war in Iraq that sparked no small amount of liberal dissent, the share of Democrats who were “extremely” or “very” proud to be Americans had shrunk to 74 percent — 21 points lower than the Republican share (and, to that point, the widest gap since Gallup started asking the question). The Democratic share increased during Barack Obama’s presidency (reaching a high of 85 percent in 2013) but was still consistently lower than the GOP’s: The share of Republicans who said they were “extremely” or “very” proudly American never dipped below 89 percent despite the extremely low opinion GOP voters had of Obama.
After the election of Donald Trump, the share of “extremely” or “very” proudly American Republicans ticked upward,2 but the share of Democrats saying the same thing plunged to 67 percent in 2017 and 60 percent just last month (the chart above has not been updated with the 2018 data). The current 33-point gap now holds the record for the widest gap between the two parties since 2001. (YouGov’s data also seems to suggest that Trump is contributing to the patriotism gap: The difference between the shares of Democrats and Republicans who said they were “very” patriotic rose from 29 points in 2013 to the current 43-point difference.)
So do Democrats’ feelings of patriotism rise and fall depending simply on who is in the White House? Data that Pew Research Center collected from 1987 to 2003 suggests that might not be the case. Throughout that time period, more Republicans than Democrats told pollsters that they “completely” agreed with the statement, “I am very patriotic.” In 1987, 51 percent of Republicans completely agreed, compared with 40 percent of Democrats. The two ticked up in tandem to Gulf War-era highs in 1991, but then, during the Bill Clinton administration, the gap widened: Democrats fell back into the 40s, while Republican agreement with that statement remained around 60 percent.
So what accounts for the persistent difference? It could just be that Republicans are more comfortable with the most obvious manifestations of patriotism these days. Public displays of patriotism often assume a pro-military dimension (sometimes purposefully and tactically so), which may be more likely to appeal to Republicans (other polls show they are generally more hawkish than Democrats). Singing “God Bless America” and military flyovers at sporting events also first came into fashion in the years immediately following 9/11, when rallying around the flag coincided with rallying around a Republican president. By contrast, funding AmeriCorps or paying taxes probably aren’t the first things many people think of when they think of patriotism, but lots of Democrats would argue they should be. Even apple pie and baseball aren’t the unifiers they once were: Pumpkin pie beat out apple as Americans’ Thanksgiving dessert of choice in 2015, and football blasphemously beats out baseball as Americans’ favorite sport to watch, 37 percent to 9 percent. In sum, we’re a big country, and there are just as many ways to enjoy America as there are Americans.
Other polling nuggets
A Quinnipiac University poll found that 63 percent of registered voters (84 percent of Democrats and 36 percent of Republicans) agree with the Supreme Court’s 1973 decision in Roe v. Wade, which established a woman’s right to an abortion, while 31 percent disagree.
Quinnipiac also found that 91 percent of registered voters, including large majorities of Democrats and Republicans, think “the lack of civility in politics” is a serious problem. When asked who they blame more, “President Trump or the Democrats,” 85 percent of Democrats said Trump, and 76 percent of Republicans said the Democrats.
According to a SurveyMonkey poll, 62 percent of Americans believe the Senate should vote on President Trump’s nominee to the Supreme Court before the November elections. Sixty percent say the process of confirming nominees has become too partisan.
A YouGov poll found that 46 percent of Democrats support abolishing the federal Immigration and Customs Enforcement agency and replacing it with a different organization — a position that has been advocated by some Democratic lawmakers. Twenty-seven percent of Democrats said they opposed the move, and an additional 27 percent said they weren’t sure.
According to a poll by the Kaiser Family Foundation, 76 percent of Americans said they’re in favor of requiring TV ads for prescription drugs to include a statement about how much they cost, a proposal that is part of the Trump administration’s plan for reducing drug prices.
43 percent of women say they do more than their fair share of house work in their households, according to a YouGov poll. That’s compared with 26 percent of men.
A Pew Research Center poll found that 24 percent of Americans say legal immigration should be decreased. That’s a significant decline since 2001, when 53 percent said so.
A Florida International University poll of 1,000 Puerto Ricans in Florida found that the majority have either a “good” or “very good” opinion of Republican Gov. Rick Scott despite very high levels of disapproval of the president, whom Scott was an early supporter of. People who moved to Florida between 2017 and 2018 were more likely to have a “very good” opinion of Scott than those who arrived earlier. Scott has repeatedly visited Puerto Rico since Hurricane Maria hit the island in September 2017 and campaigned to welcome evacuees from the island.
A Gallup poll found that only 3 percent of India’s population was “thriving”[f00tnote]Gallup groups people into three categories: “thriving,” “struggling” and “suffering” based on their responses to two questions. The first asks people to rate their present life situation on a scale of 1 to 10, and the second asks them to use the same scale to assess their views on the next five years. Those who are categorized as “thriving” rate their present life situation as greater than or equal to 7 and their future as greater than or equal to 8. In 2017, Gallup found that 56 percent of Americans were “thriving.”[/footnote] in 2017. That’s an 11-point decrease from 2014, when 14 percent of the population was “thriving,” despite a 24 percent increase in GDP during that time.
Are you obsessed with polls? Check out FiveThirtyEight’s new polls dashboard, where we’re displaying all in one place the polls we’re collecting for the 2018 U.S. Senate, U.S. House and gubernatorial elections!
Trump approval
Trump’s approval rating is currently 41.9 percent, according to FiveThirtyEight’s tracker. His disapproval rating is 10.8 percentage points higher, at 52.7 percent. Trump’s job-approval numbers have generally held steady over the past month. One month ago today, his approval rating was 41.3 percent, and his disapproval rating was 52.6 percent (a net approval rating of -11.3 points). One week ago, his approval rating was 41.8 percent, and his disapproval rating was 52.3 percent (a net approval rating of -10.5 points).
Generic ballot
This week, Democrats are ahead in polls of the generic congressional ballot by an average of 47.3 percent to 39.6 percent — a 7.7-percentage-point lead, according to FiveThirtyEight’s model. One week ago, Democrats led 47.0 percent to 39.8 percent (a 7.2-point edge). One month ago, it was Democrats 46.3 percent and Republicans 39.9 percent (a 6.4-point edge).
2 notes
·
View notes
Link
via Politics – FiveThirtyEight
Welcome to Pollapalooza, our weekly polling roundup.
Poll of the week
Charlie Baker, Larry Hogan and Phil Scott should get T-shirts made up. In the first quarter of 2018, according to Morning Consult, they were the first-, second- and fourth-most-popular governors in America.1 And that’s despite sharing one surprising commonality: They are Republicans in three of the country’s bluest states. If they were a band, they’d be called Maroon Three — red castaways enisled in a sea of blue.
This week, Morning Consult released their updated ranking of America’s most popular governors, and, like last quarter again, Baker and Hogan topped the list. A full 69 percent of voters in Massachusetts — whose FiveThirtyEight partisan lean2 is 24 points more Democratic-leaning than the nation at large — approved of the job Baker was doing, while only 17 percent disapproved. The story was almost exactly the same in Maryland, another D+24 state: Hogan received a 68 percent approval rating and a 17 percent disapproval rating.
But Scott might get voted off the island. While he had a 65-21 approval-disapproval rating among Vermonters in the first quarter, he has fallen to 47 percent approval, 42 percent disapproval in this week’s findings, tarnishing his both-sides-of-the-street cred. The likeliest reason for the plummet in his popularity is a landmark gun-control law he signed in April amid protests in this historically gun-friendly state.
The new numbers cast doubt on the widely held assumption that Scott will cruise to re-election in 2018. But if he is indeed in danger, it may be in the Aug. 14 GOP primary rather than the general election. That’s because his popularity has eroded dramatically among Vermont’s Republicans, dropping by 26 points since last quarter. According to Morning Consult, Scott amazingly now has a higher approval rating among Democrats (who approve of him 61 percent to 31 percent) than Republicans (who disapprove 56 percent to 41 percent). If he survives his primary challenge from a pro-gun business owner, Scott still starts in a good position to win the votes of the state’s many Democrats.
And he’s not alone in his cross-party appeal. Baker is about equally popular among Democrats (who approve of him 70 percent to 17 percent) and Republicans (who approve 69 percent to 20 percent). Hogan can’t boast the same, but I imagine he’s still pretty happy with his support across the political spectrum: 62 percent of Democrats approve of his performance vs. 23 percent who disapprove. Republicans approve of him 82 percent to 10 percent.
Those numbers sound impressive — and they are — but they’re not as unusual as you might think. Support for governors frequently defies partisanship, at least if you define “partisanship” by people’s presidential preferences. Gubernatorial elections have gotten more nationalized in recent decades, but many voters still see state and federal elections as fundamentally different ballgames. There is basically no correlation between each governor’s net approval rating3 in the latest Morning Consult poll and his or her state’s partisan lean. Some governors are right in line with the partisanship of their states, such as Democratic Gov. Jay Inslee (a +18 net approval rating in D+13 Washington). But others have brands that distinguish them from their parties and make them way more popular (or unpopular) than partisanship alone would predict.
We can quantify each governor’s “Popularity Above Replacement Governor” (or PARG) by measuring the distance between their net approval rating and their state’s partisan lean. By this measurement, Scott is still doing pretty well. He’s 31 points more popular than a generic Republican “should” be in Vermont, good for the seventh-highest score in the country.
Introducing ‘Popularity Above Replacement Governor’
Governors’ net approval rating relative to the partisan lean* of their state
Governor State Name Party Net Approval State Partisan Lean PARG Massachusetts Baker R +52 D+24 +76 Maryland Hogan R +51 D+24 +75 Montana Bullock D +20 R+21 +41 Nevada Sandoval R +37 D+1 +38 New Hampshire Sununu R +39 R+1 +38 Louisiana Edwards D +14 R+22 +36 Vermont P. Scott R +5 D+26 +31 North Carolina Cooper D +22 R+6 +28 Georgia Deal R +31 R+8 +23 Colorado Hickenlooper D +23 D+2 +21 Alabama Ivey R +50 R+29 +21 Virginia Northam D +21 D+2 +19 Texas Abbott R +30 R+13 +17 Florida R. Scott R +19 R+3 +16 Minnesota Dayton D +16 D+1 +15 Delaware Carney D +24 D+11 +13 Mississippi Bryant R +30 R+19 +11 Indiana Holcomb R +29 R+19 +10 Pennsylvania Wolf D +7 R+2 +9 South Dakota Daugaard R +37 R+29 +8 Ohio Kasich R +15 R+8 +7 Washington Inslee D +18 D+13 +5 South Carolina McMaster R +20 R+16 +4 Tennessee Haslam R +30 R+27 +3 Arkansas Hutchinson R +31 R+29 +2 Utah Herbert R +29 R+28 +1 New Jersey Murphy D +11 D+12 -1 Missouri Parson R +18 R+19 -1 Kansas Colyer R +18 R+23 -5 Oregon K. Brown D +3 D+9 -6 Iowa Reynolds R +1 R+8 -7 North Dakota Burgum R +27 R+34 -7 Wisconsin S. Walker R -8 R+1 -9 Arizona Ducey R -2 R+7 -9 Maine LePage R -14 D+4 -10 Nebraska Ricketts R +16 R+27 -11 New York Cuomo D +9 D+21 -12 New Mexico Martinez R -19 D+6 -13 Michigan Snyder R -15 EVEN -15 Wyoming Mead R +32 R+47 -15 Rhode Island Raimondo D -2 D+16 -18 Illinois Rauner R -33 D+14 -19 Idaho Otter R +12 R+34 -22 California J. Brown D +2 D+26 -24 Hawaii Ige D -7 D+32 -39 West Virginia Justice R -4 R+41 -45 Kentucky Bevin R -28 R+31 -59 Connecticut Malloy D -50 D+12 -62 Oklahoma Fallin R -55 R+38 -93
Note: A Democratic governor with a net approval of +2 in an R+7 state has a PARG of +9 (2+7 = 9). If the same state had a Republican governor with the same approval rating, the PARG would be -5 (2-7= -5). Alaska’s Bill Walker was omitted from this list because he’s an independent.
*A state’s partisan lean is the average difference between how the district voted and how the country voted overall in the last two presidential elections, with 2016 weighted 75 percent and 2012 weighted 25 percent.
Sources: Morning Consult, Daily Kos Elections
It’s not surprising that the two governors with the highest PARG are also the two most popular governors overall. Think about it: If a governor appeals only to their own party, there’s a ceiling on how popular they can become. (Even the most lopsided state in the 2016 election, Wyoming, gave only 68 percent of its votes to President Trump.) To break through that barrier, you need to have crossover appeal. When you’re a Republican in a dark-red state, there’s no real incentive to build on that base — you’re going to win your next election anyway. But Republicans in blue states (and Democrats in red states) are forced to win over voters on the other side. Otherwise, they can’t get elected. As long as those voters continue to approve of their actions in office, the sky’s the limit for these governors’ approval ratings.
Other polling nuggets
An NBC News/Marist poll that was making the rounds Wednesday included some stunning numbers from a trio of Midwestern states. When asked whether Trump deserves re-election, Michigan voters said 62 percent to 28 percent that someone else should be given a chance. Minnesota voters agreed 60 percent to 30 percent, as did Wisconsin voters, 63 percent to 31 percent. The problem, though, with these types of polls is that a presidential election is a choice, not a referendum. It’s easy for voters to hear a question like that and measure up Trump against their ideal candidate. But the Democrats’ 2020 nominee won’t be every voter’s ideal candidate, and Trump won’t lose these states by 30-plus points, either.
Americans are split on Trump’s Supreme Court nominee, Brett Kavanaugh. According to a Quinnipiac poll, 40 percent of voters said the Senate should confirm him, while 41 percent said it should not. Eighty percent of Republicans but only 11 percent of Democrats said Kavanaugh should be confirmed.
33 percent of Americans approve of Trump’s handling of his summit with Russian President Vladimir Putin in Helsinki this month, according to an ABC/Washington Post poll; 50 percent disapprove. That’s in line with the Quinnipiac poll, which found 27 percent said the summit was a success, while 52 percent said it was a failure.
33 percent of Americans said they think the FBI is “biased against the Trump administration,” as opposed to “just trying to do their job,” according to a Marist poll. That’s up from 23 percent in February.
A poll from the Pew Research Center found a decline in the FBI’s favorability from 71 percent in September 2016 to 65 percent now. That may not seem like much of a change, but the topline numbers mask a growing partisan divide.
A Monmouth University poll shows that Democrat Conor Lamb has a double-digit lead on Republican Keith Rothfus in Pennsylvania’s 17th District. The district was newly drawn from bits of other districts by the Pennsylvania Supreme Court, making this the only House race that pits incumbents against each other.
A YouGov poll found that 49 percent of Americans said they believe it is either “definitely” or “probably” true that millions of illegal votes were cast in the 2016 presidential election. That includes 42 percent of Democrats as well as 59 percent of Republicans.
In addition to the governors survey, Morning Consult also released job approval numbers for every member of the Senate. Vermont’s Bernie Sanders had the highest approval rating, while Kentucky’s Mitch McConnell had the highest disapproval rating.
70 percent of Americans said in a YouGov poll that, of the five senses, they would miss sight the most if they lost it; 7 percent said they would miss hearing the most, 5 percent said taste, 3 percent said touch, and 2 percent said smell.
48 percent of registered voters said in a Morning Consult poll that the label “milk” should not be used to market non-dairy beverages; 23 percent said the label should be used. That comes after the head of the FDA suggested last week that non-dairy products may not meet the FDA’s official definition of milk, noting that “an almond doesn’t lactate.”
Trump approval
This week, Trump’s net approval rating sits at -11.7 percentage points, according to our tracker: 41.3 percent approve of his job performance and 53 percent disapprove. Last week, the spread was a bit smaller, at -11.0 points (a 41.8 percent approval rating compared with a 52.8 percent disapproval rating). He was slightly more popular a month ago, when his net approval rating was -9.5 points. Back then, 42.2 percent approved and 51.7 percent disapproved of his performance.
Generic ballot
According to FiveThirtyEight’s model of generic congressional ballot polling, 48.1 percent of voters prefer Democrats and 39.9 percent prefer Republicans. That 8.2-point margin has reverted to the mean a bit from Democrats’ unusually wide 9.3-point lead (Democrats 48.7 percent, Republicans 39.4 percent) last week, but it’s definitely much better for them than the 5.7-point lead (Democrats 46.4 percent, Republicans 40.7 percent) they held this time last month.
Check out all the polls we’ve been collecting ahead of the 2018 midterms.
1 note
·
View note
Link
via Politics – FiveThirtyEight
Welcome to Pollapalooza, our weekly polling roundup.
Poll of the week
Donald Trump has been unhappy with NATO for years. Even before he won the Republican presidential nomination in 2016, he complained that other member countries weren’t “paying their fair share” and that the military alliance, formed in 1949 to counteract the influence of the Soviet Union, was “obsolete.”
This week, at the NATO summit in Brussels, now-President Trump sparred with the NATO secretary general and demanded that other member countries more than double their defense spending (they ultimately agreed only to continue to try to reach the existing financial targets).
Trump was echoing the sentiments of the 25 percent of U.S. adults who, according to a YouGov poll conducted this week, hold an unfavorable view of NATO. That includes 15 percent who see the alliance “somewhat” unfavorably and 10 percent who see it “very” unfavorably. By contrast, 24 percent of Americans give NATO somewhat favorable ratings, and 20 percent give it very favorable ratings, for a total favorability score of 44 percent.
Like so much else these days, NATO has become a partisan issue. Democrats told YouGov that they view NATO favorably by an overwhelming 55-point margin (64 percent to 9 percent), but among Republicans, unfavorable opinions of NATO win out by an 8-point margin: 45 percent to 37 percent. Among Trump voters, 54 percent view NATO unfavorably, while just 33 percent view it favorably.
Republicans have long been more skeptical of multilateralism and international organizations than Democrats; that’s reflected in the large gap between the opinions of Democrats and Republicans on the United Nations. Partisans’ views on NATO may also shift around in response to specific events. For example, according to the Pew Research Center, Republican support for NATO fell sharply in 2013, a year after the attack on U.S. government buildings in Benghazi, Libya. Republicans’ anger at the Obama administration over Benghazi may have spilled over into animosity for NATO, through which the U.S. first intervened in Libya in 2011. And Democratic support for NATO shot up in 2017, after several months of news reports and punditry about Russian interference in the U.S. presidential election to assist GOP candidate Trump.
Almost eight-in-ten Democrats approved of NATO in 2017 – a 20-point increase from the 58% who approved in 2016. In contrast, just 47% of Republicans felt the same. https://t.co/Wj5gEfilu0 pic.twitter.com/CqbXo3XVCR
— Pew Research Fact Tank (@FactTank) July 11, 2018
Republicans who continue to think poorly of NATO may not just be following Trump’s cue. Indeed, previous polling suggests the opposite: Trump may be the one responding to an existing undercurrent of discontent over NATO among Republicans. YouGov has asked Americans about their feelings on NATO since before the 2016 election. In March 2016, 40 percent of Republicans had unfavorable views of NATO, compared with 38 percent who had favorable views. Among Democrats, 49 percent had favorable views, while only 15 percent had unfavorable ones. Likewise, Pew consistently found in surveys from 2009 to 2017 that more Democrats than Republicans held favorable views of NATO.
But while Republicans’ overall attitude toward NATO hasn’t changed, perhaps Trump is inspiring them to finally want to do something about it. Since 2016, YouGov has also asked American adults whether it’s time for the U.S. to withdraw from NATO or remain in the alliance. And over the past two years, there has been an uptick in the share of Republicans who support withdrawal.
In March 2016, Republicans wanted to remain in NATO 48 percent to 17 percent. But in this week’s YouGov poll, Republicans were deadlocked on the question, 38 percent to 38 percent.
At one point in U.S. history, almost no one thought poorly of NATO. The earliest poll we could find testing NATO’s popularity was a National Opinion Research Center survey from 1956, seven years after NATO’s founding. That year, 82 percent of respondents said NATO was a good idea, compared with just 8 percent who said it was a bad one. For the nation’s bicentennial in 1976, the Roper Organization asked whether the U.S. did the right thing in helping form and joining NATO; 55 percent said it was the right thing, and just 9 percent said it was the wrong thing.1 Support began to slip in the 1990s: In 1994, 60 percent of Americans said NATO should be maintained, while 27 percent said it was no longer necessary. Support for NATO has hovered in that general range ever since (with a brief spike in support amid NATO’s bombing campaign in Yugoslavia in 1999).
The U.S. isn’t the only country where NATO is a political football. Two of Germany’s major populist parties, Alternative for Germany on the right and The Left on, well, the left, are generally anti-NATO, and Jeremy Corbyn, leader of the U.K.’s Labour Party, once said that the organization should be disbanded. In fact, the U.S. was right around the median country in terms of overall NATO support, according to a 2017 Pew survey of the U.S. and 11 other NATO member countries. It found the alliance’s net favorability rating (total favorable rating minus total unfavorable rating) in the U.S. to be quite close to what it was in the U.K. and Germany. Poland was the most pro-NATO country, while Turkey was the most skeptical.
Other polling nuggets
According to a Rasmussen Reports poll, 83 percent of likely voters think the Senate is likely to confirm Brett Kavanaugh to the Supreme Court, while 44 percent believe the federal appeals court judge, whose nomination was announced by Trump on Monday, should be confirmed. Democrats oppose the nomination (63 percent to 16 percent) more than they opposed the nomination of Neil Gorsuch, Trump’s first Supreme Court pick, in a Rasmussen poll conducted in the week after Gorsuch was nominated (48 percent to 32 percent).
Two polls about ice cream are in agreement that Americans’ favorite flavor is chocolate, followed by vanilla and butter pecan. Butter pecan was most popular among the oldest age group in both surveys. We, however, are hip with the youths who prefer cookies and cream.
The Trump administration said it will reverse a policy put in place by the Obama administration that encouraged colleges to consider race as a factor in admissions to diversify student bodies. Seventy-one percent of registered voters said universities should not consider race when determining which applicants to admit, according to a Morning Consult poll. That might make affirmative action seem really unpopular, but, reader, beware! Polling around affirmative action can vary based on how a question is asked. For example, Gallup found in 2014 that 58 percent of Americans reported being in favor of “affirmative action programs for racial minorities,” but 67 percent favored college admissions based solely on merit (without consideration of someone’s race or ethnicity).
According to a Pew Research Center survey about activism and social media, 80 percent of black Americans said social media highlights issues that might not otherwise get a lot of attention; 62 percent of white Americans agreed. Conversely, 80 percent of white Americans said social media distracts people from issues “that are truly important,” while 66 percent of black Americans agreed.
42 percent of Americans report being better off financially than they were two years ago, according to an Emerson College poll. President Trump tweeted about the poll, saying that “most Americans, especially Hispanics, feel that they are better off under President Trump than they were under President Obama.” In an article, the Boston Globe noted that the president’s facts “weren’t quite right.” The survey question specifically asked if people were better off financially (which Trump failed to note), the question did not make any mention of Obama, and it was a plurality, not a majority, of voters who said they were better off now than two years ago. Sixty-two percent of Hispanics did, however, report being better off financially.
A YouGov poll found that 73 percent of Republicans want Trump to run for re-election in 2020. That’s up since August of last year, when 65 percent wanted him to run.
71 percent of Americans say they make an effort to buy products that are made in the U.S., according to a poll by SSRS.
According to a Gallup poll, Americans have varying opinions on the trade policies that other nations have with the United States. Sixty-five percent say Canada’s trade policy is fair, 56 percent say the European Union’s is fair, and 30 percent say China’s is fair.
Trump approval
According to our model, Trump’s approval rating is 42.3 percent, and his disapproval rating is 52.7 percent, for a net approval rating of -10.4 percentage points. That’s similar to his -10.7-point net approval rating from one week ago, when his approval rating was 42.2 percent and his disapproval rating was 52.9 percent. It’s also not too different from his -11.1-point net approval from this time last month. On June 13, his approval rating was 41.4 percent, and his disapproval rating was at 52.5 percent.
Generic ballot
Democrats currently lead the race for Congress 47.9 percent to 39.5 percent, according to our tracker. That’s an advantage of 8.4 percentage points. This time last week, Democrats were ahead by 8.3 points. One month ago today, Democrats held a 7.8-point advantage.
1 note
·
View note
Link
via Politics – FiveThirtyEight
Welcome to FiveThirtyEight’s weekly politics chat. The transcript below has been lightly edited.
sarahf (Sarah Frostenson, politics editor): Last week, U.S. officials announced that President Trump had authorized a drone strike that killed one of Iran’s most powerful military leaders, Qassem Soleimani. The move took many by surprise, including some within Trump’s own administration, and now the U.S. is bracing for retaliation from Iran and an escalation of conflict in the region. More than 3,000 U.S. soldiers have already been deployed. And early Wednesday, Iran launched more than a dozen ballistic missiles targeting two U.S. military bases in Iraq.
Let’s first unpack what we understand Trump’s Iran strategy to be and the risks and challenges there. (How does it play with Republicans? His base? Can we expect this to be a unifying moment where Americans “rally around the flag” and his approval rating goes up?) Then, let’s turn to how this conflict could potentially change the dynamics of the Democratic primary.
OK, Trump’s Iran strategy. What do we know at this point?
perry (Perry Bacon Jr., senior writer): In terms of Trump’s Iran POLICY strategy, I’m not sure how much we know. We know his administration feels like it needs to get tough with Iran. And we know that any action by the Iranians in retaliation is likely to get a very aggressive response from the United States. (See Trump’s remark about identifying 52 sites in Iran to attack, including some of cultural significance.)
So his political strategy seems to imply that anyone who disagrees with killing Soleimani doesn’t care about defending U.S. troops and interests, which is not unlike how the Bush administration defended their policies in the Middle East in the early 2000s.
clare.malone (Clare Malone, senior political writer): Trump’s Iran strategy is also one that is largely tinged by domestic politics. What I mean by that is that Trump made a really drastic decision when he decided to green-light Soleimani’s assassination, something Democratic and Republican presidents had chosen not to do for years. And if you go to the reasoning of “why?” I think you come out with the educated guess that Trump wanted to look decisive in the face of a real threat from an enemy. But the decision was a pretty extreme one that doesn’t necessarily have the interests of the stability of the region at its heart. It might have the interests of regime change at heart, but that is, of course, a controversial point of action, one that more hawkish Republicans (a la former National Security Advisor John Bolton) have tended to favor.
sarahf: And at this point, how have Republicans responded? Republicans in Congress largely seem to support Trump’s decision, right?
clare.malone: Well, even some Never Trumpers like it! It’s the return of the neo-conservative (early aughts, much?)
nrakich (Nathaniel Rakich, elections analyst): According to a HuffPost/YouGov poll conducted immediately after the attack, 84 percent of Republicans approved of the airstrike. Of course, 84 percent of Republicans would probably agree with anything Trump does — and on foreign policy especially, the political science literature argues that people form their opinions based on elite cues (specifically, the elites they already are inclined or disinclined to like).
clare.malone: But I think one thing that will probably bother Democrats and Republicans alike is the outpouring of nationalism and grief for Soleimani this week in Iran. That’s perhaps something the Trump administration didn’t anticipate.
sarahf: It is interesting, too, when you consider how much Trump criticized the Iraq War, even going as far as to attack George W. Bush during the 2016 campaign, and how he promised to prevent the U.S. from getting further entangled in conflicts abroad. And when you look at some of the Republicans who make up his base, there is evidence that these voters are a bit less hawkish or more isolationist than other Republicans. A Pew Research Center poll conducted during the 2016 Republican primary found, for instance, that Trump supporters were more likely than other GOP voters to say that “the U.S. does too much to solve world problems.” So that does make me wonder how this recent military action reconciles with his base. Do we have a sense yet of just how supportive the broader American public would be of a war with Iran?
clare.malone: I think this is the most interesting question at hand. I’m not sure that the “rally around the flag” effect that we’ve seen with actions like, say, invading Iraq in 2003, will hold in our age of extreme partisanship.
nrakich: Yeah, Sarah, there is a tension there. Some political science research has also found that the American public knows more about foreign policy, and holds more consistent (if broad) views on it, than it typically gets credit for. But I personally tend toward the hypothesis that voters will change their views on foreign policy to match the politicians they support on domestic issues.
clare.malone: You’re already seeing the partisan dividing lines; all the Democratic presidential candidates condemning the attacks; Republicans calling Democrats unpatriotic, a la former U.S. Ambassador to the United Nations Nikki Haley:
“The only ones mourning the loss of Soleimani are our Democrat leadership and Democrat Presidential candidates.” pic.twitter.com/IZJJqpxkBE
— Nikki Haley (@NikkiHaley) January 7, 2020
sarahf: This chart is from a story that our colleague Dhrumil Mehta wrote in September, but what stood out to me was that Americans seem more willing to support military action in Iran than anywhere else.
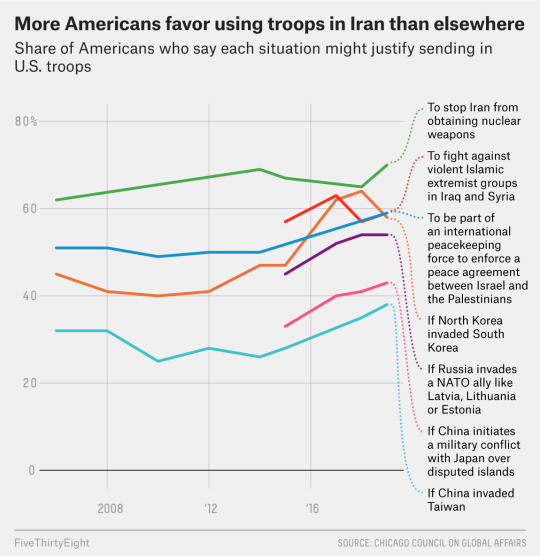
This is especially true if Iran’s nuclear capabilities are perceived as a threat. According to a Chicago Council on Global Affairs survey conducted in June, 70 percent of respondents, including 82 percent of Republicans and 66 percent of Democrats, said they support sending U.S. troops to Iran to stop them from obtaining nuclear weapons.
nrakich: Yeah, Sarah, a lot of the polling we have on Iran is based on the premise of stopping Iran’s nuclear program, which wasn’t the reasoning behind the Soleimani attack. So we need more polling to really understand where Americans stand, as polling on Iran is somewhat difficult to interpret.
For example, in July, Gallup found that only 18 percent of Americans wanted to take military action against Iran, and 78 percent preferred diplomatic efforts. But 42 percent of that latter group said that the U.S. should take military action if diplomatic efforts fail.
perry: “War with Iran” tends to imply the deployment of tens of thousands of U.S. troops and a declaration of war from Congress. And if that is actually proposed, I think it will be fairly unpopular — regardless of whatever the polls say right now. The Trump administration is even saying this attack will not lead to a full-blown war (they may be wrong, but it still speaks to what they perceive as the political realities).
We know Americans don’t want another protracted conflict in the Middle East. Unless there is an attack on American soil by Iran — then the dynamics are different.
clare.malone: Yeah, I’m with Perry. The last two decades of American political life have been dominated by foreign intervention. Of course, the Quds force that Soleimani ran specializes in supporting more agile attacks on countries, aka terrorist attacks. And if a terrorist attack were to happen, especially on American soil, that could really shake up an election.
You’ve only got to look back at the 2016 primary to see an example of that. After the San Bernardino attack, Trump called for his “Muslim ban,” and I think more people may have found that palatable in part because there had just been an ISIS-inspired massacre in California. People are more likely to want punitive action when they are frightened and angry.
nrakich: I will be interested to see, though, if people (voters, the media, politicians — especially those who oppose Trump) start off skeptical of the administration’s intel on Iran and its decision to attack. It would make for quite a contrast with the Bush administration’s line about weapons of mass destruction, which the public initially accepted as a good reason to go to war in Iraq. This time around, though, Democrats don’t appear to be giving the Trump administration the benefit of the doubt on its assertion that attacks from Iran were “imminent.”
sarahf: So it sounds as if Trump’s calculus for handling the situation with Iran is that there has to be a perceived threat to the U.S. Otherwise, he risks entangling the U.S. in another drawn-out conflict in the Middle East, which, as Perry said, probably doesn’t have that much built-in support. Does that seem accurate? And if there is indeed evidence of a real threat, does that do well for him politically?
clare.malone: Sure, fear is the great motivator. But I also think that if it’s too obvious that they’re coming up with retroactive reasoning for an attack, that won’t pass the smell test with voters.
The interesting thing with Trump is that he hasn’t faced a whole lot of external crisis situations; often he is the maker of his own crisis.
perry: Trump can do a lot in Iran — as long as it’s not a “war” with the deployment of lots of U.S. troops.
sarahf: And considering Trump is not highly rated on his ability to respond in an international crisis to begin with, the situation in Iran could have a large upside for him, if it’s handled well.
perry: I don’t think there is an upside here for him. I tend to think that Fox News’s Tucker Carlson (who has been critical of the attack on Soleimani) is right. In my view, Trump won GOP voters in the primary and swing voters in the general who were wary of Bush-style Republicanism, which, of course, is tied to the Iraq War. Trump is better off talking about the economy.
Although, perhaps there is less downside for him focusing on Iran, as opposed to issues like repealing Obamacare or tweeting mean things about members of Congress.
sarahf: That’s interesting, Perry. It just seems like a step so extreme that one would think Trump has a greater Iran strategy at play. Although, there has been speculation that this might be a diversion to everything happening with impeachment. Which, whoa, if true. But let’s say this situation with Iran does continue to dominate headlines — how does this shake up the 2020 primary? As we’ve noted, Democratic candidates have been universally critical of Trump’s decision, so far. Does that change? Or what kind of positioning do we expect to see from the candidates? Does anyone aside from Biden, given his experience as Obama’s VP, stand to benefit?
clare.malone: I mean, I think Pete Buttigieg is trying to use this new dynamic as a way to play up his military service. But I’m not sure that’s going to track with voters, who still know he’s relatively inexperienced, compared to the rest of the top of the field. Bernie Sanders is certainly seeing his opening to point out that Biden was a proponent of the Iraq invasion in the early 2000s:
Presidential candidate @BernieSanders hammers Joe Biden for his Iraq War, NAFTA votes.
“I just don’t think that that kind of record is going to bring forth the kind energy we need to defeat Trump.” pic.twitter.com/3JIIVCNE48
— Anderson Cooper 360° (@AC360) January 7, 2020
perry: So on the Democratic side, this is interesting. Many of the debates and the broader discussion of the primary are framed around, “Do you prioritize bold change or winning the election?” And that framing helps Biden. I’m not sure what the Medicare for All equivalent (bold policy that can be painted as electorally risky) is for Iran. The issue just doesn’t have the same dynamics. So this could be an issue where the non-Biden candidates can make arguments without being trapped in a dilemma over how their stances poll.
Sanders has really leaned into this issue by connecting it to his broader opposition to the Iraq War, as well as his view that the U.S. should be less eager to intervene abroad. Biden, by contrast, has struggled to reconcile his vote in support of the Iraq War. A voter in Iowa asked him about it on Saturday — and he said he opposed the war from the beginning, which is not accurate.
clare.malone: Yeah, that was a weird moment.
perry: So because the foreign policy lines are less clear, I think it’s an opportunity for the non-Biden candidates to challenge him in a fresh way. And it’s harder to imagine that Biden’s Iraq vote won’t come up in next week’s debate.
clare.malone: I think that there is definitely potential upside for Sanders: He can point out that he’s principled and anti-war, which the progressive base will like, but he has also pointed out that his policy stance of getting out of the Middle East is exactly what Trump promised. So, in some ways, he’s trying to showcase what he thinks is his general election advantage: a different kind of (populist or outsider) appeal to Trump voters.
nrakich: Yeah, I wonder how big of a role Biden’s Iraq vote will play. I feel like other candidates are seizing on it out of necessity — since otherwise, foreign policy is an issue where voters give Biden a big advantage:
Biden has maintained a large lead in primary polling on the best candidate to handle foreign policy (48% to 14% Bernie):https://t.co/o9lGd8jiGe
It has not been the most important issue for many Dem voters thus far, but foreign policy crisis could increase its salience pic.twitter.com/ez90wUwil8
— Matt Grossmann (@MattGrossmann) January 3, 2020
perry: Whatever the electoral effects, I also basically agree with what Rep. Alexandria Ocasio-Cortez said yesterday. This conversation around Iran solidifies the idea that she (and Sanders) would be in a different party than Biden if we had a multi-party system. Biden and Sanders have really different perspectives on foreign policy — with the latter perhaps being the most serious anti-war presidential candidate in decades.
clare.malone: Yeah, and the fact that it’s not entirely crazy that a major party candidate could have an anti-war stance says a lot about how conflicts in the Middle East have shaped the American psyche over the past couple of decades.
sarahf: Is this what the conversation will center on among Democrats next Tuesday during the debate, Perry? If the conversation has less to do with Trump’s actions and more about Sanders’s anti-war stance in comparison to Biden, I wonder how that plays with voters.
perry: Voters don’t really know much about policy, and generally, the differences between candidates in the same party are hard for them to understand. That said, someone will be declared to have “won” the debate on Tuesday — and that kind of coverage can matter. The press is already covering Sanders like he’s surging. So a debate in which Iraq comes up a fair amount is one that may play to Sanders’s advantage. And it may be a disadvantage for Biden — especially if he gets flustered and is unable to just concede that he voted for the Iraq War.
But if the moderators and/or Biden turn the Iran questions into basically, “Do you trust Trump on foreign policy?” then yes, that’s less useful for other candidates.
sarahf:

At this point, it seems as if Americans’ feelings around heightened escalation with Iran are a bit of a black box. They’re unsure whether they approve of the drone strike. And their opinions on whether to intervene in Iran are largely tied to whether they perceive Iran as a nuclear threat, although that may change if Iran continues to be hostile to the U.S. So what will you be looking for as an indication that the situation with Iran has escalated to the point that it could have a real effect in 2020?
clare.malone: I think a lot of public opinion depends on how Iran chooses to respond to the assassination. There are many potential unknowns for how they’ll continue to retaliate, but definitely a few ways that would anger the American public enough to shuffle some dynamics in the presidential campaign.
nrakich: I think whether this stays in the news for a while or whether other stories (e.g., impeachment) overtake it will be something to watch — as will be whether the Democratic candidates continue to draw a sharp contrast with Trump on the issue. According to political science research, those are two of the rare circumstances when foreign policy actually matters in elections. And obviously, I’ll be watching for any changes in Trump’s approval rating, too.
1 note
·
View note
Link
via Politics – FiveThirtyEight
UPDATED DEC. 13, 2019 AT 11:50 AM
Latest PollsUpdated throughout the day.
POLL TYPE
All pollsPresidential approvalGeneric ballotPresident: general electionU.S. SenatePresident: Democratic primaryU.S. HouseGovernorPresident: Republican primary
STATE
All National Alabama Alaska Arizona Arkansas California Colorado Connecticut Delaware District of Columbia Florida Georgia Hawaii Idaho Illinois Indiana Iowa Kansas Kentucky Louisiana Maine Maryland Massachusetts Michigan Minnesota Mississippi Missouri Montana Nebraska Nevada New Hampshire New Jersey New Mexico New York North Carolina North Dakota Ohio Oklahoma Oregon Pennsylvania Rhode Island South Carolina South Dakota Tennessee Texas Utah Vermont Virginia Washington West Virginia Wisconsin Wyoming
DISTRICT
All Who’s ahead in the national polls?
Updating average for each Democratic candidate in 2020 primary polls, accounting for each poll’s quality, sample size and recency
APRIL 2019MAYJUNEJULYAUG.SEPT.OCT.NOV.DEC.01020304050%DEC. 13 LEADERDEC. 13 LEADERBidenBiden26.2%BidenWarrenSandersButtigieg
Average as of Dec. 13
ACTIVE CANDIDATES
Biden26.2%
Sanders17.0%
Warren14.9%
Buttigieg9.6%
Bloomberg4.7%
Yang3.4%
Klobuchar2.2%
Booker1.7%
Steyer1.4%
Gabbard1.4%
Castro1.0%
Patrick0.6%
Bennet0.6%
Delaney0.5%
Williamson0.5%
DROPOUTS
Bullock—
de Blasio—
Gillibrand—
Gravel—
Harris—
Hickenlooper—
Inslee—
Moulton—
O’Rourke—
Ryan—
Sestak—
Swalwell—
Our average includes all candidates that FiveThirtyEight considers “major.” Candidates with insufficient polling data are not displayed in the averages. State polling averages are adjusted based on national trends, which means candidates’ averages can shift even in the absence of fresh state polls. Read more about the methodology.
FILTER BY POLLSTER GRADE
A+BCDAdded Dec. 11, 2019
DATES POLLSTER SAMPLE RESULT NET RESULT President: Democratic primary DEC 7-10, 2019 B-YouGov 497 LV Biden 26% More Biden +5 President: Democratic primary NOV 25-DEC 1, 2019 David Binder Research 1,200 LV Biden 29% More Biden +14
KEY
A = ADULTS
RV = REGISTERED VOTERS
V = VOTERS
LV = LIKELY VOTERS
Dec. 10, 2019
President: Democratic primary DEC 4-9, 2019 B+Quinnipiac University 665 RV Biden 29% More Biden +12 President: Democratic primary DEC 4-8, 2019 A+Monmouth University 384 RV Biden 26% More Biden +5
Dec. 9, 2019
President: Democratic primary DEC 2-8, 2019 B/CMorning Consult 15,442 LV Biden 30% More Biden +8 President: Democratic primary NOV 27-29, 2019 C+Harris Poll 756 RV H. Clinton 21% More H. Clinton +1 President: Democratic primary NOV 15-21, 2019 B/CRealClear Opinion Research 987 LV Biden 30% More Biden +7
Dec. 6, 2019
President: Democratic primary NOV 27-29, 2019 C+Harris Poll 756 RV Biden 29% More Biden +13
Dec. 5, 2019
President: Democratic primary DEC 4-5, 2019 B-Ipsos 719 A Biden 19% More Biden +5
Show more polls
Polls conducted after June 28, 2018, the date this page was published, are listed by the date that FiveThirtyEight collected them; polls conducted before then are listed under the last date that the poll was in the field. Polls from firms that are banned by FiveThirtyEight are not shown. Pollsters that did not release any horse-race polls within three weeks of an election since 1998 do not have a grade and are treated as a C+ by the grade filter.
* Polls marked with an asterisk are partisan polls. Partisanship is determined by who sponsors the poll, rather than who conducts it. Polls are considered partisan if they’re conducted on behalf of a candidate, party, campaign committee, or PAC, super PAC, 501(c)(4), 501(c)(5) or 501(c)(6) organization that conducts a large majority of its political activity on behalf of one political party.
Notice any bugs or missing polls? Send us an email.
Download this data: presidential primary polls, presidential general election polls, Senate polls, House polls, gubernatorial polls, presidential approval polls, generic congressional ballot polls
Design and development by Aaron Bycoffe, Ritchie King, Ella Koeze, Dhrumil Mehta, Jasmine Mithani and Julia Wolfe. Andrea Jones-Rooy, Dhrumil Mehta, Nathaniel Rakich, Derek Shan and Julia Wolfe contributed research.
MORE POLITICS
UPDATED 10 MINUTES AGO
How Popular Is Donald Trump?
UPDATED 22 HOURS AGO
How Often Do Members Of Congress Vote With Trump?
UPDATED 1 DAY AGO
Who Is Winning The Race For Congress?
UPDATED 1 DAY AGO
The 2020 Endorsement Primary
UPDATED NOV. 5, 2019
Pollster Ratings
RELATED STORIES
What Makes Our New 2020 Democratic Primary Polling Averages DifferentThe Democratic Presidential Candidates Are Becoming Less PopularSeven Candidates Have Qualified For The December Democratic DebateWhich Senators Are Likely To Vote For Trump’s Removal?Why It’s Tougher To Qualify For The December Democratic Debate
COMMENTS
Get more FiveThirtyEight
Newsletter
Videos
Podcasts
Twitter
Facebook
Data
RSS
Contact
Jobs
Masthead
About Nielsen Measurement
Terms of Use
Privacy Policy
Your California Privacy Rights
Children’s Online Privacy Policy
Interest-Based Ads
© 2018 ABC News Internet Ventures. All rights reserved.
1 note
·
View note
Link
via Politics – FiveThirtyEight
Rather than dominating the news cycle, former Senate staffer Tara Reade’s recent allegation that former Vice President Joe Biden sexually assaulted her has been slow to receive coverage in many outlets.
Reade first stepped forward in spring 2019 as one of several women who accused Biden of inappropriate touching, but it wasn’t until March 25, 2020, that Reade alleged Biden had sexually assaulted her while she was a staffer in his office in 1993. In a podcast interview with left-leaning commentator Katie Halper, Reade accused Biden of pushing her against a wall, reaching under her skirt and penetrating her with his fingers. (While some of Reade’s family and friends say Reade told them about the incident shortly thereafter, other Biden staffers at the time do not recall hearing about it, and Biden has denied that it ever took place.) But the story wasn’t really featured in the mainstream media until after April 12, when The New York Times published an in-depth investigation of Reade’s claims.
Since then, the accusation has gotten more attention, starting on April 24, when a “Larry King Live” clip from 1993 emerged in which a caller who may be Reade’s mother describes her daughter’s “problems” with a “prominent senator.” Coverage continued to climb after April 27, when Reade’s former neighbor said that Reade had told her details about the alleged assault in the mid-1990s, and May 1, when Biden himself made his first public comment on the allegation. Nevertheless, our analysis of closed captioning data for Fox News, MSNBC and CNN, pulled from the TV News Archive,1 and of online news articles from the Media Cloud database2 finds that the volume of coverage of the allegation remained low until very recently, and it has gotten more attention from right-leaning outlets, both on television and online.
Of the three major cable news channels, Fox News has devoted the most attention to Reade so far.3 Through Friday, May 1, Fox News mentioned Reade in 371 clips collected by the TV News Archive — 344 of them on or after April 24. Many of these mentions were by the channel’s conservative commentators criticizing Democrats and the media for not giving Reade’s allegation more air time.
By contrast, CNN and MSNBC mostly covered the story with on-air interviews of reporters who had investigated the allegation — but these channels also covered Reade much less. Through May 1, CNN had only mentioned Reade in 35 clips, the first of which aired on April 25. And MSNBC barely mentioned her until last Friday, when Biden personally appeared on the network to deny Reade’s claims. (According to what Reade has told The New York Times, neither CNN nor MSNBC has asked to interview her on air, though they have spoken to her off camera.)
But while cable news didn’t mention Reade at all when the sexual assault allegation was first revealed, online news outlets did. After the story broke on March 25, conservative news organizations like The Blaze and the Daily Caller picked it up right away. But while right-leaning outlets covered the story most heavily, HuffPost, Vox and The Guardian also wrote about the allegations in March. The Guardian and Vox even noted then how the story wasn’t yet appearing in mainstream news outlets. Fox News, which hadn’t yet mentioned Reade on TV, also published an article online about the allegations on March 27. Starting in April, mainstream media coverage of the allegation began to pick up, but the volume of coverage mentioning Reade has still increased the most in conservative-leaning online media, which sometimes published multiple articles a day on the story.4
At first, though, the headlines about the allegation were similar regardless of the outlet’s ideological bent — compare Breitbart’s “Joe Biden Faces New Sexual Assault Allegation from Former Staffer” to HuffPost’s “Joe Biden Accused Of Sexually Assaulting Senate Aide In 1993,” for example. But if you were looking for articles about the story’s day-to-day developments, such as the emergence of the “Larry King Live” clip, conservative outlets were generally the place to look (although the King clip was originally reported by The Intercept, which is regarded as left-leaning). And after The New York Times’s investigation into Reade’s claims, many conservative outlets also criticized its handling of the story, which evolved into articles about the lack of mainstream media coverage of the allegation.
Once the Times published its investigation in mid-April, other mainstream news organizations began covering the story as well. Some, like Time and Reuters, devoted entire articles to the allegation, but for others, like The Atlantic and Politico, early mentions of Reade appeared in articles that did not focus on her. And others, like CNN and CBS News, mentioned Reade’s allegation not as a straightforward breaking news story but in the context of how other Democrats were reacting. In general, the mainstream media was less likely than conservative outlets to publish follow-up stories containing new developments in the allegation, although that began to change last week as some mainstream outlets joined conservative ones in questioning Biden’s silence on the allegation, which may have led to his appearance on MSNBC on Friday.
Of course, one thing this data can’t tell us is how much coverage the allegation should be receiving; there is no “correct” answer. It could be, as some have argued, that mainstream media outlets have a liberal bias and are avoiding the story for that reason — or it could be that conservative media outlets are simply likelier to run with a story that makes a Democrat look bad. It’s also possible that mainstream outlets investigated the claims and felt that the supporting evidence they were able to find was not enough for them to publish the story.
It’s also difficult to compare coverage of these sexual assault allegations with coverage of the allegations made against President Trump, Supreme Court Justice Brett Kavanaugh or other politicians who have faced similar scandals. Any number of factors — such as the prominence of the person being accused, the seriousness of the allegations and the number of accusers — can influence the amount of media coverage a sexual assault allegation receives, and Biden’s situation is not necessarily a close match along all of these dimensions. (Most obviously, the only other politician of similar prominence to face sexual assault allegations recently — Trump — faced several of them, and also was infamously caught on video bragging about his sexual pursuits.)
And perhaps the biggest confounder is the news environment in which this story has arisen. The coronavirus pandemic is currently sucking up so much of the media oxygen that it is unlikely that any political story would be covered as thoroughly as it would be in normal times. So while it seems clear that coverage of Reade’s allegation has so far been limited, it’s hard to pinpoint exactly why that is.
0 notes
Link
via Politics – FiveThirtyEight
Whether it’s a groundbreaking experiment of conservative or liberal thought or “merely” tending to the bread-and-butter issues that touch residents’ lives, the states are where the policymaking magic happens. And because of the different roles played by the state and federal governments, what’s happening in the states can vary pretty substantially from what’s being discussed on the national level. So we decided to burst out of the bubble of the national 2020 campaign and take a look at what state leaders were talking about.
At the beginning of the year, each governor lays out their policy priorities in their version of the State of the Union address — a “state of the state” address.1 We conducted a text analysis of all 50 governors’ 2019 state of the state speeches to see what issues were talked about the most and whether there were differences between what Democratic and Republican governors were focusing on. Specifically, we broke down the speeches into one-, two- and three-word phrases (like “school” or the “Affordable Care Act”)2 and divided the most commonly used ones into thematic buckets.
We found that the three most dominant issues were education, health care and the economy — although Democratic and Republican governors didn’t always approach them in the same way. There were also interesting partisan differences in how governors talked about some other issues, including the environment, crime and justice, and mental health.
Education
The words “education” and “school” appeared in all 23 Democratic speeches and all 27 Republican ones. But that doesn’t mean the two parties talked about education in the same way. To suss out those differences, we ran a statistical analysis3 to determine how significantly terms were associated with speeches from Democratic or Republican governors. And as you can see in the table below, some terms (e.g., “child care,” “kindergarten”) were more likely to be used in Democratic speeches, while others (e.g., “foster care,” “education workforce”) were more likely to be used in Republican speeches.
The partisan (and not so partisan) rhetoric on education
One-, two- and three-word phrases about education that appeared in governors’ 2019 state of the state speeches, by how often a phrase was used by Democratic and Republican governors
SHARE THAT INCLUDE PHRASE Phrase▲▼
P-VALUE*▲▼
Dem. speeches▲▼
Rep. speeches▲▼
Diff▲▼
child care 0.02 39.1% 7.4% D+31.7 education need 0.00 30.4 0.0 D+30.4 kindergarten 0.07 47.8 18.5 D+29.3 early childhood 0.06 43.5 14.8 D+28.7 educational 0.12 21.7 48.2 R+26.4 students state 0.01 26.1 0.0 D+26.1 scholarships 0.10 13.0 37.0 R+24.0 graduate 0.22 56.5 33.3 D+23.2 learning 0.27 43.5 66.7 R+23.2 educators deserve 0.02 21.7 0.0 D+21.7 foster care 0.10 8.7 29.6 R+20.9 quality education 0.10 8.7 29.6 R+20.9 school district 0.10 8.7 29.6 R+20.9 graduates 0.19 17.4 37.0 R+19.7 teacher pay 0.19 17.4 37.0 R+19.7 early childhood education 0.13 30.4 11.1 D+19.3 graduation 0.24 21.7 40.7 R+19.0 education workforce 0.04 0.0 18.5 R+18.5 college tuition 0.07 21.7 3.7 D+18.0 schools year 0.07 21.7 3.7 D+18.0 special education 0.07 21.7 3.7 D+18.0 tuition 0.29 43.5 25.9 D+17.6 scholarship 0.27 17.4 33.3 R+15.9 teacher 0.51 52.2 66.7 R+14.5 best brightest 0.15 4.4 18.5 R+14.2 year degree 0.13 17.4 3.7 D+13.7 training programs 0.13 17.4 3.7 D+13.7 children future 0.13 17.4 3.7 D+13.7 community college 0.40 34.8 22.2 D+12.6 teachers 0.62 82.6 70.4 D+12.2 classroom 0.55 52.2 40.7 D+11.4 school districts 0.50 26.1 37.0 R+11.0 universities 0.50 26.1 37.0 R+11.0 school students 0.50 26.1 37.0 R+11.0 graduate high school 0.35 21.7 11.1 D+10.6 young children 0.35 21.7 11.1 D+10.6 bachelor degree 0.24 4.4 14.8 R+10.5 children foster care 0.24 4.4 14.8 R+10.5 school student 0.24 4.4 14.8 R+10.5 school boards 0.24 4.4 14.8 R+10.5 parents teachers 0.24 4.4 14.8 R+10.5 teacher pay raise 0.24 4.4 14.8 R+10.5 high school college 0.24 4.4 14.8 R+10.5 public schools 0.56 43.5 33.3 D+10.2 class education 0.31 17.4 7.4 D+10.0 world class education 0.31 17.4 7.4 D+10.0 dedicated teachers 0.31 17.4 7.4 D+10.0 high schools 0.35 8.7 18.5 R+9.8 teacher salaries 0.35 8.7 18.5 R+9.8 computer science 0.52 17.4 25.9 R+8.5 high school 0.74 69.6 77.8 R+8.2 superintendent 0.59 21.7 29.6 R+7.9 students 0.79 100.0 92.6 D+7.4 educators 0.72 43.5 37.0 D+6.4 university 0.77 56.5 63.0 R+6.4 early education 0.55 17.4 11.1 D+6.3 help students 0.53 8.7 14.8 R+6.1 colleges 0.73 39.1 33.3 D+5.8 day kindergarten 0.53 13.0 7.4 D+5.6 education opportunity 0.53 13.0 7.4 D+5.6 school buildings 0.53 13.0 7.4 D+5.6 funding education 0.53 13.0 7.4 D+5.6 state college 0.53 13.0 7.4 D+5.6 technical education 0.53 13.0 7.4 D+5.6 students parents 0.53 13.0 7.4 D+5.6 student debt 0.53 13.0 7.4 D+5.6 post secondary 0.63 13.0 18.5 R+5.5 middle school 0.63 13.0 18.5 R+5.5 local school 0.70 17.4 22.2 R+4.8 stem 0.70 17.4 22.2 R+4.8 math 0.70 17.4 22.2 R+4.8 public school 0.76 21.7 25.9 R+4.2 higher education 0.84 47.8 51.9 R+4.0 college 0.88 73.9 77.8 R+3.9 education funding 0.78 26.1 22.2 D+3.9 apprenticeship 0.80 21.7 18.5 D+3.2 schools 0.91 95.7 92.6 D+3.1 apprenticeship programs 0.79 8.7 11.1 R+2.4 college degree 0.79 8.7 11.1 R+2.4 education budget 0.79 8.7 11.1 R+2.4 education programs 0.79 8.7 11.1 R+2.4 good education 0.79 8.7 11.1 R+2.4 graduation rate 0.79 8.7 11.1 R+2.4 12 schools 0.79 8.7 11.1 R+2.4 local school districts 0.79 8.7 11.1 R+2.4 students like 0.79 8.7 11.1 R+2.4 students graduate 0.84 13.0 11.1 D+1.9 elementary school 0.84 13.0 11.1 D+1.9 colleges universities 0.84 13.0 11.1 D+1.9 schools need 0.84 13.0 11.1 D+1.9 classrooms 0.93 39.1 40.7 R+1.6 schools state 0.93 17.4 18.5 R+1.1 teaching 0.96 30.4 29.6 D+0.8 public education 0.96 30.4 29.6 D+0.8 12 education 0.97 21.7 22.2 R+0.5 elementary 0.97 21.7 22.2 R+0.5 community colleges 0.97 21.7 22.2 R+0.5 high school students 0.99 26.1 25.9 D+0.2 education 1.00 100.0 100.0 EVEN school 1.00 100.0 100.0 EVEN
Excludes two- and three-word phrases that appeared in fewer than five speeches and single words that appeared in fewer than 10 speeches.
Includes all uses of a given phrase, even when it overlaps with another phrase. For example, “tuition” also counts the term “tuition” when it appears as part of “college tuition.”
*The p-value for a particular phrase is a measure of how unlikely it is that Democratic and Republican governors used the phrase with the same frequency. A lower p-value means that the partisanship of a phrase in our data set is more statistically distinguishable.
Sources: State websites, media outlets
Nationally, education has been an issue in the Democratic presidential race, with candidates promising free college tuition and keeping students out of debt. But on the state level, those ideas came up in only a handful of gubernatorial speeches — mostly Democratic ones.4 Democratic governors were more loquacious about another progressive priority, “early childhood education,” which was mentioned by seven Democratic governors and three Republican ones.
Health care
Another issue governors talked a lot about was health care — especially Democratic governors. That makes sense considering that health care was the No. 1 issue for Democrats in the 2018 midterm elections, which is when many of those Democratic governors were elected.
The partisan (and not so partisan) rhetoric on health care
One-, two- and three-word phrases about health care that appeared in governors’ 2019 state of the state speeches, by how often a phrase was used by Democratic and Republican governors
SHARE THAT INCLUDE PHRASE Phrase▲▼
P-VALUE*▲▼
Dem. speeches▲▼
Rep. speeches▲▼
Diff▲▼
sick 0.01 39.1% 3.7% D+35.4 affordable care act 0.01 39.1 3.7 D+35.4 health care 0.25 100.0 70.4 D+29.6 healthy 0.15 60.9 33.3 D+27.5 expand medicaid 0.02 30.4 3.7 D+26.7 access health 0.06 30.4 7.4 D+23.0 reproductive health 0.02 21.7 0.0 D+21.7 pre existing conditions 0.02 21.7 0.0 D+21.7 cost health 0.02 21.7 0.0 D+21.7 existing conditions 0.02 21.7 0.0 D+21.7 hospital 0.19 43.5 22.2 D+21.3 medical 0.32 65.2 44.4 D+20.8 epidemic 0.17 39.1 18.5 D+20.6 dr 0.15 34.8 14.8 D+20.0 access health care 0.10 26.1 7.4 D+18.7 health outcomes 0.07 21.7 3.7 D+18.0 health insurance 0.29 43.5 25.9 D+17.6 hospitals 0.26 34.8 18.5 D+16.3 doctor 0.24 30.4 14.8 D+15.6 health care costs 0.21 26.1 11.1 D+15.0 affordable health care 0.18 21.7 7.4 D+14.3 expanded medicaid 0.13 17.4 3.7 D+13.7 healthier 0.37 26.1 14.8 D+11.3 public health 0.37 26.1 14.8 D+11.3 behavioral health 0.37 26.1 14.8 D+11.3 health services 0.57 30.4 22.2 D+8.2 health 0.79 100.0 92.6 D+7.4 medicaid 0.74 52.2 59.3 R+7.1 quality health care 0.55 17.4 11.1 D+6.3 medicaid program 0.53 8.7 14.8 R+6.1 children health 0.53 13.0 7.4 D+5.6 health crisis 0.53 13.0 7.4 D+5.6 health challenges 0.53 13.0 7.4 D+5.6 illness 0.80 21.7 18.5 D+3.2 health substance 0.84 13.0 11.1 D+1.9 medicaid expansion 0.93 17.4 18.5 R+1.1
Excludes two- and three-word phrases that appeared in fewer than five speeches and single words that appeared in fewer than 10 speeches.
Includes all uses of a given phrase, even when it overlaps with another phrase. For example, “health care” also counts the term “health care” when it appears as part of “health care costs.”
*The p-value for a particular phrase is a measure of how unlikely it is that Democratic and Republican governors used the phrase with the same frequency. A lower p-value means that the partisanship of a phrase in our data set is more statistically distinguishable.
Sources: State websites, media outlets
Democratic governors were more likely than Republican ones to utter almost every health care-related phrase we looked at. For instance, more Democratic governors (nine of them, or 39 percent) used the phrase “Affordable Care Act” (the health care law passed under former President Barack Obama) than Republican governors (one, or 4 percent). And four Democratic governors called for their states to “expand Medicaid” — all of them, perhaps unsurprisingly, in states with divided government (where the governor, state Senate and/or state House are controlled by different parties). This could be because Medicaid expansion has recently passed in several red states and is broadly popular, making it a fertile issue for bipartisan cooperation. Or it could be simply because every Democratic-controlled state has expanded Medicaid already.
Mostly missing, however, from all the health-care talk was an endorsement of a single-payer health-insurance system — a major policy priority of some Democratic presidential candidates. Democrat Gavin Newsom of California was the only governor to mention “single payer” health care, or the idea that the government should pay for everyone’s health care with private insurance plans effectively eliminated, but he mentioned it only as a “long-term goal.” Likewise, only Democratic Gov. Jay Inslee of Washington urged his legislature to create a “public health option,” which would give people the ability to buy into a government-administered insurance plan. (His state went on this year to pass legislation that created this option.)
The economy
The third nearly ubiquitous issue in state of the state addresses was the economy. While rhetoric about jobs was bipartisan (“job” or “jobs” appeared in every speech), Republican and Democratic governors approached other aspects of economic policy differently.
The partisan (and not so partisan) rhetoric on the economy
One-, two- and three-word phrases about the economy that appeared in governors’ 2019 state of the state speeches, by how often a phrase was used by Democratic and Republican governors
SHARE THAT INCLUDE PHRASE Phrase▲▼
P-VALUE*▲▼
Dem. speeches▲▼
Rep. speeches▲▼
Diff▲▼
minimum wage 0.00 39.1% 0.0% D+39.1 middle class 0.01 39.1 3.7 D+35.4 competitive 0.10 30.4 63.0 R+32.5 business community 0.01 34.8 3.7 D+31.1 economic success 0.01 34.8 3.7 D+31.1 income tax 0.09 21.7 51.9 R+30.1 small businesses 0.07 47.8 18.5 D+29.3 good jobs 0.04 39.1 11.1 D+28.0 rainy day 0.07 13.0 40.7 R+27.7 workers 0.24 78.3 51.9 D+26.4 wage 0.13 52.2 25.9 D+26.2 state income 0.01 0.0 25.9 R+25.9 doing business 0.01 0.0 25.9 R+25.9 savings 0.18 30.4 55.6 R+25.1 taxpayers 0.18 30.4 55.6 R+25.1 small business 0.11 43.5 18.5 D+25.0 financial 0.21 26.1 48.2 R+22.1 economy works 0.02 21.7 0.0 D+21.7 raising taxes 0.06 4.4 25.9 R+21.6 new jobs 0.19 43.5 22.2 D+21.3 surplus 0.14 13.0 33.3 R+20.3 fiscal 0.32 39.1 59.3 R+20.1 create jobs 0.15 34.8 14.8 D+20.0 employee 0.13 30.4 11.1 D+19.3 funds 0.38 47.8 66.7 R+18.8 revenue 0.38 47.8 66.7 R+18.8 good job 0.10 26.1 7.4 D+18.7 fully funding 0.04 0.0 18.5 R+18.5 state income tax 0.04 0.0 18.5 R+18.5 tax rates 0.04 0.0 18.5 R+18.5 savings account 0.04 0.0 18.5 R+18.5 changing economy 0.07 21.7 3.7 D+18.0 economy strong 0.07 21.7 3.7 D+18.0 fiscally responsible 0.07 21.7 3.7 D+18.0 federal funding 0.07 21.7 3.7 D+18.0 high demand 0.09 4.4 22.2 R+17.9 state budget 0.32 30.4 48.2 R+17.7 company 0.32 30.4 48.2 R+17.7 poverty 0.29 43.5 25.9 D+17.6 taxes 0.45 56.5 74.1 R+17.6 tax cut 0.15 8.7 25.9 R+17.2 growing economy 0.15 8.7 25.9 R+17.2 job training 0.24 30.4 14.8 D+15.6 working families 0.24 30.4 14.8 D+15.6 build new 0.21 26.1 11.1 D+15.0 taxpayer 0.38 26.1 40.7 R+14.7 private sector 0.38 26.1 40.7 R+14.7 costs 0.52 73.9 59.3 D+14.7 unemployment rate 0.42 47.8 33.3 D+14.5 strong economy 0.18 21.7 7.4 D+14.3 good paying jobs 0.18 21.7 7.4 D+14.3 tax 0.59 78.3 92.6 R+14.3 dignity work 0.15 4.4 18.5 R+14.2 job creators 0.15 4.4 18.5 R+14.2 budget provides 0.15 4.4 18.5 R+14.2 industries 0.42 30.4 44.4 R+14.0 millions dollars 0.42 43.5 29.6 D+13.9 unemployment rate lowest 0.13 17.4 3.7 D+13.7 state funding 0.13 17.4 3.7 D+13.7 general fund 0.23 8.7 22.2 R+13.5 wages 0.41 39.1 25.9 D+13.2 growth 0.57 60.9 74.1 R+13.2 employment 0.31 13.0 25.9 R+12.9 cost 0.61 87.0 74.1 D+12.9 taxpayer dollars 0.38 17.4 29.6 R+12.2 employees 0.62 82.6 70.4 D+12.2 hundreds millions dollars 0.39 30.4 18.5 D+11.9 budgets 0.44 21.7 33.3 R+11.6 economic growth 0.44 21.7 33.3 R+11.6 business 0.69 100.0 88.9 D+11.1 industry 0.62 52.2 63.0 R+10.8 business owners 0.35 21.7 11.1 D+10.6 new businesses 0.35 21.7 11.1 D+10.6 property taxes 0.35 21.7 11.1 D+10.6 economic impact 0.24 4.4 14.8 R+10.5 budget calls 0.24 4.4 14.8 R+10.5 government spending 0.24 4.4 14.8 R+10.5 tax reform 0.24 4.4 14.8 R+10.5 high demand jobs 0.24 4.4 14.8 R+10.5 lowest unemployment 0.24 4.4 14.8 R+10.5 tax cuts 0.24 4.4 14.8 R+10.5 high paying jobs 0.24 4.4 14.8 R+10.5 small business owners 0.31 17.4 7.4 D+10.0 opportunity zones 0.31 17.4 7.4 D+10.0 tax dollars 0.31 17.4 7.4 D+10.0 local businesses 0.31 17.4 7.4 D+10.0 make ends meet 0.31 17.4 7.4 D+10.0 jobs future 0.31 17.4 7.4 D+10.0 budget provide 0.31 17.4 7.4 D+10.0 grow economy 0.35 8.7 18.5 R+9.8 fully funded 0.35 8.7 18.5 R+9.8 rainy day fund 0.35 8.7 18.5 R+9.8 fund 0.71 91.3 81.5 D+9.8 debt 0.63 39.1 48.2 R+9.0 dollar 0.63 39.1 48.2 R+9.0 economic development 0.67 60.9 51.9 D+9.0 million dollars 0.52 17.4 25.9 R+8.5 pay raise 0.52 17.4 25.9 R+8.5 trade 0.57 26.1 18.5 D+7.6 budget 0.79 100.0 92.6 D+7.4 economic 0.79 100.0 92.6 D+7.4 paying jobs 0.64 26.1 33.3 R+7.2 workforce 0.76 73.9 66.7 D+7.2 spend 0.71 47.8 40.7 D+7.1 economic opportunity 0.57 21.7 14.8 D+6.9 funding 0.79 78.3 85.2 R+6.9 economy 0.80 95.7 88.9 D+6.8 billion dollars 0.69 30.4 37.0 R+6.6 career technical 0.55 17.4 11.1 D+6.3 federal funds 0.55 17.4 11.1 D+6.3 fiscal year 0.53 8.7 14.8 R+6.1 workforce training 0.53 8.7 14.8 R+6.1 jobs created 0.53 8.7 14.8 R+6.1 spend money 0.53 8.7 14.8 R+6.1 manufacturing 0.73 34.8 40.7 R+6.0 companies 0.79 65.2 59.3 D+6.0 careers 0.73 39.1 33.3 D+5.8 jobs state 0.53 13.0 7.4 D+5.6 goods services 0.53 13.0 7.4 D+5.6 jobs today 0.53 13.0 7.4 D+5.6 federal tax 0.53 13.0 7.4 D+5.6 new job 0.53 13.0 7.4 D+5.6 personal income 0.53 13.0 7.4 D+5.6 career technical education 0.53 13.0 7.4 D+5.6 corporate tax 0.53 13.0 7.4 D+5.6 budget state 0.53 13.0 7.4 D+5.6 economic recovery 0.53 13.0 7.4 D+5.6 tough times 0.53 13.0 7.4 D+5.6 state economy 0.53 13.0 7.4 D+5.6 fair share 0.53 13.0 7.4 D+5.6 build stronger 0.53 13.0 7.4 D+5.6 additional funding 0.63 13.0 18.5 R+5.5 advanced manufacturing 0.63 13.0 18.5 R+5.5 dollars 0.83 87.0 81.5 D+5.5 supply 0.70 17.4 22.2 R+4.8 salaries 0.70 17.4 22.2 R+4.8 hiring 0.70 17.4 22.2 R+4.8 money 0.85 82.6 77.8 D+4.8 employers 0.81 43.5 48.2 R+4.7 income 0.85 69.6 74.1 R+4.5 unemployment 0.84 52.2 48.2 D+4.0 entrepreneurs 0.78 26.1 22.2 D+3.9 spending 0.87 52.2 55.6 R+3.4 fiscally 0.80 21.7 18.5 D+3.2 tax credit 0.80 21.7 18.5 D+3.2 businesses 0.90 78.3 81.5 R+3.2 tax relief 0.82 17.4 14.8 D+2.6 business owner 0.79 8.7 11.1 R+2.4 capital investment 0.79 8.7 11.1 R+2.4 budget proposes 0.79 8.7 11.1 R+2.4 bond rating 0.79 8.7 11.1 R+2.4 billions dollars 0.79 8.7 11.1 R+2.4 business climate 0.79 8.7 11.1 R+2.4 job growth 0.79 8.7 11.1 R+2.4 jobs know 0.79 8.7 11.1 R+2.4 attract retain 0.79 8.7 11.1 R+2.4 balance budget 0.79 8.7 11.1 R+2.4 work budget 0.79 8.7 11.1 R+2.4 balanced budget 0.79 8.7 11.1 R+2.4 tax increase 0.79 8.7 11.1 R+2.4 paying job 0.79 8.7 11.1 R+2.4 new industries 0.79 8.7 11.1 R+2.4 market 0.90 39.1 37.0 D+2.1 labor 0.90 39.1 37.0 D+2.1 funded 0.90 39.1 37.0 D+2.1 budget includes 0.84 13.0 11.1 D+1.9 new taxes 0.84 13.0 11.1 D+1.9 fully fund 0.84 13.0 11.1 D+1.9 cut taxes 0.84 13.0 11.1 D+1.9 business leaders 0.84 13.0 11.1 D+1.9 property tax 0.87 13.0 14.8 R+1.8 open business 0.87 13.0 14.8 R+1.8 fastest growing 0.87 13.0 14.8 R+1.8 million dollar 0.87 13.0 14.8 R+1.8 budget proposal 0.87 13.0 14.8 R+1.8 career 0.95 65.2 66.7 R+1.5 tax code 0.93 17.4 18.5 R+1.1 capital 0.96 43.5 44.4 R+1.0 prosperity 0.96 43.5 44.4 R+1.0 low income 0.96 30.4 29.6 D+0.8 jobs 0.98 95.7 96.3 R+0.7 job 0.98 95.7 96.3 R+0.7 job creation 0.97 21.7 22.2 R+0.5 salary 0.97 21.7 22.2 R+0.5 innovation 0.99 47.8 48.2 R+0.3 workforce development 0.99 26.1 25.9 D+0.2 working 1.00 100.0 100.0 EVEN
Excludes two- and three-word phrases that appeared in fewer than five speeches and single words that appeared in fewer than 10 speeches.
Includes all uses of a given phrase, even when it overlaps with another phrase. For example, “tax” also counts the term “tax” when it appears as part of “income tax.”
*The p-value for a particular phrase is a measure of how unlikely it is that Democratic and Republican governors used the phrase with the same frequency. A lower p-value means that the partisanship of a phrase in our data set is more statistically distinguishable.
Sources: State websites, media outlets
For example, a greater share of Democratic governors mentioned the “middle class” and “workers” than GOP governors, who were more preoccupied with taxes: They were more likely than Democrats to bring up such phrases as “tax rates,” “income tax” and “tax cuts.” And while Republican and Democratic governors were roughly equally likely to mention “job creation,” more GOP leaders used the term “job creators” (five vs. one), keeping with their pro-business reputation.
The most partisan economic term in this year’s state of the state addresses was “minimum wage.” Democratic governors were the only ones to utter that phrase — and the nine who did so all spoke favorably of a higher minimum wage. Interestingly, eight of the nine were speaking to a friendly (i.e., Democratic) legislature, indicating how raising the minimum wage is a priority for Democratic-controlled states.
Energy and the environment
We found differences among Republican and Democratic speeches on other policy issues as well. One of the sharpest contrasts was on how governors talked about energy and the environment.
The partisan (and not so partisan) rhetoric on the environment
One-, two- and three-word phrases about energy and the environment that appeared in governors’ 2019 state of the state speeches, by how often a phrase was used by Democratic and Republican governors
SHARE THAT INCLUDE PHRASE Phrase▲▼
P-VALUE*▲▼
Dem. speeches▲▼
Rep. speeches▲▼
Diff▲▼
climate change 0.00 56.5% 7.4% D+49.1 clean energy 0.00 47.8 3.7 D+44.1 climate 0.02 65.2 22.2 D+43.0 environment 0.04 17.4 51.9 R+34.5 carbon 0.03 34.8 7.4 D+27.4 energy future 0.02 21.7 0.0 D+21.7 natural resources 0.21 13.0 29.6 R+16.6 drinking water 0.18 21.7 7.4 D+14.3 environmental 0.42 43.5 29.6 D+13.9 public lands 0.13 17.4 3.7 D+13.7 air water 0.13 17.4 3.7 D+13.7 emissions 0.40 34.8 22.2 D+12.6 renewable energy 0.35 21.7 11.1 D+10.6 clean water 0.35 21.7 11.1 D+10.6 water quality 0.24 4.4 14.8 R+10.5 greenhouse gas 0.31 17.4 7.4 D+10.0 greenhouse gas emissions 0.53 13.0 7.4 D+5.6 oil 0.70 17.4 22.2 R+4.8 oil gas 0.79 8.7 11.1 R+2.4 energy 0.95 65.2 66.7 R+1.5
Excludes two- and three-word phrases that appeared in fewer than five speeches and single words that appeared in fewer than 10 speeches.
Includes all uses of a given phrase, even when it overlaps with another phrase. For example, “energy” also counts the term “energy” when it appears as part of “energy future.”
*The p-value for a particular phrase is a measure of how unlikely it is that Democratic and Republican governors used the phrase with the same frequency. A lower p-value means that the partisanship of a phrase in our data set is more statistically distinguishable.
Sourcs: State websites, media outlets
The phrase “climate change” appeared in 13 Democratic speeches but in just two Republican ones.5 There was a similar partisan split (11 to 1) in calls for “clean energy.” By contrast, Republicans tended to framed their environmental goals around protecting “natural resources” (a phrase that appeared in eight GOP speeches and three Democratic ones).
Criminal justice
Criminal-justice reform seems to be one of the few remaining bipartisan issues these days, and, fittingly, the term “criminal justice” appeared in 13 Republican speeches and in 12 Democratic ones.
The partisan (and not so partisan) rhetoric on criminal justice
One-, two- and three-word phrases about criminal justice that appeared in governors’ 2019 state of the state speeches, by how often a phrase was used by Democratic and Republican governors
SHARE THAT INCLUDE PHRASE Phrase▲▼
P-VALUE*▲▼
Dem. speeches▲▼
Rep. speeches▲▼
Diff▲▼
prison 0.01 21.7% 74.1% R+52.3 enforcement 0.03 21.7 63.0 R+41.2 law enforcement 0.03 21.7 63.0 R+41.2 gun violence 0.00 34.8 0.0 D+34.8 public safety 0.10 30.4 63.0 R+32.5 corrections 0.04 8.7 37.0 R+28.3 violence 0.13 52.2 25.9 D+26.2 gun safety 0.01 26.1 0.0 D+26.1 prisons 0.10 13.0 37.0 R+24.0 school safety 0.06 4.4 25.9 R+21.6 correctional 0.14 13.0 33.3 R+20.3 gun 0.15 34.8 14.8 D+20.0 attorney general 0.15 34.8 14.8 D+20.0 local law enforcement 0.04 0.0 18.5 R+18.5 schools safer 0.04 0.0 18.5 R+18.5 prison population 0.04 0.0 18.5 R+18.5 crime 0.28 26.1 44.4 R+18.4 violent 0.32 21.7 37.0 R+15.3 offenders 0.38 17.4 29.6 R+12.2 criminal 0.62 52.2 63.0 R+10.8 violent crime 0.24 4.4 14.8 R+10.5 non violent 0.24 4.4 14.8 R+10.5 police officer 0.24 4.4 14.8 R+10.5 law enforcement officers 0.45 13.0 22.2 R+9.2 police officers 0.53 13.0 7.4 D+5.6 criminal justice reform 0.70 17.4 22.2 R+4.8 victims 0.76 21.7 25.9 R+4.2 criminal justice 0.84 52.2 48.2 D+4.0 state police 0.82 17.4 14.8 D+2.6 violent offenders 0.79 8.7 11.1 R+2.4 recidivism rate 0.79 8.7 11.1 R+2.4 police 0.96 43.5 44.4 R+1.0
Excludes two- and three-word phrases that appeared in fewer than five speeches and single words that appeared in fewer than 10 speeches.
Includes all uses of a given phrase, even when it overlaps with another phrase. For example, “prison” also counts the term “prison” when it appears as part of “prison population.”
*The p-value for a particular phrase is a measure of how unlikely it is that Democratic and Republican governors used the phrase with the same frequency. A lower p-value means that the partisanship of a phrase in our data set is more statistically distinguishable.
Sources: State websites, media outlets
But Republican governors also lived up to their party’s historical “tough on crime” reputation, at least through their rhetoric. For instance, they were far more likely to nod to “public safety,” a phrase used by 17 GOP governors but seven Democrats. And while 17 Republicans mentioned “law enforcement” in their state of the state addresses, only five Democrats did. Republicans also talked more about “prisons” and “corrections” than Democrats did — however, their language surrounding it wasn’t always “tough.” For example, Iowa Gov. Kim Reynolds touted her state’s apprenticeship programs that try to reintegrate inmates in society: “Most of our inmates aren’t inmates for life. They will reenter society — and when they do, we want them to be successful. Those who can’t get a job often find their way back to crime and then back to prison.” Several other Republican governors discussed the need to reduce their “prison population.”
On the other hand, it was mostly Democratic governors who talked about guns. For example, eight Democratic governors used the term “gun violence,” but no Republicans did so. Notably, only two Republican governors even mentioned the “Second Amendment.” More frequently, Republicans talked about guns in the context of “school safety,” a phrase used in seven GOP speeches and one Democratic one.
Mental health
More Republican governors (18) than Democratic ones (10) used the phrase “mental health” in their state of the state addresses, and a third of those Republicans — six of the 18 — did so in the context of violence in schools. For example, Georgia Gov. Brian Kemp said, “To keep our classrooms safe, we must also address the mental health issues that often lead to school violence.”
The partisan (and not so partisan) rhetoric on mental health
One-, two- and three-word phrases about mental health that appeared in governors’ 2019 state of the state speeches, by how often a phrase was used by Democratic and Republican governors
SHARE THAT INCLUDE PHRASE Phrase▲▼
P-VALUE*▲▼
Dem. speeches▲▼
Rep. speeches▲▼
Diff▲▼
mental health 0.27 43.5% 66.7% R+23.2 drugs 0.24 21.7 40.7 R+19.0 drug 0.44 43.5 59.3 R+15.8 addiction 0.50 26.1 37.0 R+11.0 mental health issues 0.24 4.4 14.8 R+10.5 opioid addiction 0.35 8.7 18.5 R+9.8 overdose 0.57 26.1 18.5 D+7.6 opioid 0.71 47.8 40.7 D+7.1 substance 0.69 30.4 37.0 R+6.6 mental health care 0.53 8.7 14.8 R+6.1 substance use 0.53 8.7 14.8 R+6.1 opioid crisis 0.70 17.4 22.2 R+4.8 substance abuse 0.78 26.1 22.2 D+3.9 mental health substance 0.84 13.0 11.1 D+1.9 mental health services 0.93 17.4 18.5 R+1.1 mental illness 0.93 17.4 18.5 R+1.1
Excludes two- and three-word phrases that appeared in fewer than five speeches and single words that appeared in fewer than 10 speeches.
Includes all uses of a given phrase, even when it overlaps with another phrase. For example, “mental health” also counts the term “mental health” when it appears as part of “mental health care.”
*The p-value for a particular phrase is a measure of how unlikely it is that Democratic and Republican governors used the phrase with the same frequency. A lower p-value means that the partisanship of a phrase in our data set is more statistically distinguishable.
Sources: State websites, media outlets
Other Republicans spoke about mental health more broadly. For instance, New Hampshire Gov. Chris Sununu discussed overhauling the state’s mental health care system and reducing suicide rates. And four Republican governors brought up mental health in the context of drug addiction. Republicans were also likelier than Democrats to discuss “opioid addiction,” but “opioid” overall was relatively common in both Democratic and Republican speeches.
As for immigration and abortion, two issues that have recently been prominent on the national level, we didn’t find a lot of discussion of them in the governors’ speeches. Only three gubernatorial speeches included the word “immigration,” and related terms were similarly rare. When they did come up, there was a noticeable partisan divide: For example, Democrats were more likely to use the word “immigrants” (four speeches to two), while Republicans were more likely to reference the “border” (five speeches to one). Similarly, just two governors mentioned abortion: Democratic Gov. Michelle Lujan Grisham of New Mexico, who is a supporter of abortion rights, and Democratic Gov. John Bel Edwards of Louisiana, who is against abortion. Of course, this doesn’t mean that state governments aren’t legislating on abortion — we know that they are — but it’s notable that so few governors mentioned it in their speeches.
Setting partisan differences aside, a lot of governors agreed on one thing in particular: that the state of their state was strong! Of the dozens of governors who included the phrase “the state of our state is …”6 in their state of the state address, at least 16 followed it with “strong” or some variation thereof — including “stronger than ever,” “growing stronger each day” and “hopeful, prosperous and strong.” Others were more creative and said the state of their state was “solid,” “rock solid,” “full of opportunity” or “determined.” But a few were … less confident: “The state of our state is improving” (ouch, Kansas); “the state of our state is that we’ve got work to do” (better get cracking, Wisconsin!).
Laura Bronner contributed analysis.
0 notes
Link
via Politics – FiveThirtyEight
UPDATED SEP. 21, 2021, AT 10:34 AM
Latest PollsUpdated throughout the day.
Polls policy and FAQs
POLL TYPE
All pollsBiden approvalGeneric ballotGovernorGovernor recallU.S. HousePresident: general electionPresident: Democratic primaryPresident: Republican primaryU.S. SenateTrump approval
STATE
All Alabama Alaska American Samoa Arizona Arkansas California Colorado Connecticut Delaware District of Columbia Florida Georgia Guam Hawaii Idaho Illinois Indiana Iowa Kansas Kentucky Louisiana Maine Maryland Massachusetts Michigan Minnesota Mississippi Missouri Montana Nebraska Nevada New Hampshire New Jersey New Mexico New York North Carolina North Dakota Northern Mariana Islands Ohio Oklahoma Oregon Pennsylvania Puerto Rico Rhode Island South Carolina South Dakota Tennessee Texas U.S. Virgin Islands Utah Vermont Virginia Washington West Virginia Wisconsin Wyoming
DISTRICT
AllWho’s ahead in the Virginia governor’s race?
An updating average for each candidate, accounting for each poll’s quality, sample size and recency
AUG. 2021SEPT.OCT.NOV.3040506070%SEPT. 21, 2021 LEADERSEPT. 21, 2021 LEADERMcAuliffeMcAuliffe+3.1McAuliffe 47.2%Youngkin 44.1%
Average as of today
McAuliffe47.2%
Youngkin44.1%
FILTER BY POLLSTER GRADE
A+BCDAdded today
DATES POLLSTER SAMPLE RESULT NET RESULT Governor Va. SEP 17-18, 2021 A-Public Policy Polling* 875 V McAuliffe 45% 42% Youngkin McAuliffe +3
KEY
A = ADULTS
RV = REGISTERED VOTERS
V = VOTERS
LV = LIKELY VOTERS
Yesterday
Governor Va. SEP 7-15, 2021 B/CVirginia Commonwealth University 731 LV McAuliffe 43% 34% Youngkin McAuliffe +9
Sept. 17, 2021
Governor Va. SEP 7-13, 2021 A+The Washington Post/George Mason University 728 LV McAuliffe 50% 47% Youngkin McAuliffe +3 Governor Va. SEP 7-13, 2021 A+The Washington Post/George Mason University 907 RV McAuliffe 49% 43% Youngkin McAuliffe +6
Sept. 16, 2021
Governor Va. SEP 13-14, 2021 A-Emerson College 778 LV McAuliffe 51% 48% Youngkin McAuliffe +3
Sept. 9, 2021
Governor Va. AUG 30-SEP 2, 2021 B/CWPA Intelligence* 734 LV McAuliffe 48% 48% Youngkin EVEN Governor Va. AUG 3-5, 2021 B/CWPA Intelligence* 734 LV McAuliffe 50% More McAuliffe +7 Governor Va. AUG 3-5, 2021 B/CWPA Intelligence* 734 LV McAuliffe 51% 45% Youngkin McAuliffe +6
Show more polls
Polls conducted after June 28, 2018, the date this page was published, are listed by the date that FiveThirtyEight collected them; polls conducted before then are listed under the last date that the poll was in the field. Polls from firms that are banned by FiveThirtyEight are not shown. Pollsters that did not release any horse-race polls within three weeks of an election since 1998 do not have a grade and are treated as a C+ by the grade filter.
* Polls marked with an asterisk are partisan polls. Partisanship is determined by who sponsors the poll, rather than who conducts it. Polls are considered partisan if they’re conducted on behalf of a candidate, party, campaign committee, or PAC, super PAC, 501(c)(4), 501(c)(5) or 501(c)(6) organization that conducts a large majority of its political activity on behalf of one political party.
When the dates of tracking polls from the same pollster overlap, only the most recent version is shown.
Notice any bugs or missing polls? Send us an email.
Download this data: presidential primary polls, presidential general election polls, Senate polls, House polls, gubernatorial polls, presidential approval polls, generic congressional ballot polls
Design and development by Aaron Bycoffe, Ritchie King, Ella Koeze, Dhrumil Mehta, Jasmine Mithani and Julia Wolfe. Andrea Jones-Rooy, Dhrumil Mehta, Nathaniel Rakich, Derek Shan and Julia Wolfe contributed research.
RELATED STORIES
Why Candidates With Little Hope Of Winning Are Raising More Money Than EverWhy The Gender Gap May Have Shrunk In The 2020 ElectionHow FiveThirtyEight’s 2020 Forecasts Did And What We’ll Be Thinking About For 2022What’s Happening In Arizona Is Not Really An Audit Or A Recount. It’s A Partisan Inquisition.How The Republican Push To Restrict Voting Could Affect Our Elections
COMMENTS
Get more FiveThirtyEight
Newsletter
Videos
Podcasts
Twitter
Facebook
Data
RSS
Contact
Jobs
Masthead
About Nielsen Measurement
Terms of Use
Privacy Policy
Do Not Sell My Info
Your California Privacy Rights
Children’s Online Privacy Policy
Interest-Based Ads
© 2018 ABC News Internet Ventures. All rights reserved.
0 notes
Link
via Politics – FiveThirtyEight
P
S
Find a race
FiveThirtyEight
Democrats are slightly favored to win the Senate
Each party’s seat count in scenarios where it wins the Senate in our Deluxe model’s 40,000 simulations. Higher bars represent more common outcomes. Our presidential forecast determines which party gets control when the Senate is evenly split.
Average outcome: 50.5
53 R seats
54 D
80% ofoutcomes fallin this range
Morelikely
62
60
58
56
54
52
50
52
54
56
58
60
62
64
53 R SEATS
7.0% chance
7.0% chance
Democrats have an 80% chance of holding between 47 and 54 seats.
In 42 in 100 scenarios, Republicans win control
In 58 in 100 scenarios, Democrats win control
When both parties hold 50 seats, control of the Senate is decided by which party holds the vice presidency in our presidential forecast. Counts of Democratic seats include two independent senators who caucus with the Democrats.
Want to see other versions of the forecast? Click the magnifying glass in the lower left!
2020 ELECTION COVERAGE
Why Pennsylvania Could Decide The 2020 Election
By Nathaniel Rakich
More And More Americans Aren’t Religious. Why Are Democrats Ignoring These Voters?
By Daniel Cox and Amelia Thomson-DeVeaux
Forecasting each Senate seat
Icon Legend
Solid R
≥95% R
Likely R
≥75%
Lean R
≥60%
Toss-up
<60% both
Lean D
≥60%
Likely D
≥75%
Solid D
≥95% D
Counts of Democratic seats include two independent senators who caucus with the Democrats. Forecasts do not add to 100 in some races due to rounding.
In the Louisiana race and Georgia’s special election, multiple candidates from each party are facing off on Election Day. If no one gets a majority, two candidates go to a runoff.
US GENERAL
Biden is favored to win
See the forecast
How the Senate forecast has changed
See how each party’s forecasted seat total and chances of controlling the Senate have changed over time. The forecast updates at least once a day and whenever we get a new poll.
Each party's majority chances include scenarios where the Senate is evenly split and that party holds the vice presidency in our presidential forecast.
As the election gets closer — and as we get swamped with new polls

— the forecast will get less uncertain.
Who’s ahead in each state
Leading candidate’s forecasted chance of winning and margin of victory in each state. Dots closer to the line represent tighter races, and wider bars mean more uncertainty about the outcome.
Race Legend
80% of outcomes fall in this range
SORT BY MARGIN
SORT BY STATE
Margin of victory
Fun fact: Incumbents who were appointed to their seat lose more often than elected incumbents, so they don’t get an incumbency boost in our model.
We made this
FORECAST MODEL
Nate Silver
PROJECT MANAGEMENT
Christopher Groskopf
DESIGN
Ryan Best
Jasmine Mithani
Anna Wiederkehr
CONTENT EDITING
Micah Cohen
Sarah Frostenson
Christopher Groskopf
Nate Silver
ART DIRECTION
Emily Scherer
ILLUSTRATION
Fabio Buonocore
Joey Ellis
DEVELOPMENT
Ryan Best
Jay Boice
Aaron Bycoffe
Christopher Groskopf
Elena Mejía
Jasmine Mithani
Anna Wiederkehr
Julia Wolfe
Yutong Yuan
COPY EDITING
Colleen Barry
Jennifer Mason
DATA & RESEARCH
Aaron Bycoffe
Dhrumil Mehta
Mary Radcliffe
Derek Shan
Download the data:PollsModel outputs
Notice a

?Send us an email.
Congrats, you made it to the bottom! If you’re looking for the nitty-gritty of how our forecast works, check out the methodology.
Lite
What Election Day looks like based on polls alone
Classic
What Election Day looks like based on polls, fundraising, past voting patterns and more
Deluxe
What Election Day looks like when we add experts’ ratings to the Classic forecast
x
RELATED STORIES
What’s The Chance That Trump Loses The Popular Vote But Wins The Election Again?
What’s The Chance That Trump Loses The Popular Vote But Wins The Election Again?
North Carolina Is Already Rejecting Black Voters’ Mail-In Ballots More Often Than White Voters’
North Carolina Is Already Rejecting Black Voters’ Mail-In Ballots More Often Than White Voters’
More And More Americans Aren’t Religious. Why Are Democrats Ignoring These Voters?
More And More Americans Aren’t Religious. Why Are Democrats Ignoring These Voters?
Election Update: Where Biden And Trump Have Gained The Most Ground
Election Update: Where Biden And Trump Have Gained The Most Ground
Trump Has Lost His Edge In TV Advertising
Trump Has Lost His Edge In TV Advertising
COMMENTS
Get more FiveThirtyEight
Newsletter
Videos
Podcasts
Twitter
Facebook
Data
RSS
Contact
Jobs
Masthead
About Nielsen Measurement
Terms of Use
Privacy Policy
Do Not Sell My Info
Your California Privacy Rights
Children's Online Privacy Policy
Interest-Based Ads
© 2018 ABC News Internet Ventures. All rights reserved.
0 notes
Link
via Politics – FiveThirtyEight
National overviewNational overviewArizonaColoradoFloridaGeorgiaIowaMaine (statewide)MichiganMinnesotaNevadaNew HampshireNew MexicoNorth CarolinaOhioPennsylvaniaVirginiaWisconsinAlabamaAlaskaArizonaArkansasCaliforniaColoradoConnecticutDelawareDistrict of ColumbiaFloridaGeorgiaHawaiiIdahoIllinoisIndianaIowaKansasKentuckyLouisianaMaine (statewide)Maine 1st DistrictMaine 2nd DistrictMarylandMassachusettsMichiganMinnesotaMississippiMissouriMontanaNebraska (statewide)Nebraska 1st DistrictNebraska 2nd DistrictNebraska 3rd DistrictNevadaNew HampshireNew JerseyNew MexicoNew YorkNorth CarolinaNorth DakotaOhioOklahomaOregonPennsylvaniaRhode IslandSouth CarolinaSouth DakotaTennesseeTexasUtahVermontVirginiaWashingtonWest VirginiaWisconsinWyoming hey there! I’m Fivey Fox, and I’m here to show you around. Each of these maps is an example of how things might shake out on Election Day.
Latest news
MAY 4, 2020
The race for the presidency is not officially over, but in lots of ways the contest has been resolved. Maine’s 2nd district is heating up and we’re also keeping an eye on Utah’s 1st.
The former vice president Joseph R. Biden Jr. has amassed hundreds more delegates than the senator from Vermont, building an advantage that is all but insurmountable.
The only other candidate who was still running, Tulsi Gabbard, dropped out and endorsed Mr. Biden.
2020 ELECTION COVERAGE
Will Justin Amash’s Presidential Run Help Or Hurt Trump?
By Geoffrey Skelley and Tony Chow
What Went Down In Ohio’s Primary
By Nathaniel Rakich
To put all these numbers in context, check out our coverage and subscribe to the FiveThirtyEight Politics podcast!Biden is favored to win the election
We simulate the election 40,000 times to see who wins most often. The sample of 100 outcomes below gives you a good idea of the range of scenarios our model thinks is possible.
TIE+400ELECTORALVOTES+200+200+40028 in 10028 in 100Trump winsTrump wins72 in 10072 in 100Biden winsBiden winsTrump winBiden win
Don’t count the underdog out! Upset wins are surprising but not impossible.Every outcome in our simulations
All possible Electoral College outcomes for each candidate, with higher bars showing outcomes that appeared more often in our 40,000 simulations
0100200300400500270 ELECTORAL VOTESSmoothedrollingaverageTrumpTrumpwinswinsMorelikelyMorelikely0100200300400500BidenBidenwinswinsMore bars to the right of the 270 line means more simulations where that candidate wins. Some of the bars represent really weird outcomes, but you never know!The winding path to victory
States that are forecasted to vote for one candidate by a big margin are at the ends of the path, while tighter races are in the middle. Bigger segments mean more Electoral College votes. Trace the path from either end to see which state could put one candidate over the top.
VOTE MARGINSTIPPING POINTS270 ELECTORAL VOTESNE3WYWVIDOKLAHOMANDSDALABAMAKENTUCKYNEUTAHTENNESSEELOUISIANAARKANSASNE1INDIANAKANSASMTMISSISSIPPIMISSOURIAKSOUTH CAROLINATEXASIOWAME2GEORGIAOHIONORTH CAROLINAARIZONANE2FLORIDAWISCONSINPENNSYLVANIAMINNESOTANEVADANHMICHIGANMECOLORADOVIRGINIANMOREGONNEW JERSEYCONNECTICUTME1ILLINOISDERIWASHINGTONNEW YORKMARYLANDCALIFORNIAMASSACHUSETTSHIVTDCMaine and Nebraska’s congressional districts are shown separately because those states split their Electoral College votes, allotting some to the statewide winner and some to the winner of each district.We call this the

snake
chart! This makes it easy to see why some states are hotly contested and others mostly get ignored.How the forecast has changed
The forecast updates at least once a day and whenever we get a new poll. Click the buttons to see the ways each candidate’s outlook has changed over time.
CHANCE OF WINNINGELECTORAL VOTESPOPULAR VOTEJUNE 1JULY 1AUG. 1SEPT. 1OCT. 1NOV. 10 20 40 60 80 100%72 in 10028 in 10072 in 10028 in 10080% of outcomesfall in this range80% of outcomesfall in this rangeAs the election gets closer — and as we get swamped with new polls

— the forecast will get less uncertain.See states with the closest racesSee states close to the tipping pointNorth CarolinaNorth CarolinaArizonaArizonaOhioOhioGeorgiaGeorgiaFloridaFloridaIowaIowaTexasTexasWisconsinWisconsinPennsylvaniaPennsylvaniaOr choose another stateAlabamaAlaskaArizonaArkansasCaliforniaColoradoConnecticutDelawareDistrict of ColumbiaFloridaGeorgiaHawaiiIdahoIllinoisIndianaIowaKansasKentuckyLouisianaMaineMaine 1st DistrictMaine 2nd DistrictMarylandMassachusettsMichiganMinnesotaMississippiMissouriMontanaNebraskaNebraska 1st DistrictNebraska 2nd DistrictNebraska 3rd DistrictNevadaNew HampshireNew JerseyNew MexicoNew YorkNorth CarolinaNorth DakotaOhioOklahomaOregonPennsylvaniaRhode IslandSouth CarolinaSouth DakotaTennesseeTexasUtahVermontVirginiaWashingtonWest VirginiaWisconsinWyomingWant more stuff like this? See how the race is shaping up in individual states, or watch our Election Updates on YouTube.We made this
FORECAST MODEL
Nate Silver
PROJECT MANAGEMENT
Christopher Groskopf
DESIGN
Ryan Best
Jasmine Mithani
Anna Wiederkehr
CONTENT EDITING
Micah Cohen
Sarah Frostenson
Christopher Groskopf
Nate Silver
ART DIRECTION
Emily Scherer
ILLUSTRATION
Fabio Buonocore
Joey Ellis
DEVELOPMENT
Ryan Best
Jay Boice
Aaron Bycoffe
Christopher Groskopf
Jasmine Mithani
Anna Wiederkehr
Julia Wolfe
Yutong Yuan
COPY EDITING
Colleen Barry
Jennifer Mason
DATA & RESEARCH
Aaron Bycoffe
Dhrumil Mehta
Mary Radcliffe
Derek Shan
Download the data:PollsModel Outputs
Notice a

?Send us an email.
Congrats, you made it to the bottom! If you’re looking for the nitty-gritty of how our forecast works, check out the methodology[a].
RELATED STORIES
How Biden’s Standing In The Polls Compares To Clinton’s At This Point In 2016What You Need To Know About Today’s Elections In Minnesota And GeorgiaFive Ways Trump And GOP Officials Are Undermining The Election ProcessDo You Buy That … Kamala Harris Is Most Likely To Become Biden’s Running Mate?Why GOP Senators Are Sticking With Trump — Even Though It Might Hurt Them In November
COMMENTS
YOU MAY LIKEPROGRESSIVE | AUTO INSURANCE QUOTES|SPONSOREDHey friend! Can I help you save on car insurance?NERDWALLET|SPONSOREDYou could be earning cash back on purchases. See top cardsCALL OF WAR WORLD WAR II|SPONSOREDThis WW2 strategy game will keep you entertained for weeks!FORGE OF EMPIRES|SPONSOREDIf You Like to Play, this City-Building Game is a Must-Have. No Install.WELLS FARGO-MEMBER FDIC.|SPONSOREDGet Everyday Checking for convenient digital banking.O2 CANADA|SPONSOREDHere’s Why This $70 Respirator is Better Than Your Face MaskFIVETHIRTYEIGHTWhy GOP Senators Are Sticking With Trump — Even Though It Might Hurt Them In NovemberFIVETHIRTYEIGHTVoters Are Starting To Doubt Trump’s Reelection ChancesNERDWALLET|SPONSOREDThe Best Way To Wipe Out Up To $10,000 Of DebtWOLF & SHEPHERD|SPONSOREDNBA Star Steve Nash Helps Design Hybrid Shoe Snapped up by Thousands of MenBRAVE NEW LOOK|SPONSOREDSoft, washable, and adjustable with PM 2.5 FilterDR. MARTY NATURE’S FEAST|SPONSOREDIf Your Cat Is Over 10 Years Old, This One Thing Could Be Shortening Their LifeBRAVE NEW LOOK|SPONSOREDCloth Masks Featured in VogueFIVETHIRTYEIGHTConfidence Interval: Biden Will Choose Kamala Harris As His VP?FIVETHIRTYEIGHTHow Biden’s VP Pick Could Shape Perceptions Of The Ticket OverallNERDWALLET|SPONSOREDConsolidate Credit Card Debt With a Personal Loan. See Best RatesMYDOMAINE|SPONSOREDLove Historic New York Style? These Homes Are For YouWIKIBUY|SPONSOREDThis Checkout Trick Can Drop Your Best Buy Total InstantlyGet more FiveThirtyEight
Newsletter
Videos
Podcasts
Twitter
Facebook
Data
RSS
Contact
Jobs
Masthead
About Nielsen Measurement
Terms of Use
Privacy Policy
Do Not Sell My Info
Your California Privacy Rights
Children’s Online Privacy Policy
Interest-Based Ads
© 2018 ABC News Internet Ventures. All rights reserved.
0 notes
Link
via Politics – FiveThirtyEight
ELECTION 2018
FiveThirtyEight
House forecast
Senate
Governor
Midterms coverage
More politics
Latest polls
Generic ballot
Trump approval
How do you like your governor forecast?
Lite
Keep it simple, please — give me the best forecast you can based on what state and national polls say
Classic
I’ll take the polls, plus all the “fundamentals”: fundraising, past voting in the state, historical trends and more
Deluxe
Gimme the works — the Classic forecasts plus experts’ ratings
Forecasting the races for governor
Updated Oct. 2, 2018, at 10:18 AM
195 million
Population forecasted to be governed by Democrats
134 million
Population forecasted to be governed by Republicans
23.7
Average states governed by Democrats across our simulations
26.2
Average states governed by Republicans across our simulations[a]
Our forecast for every race for governor
What share of the national population Democrats and Republicans are expected to govern, based on the most likely winner in each of the 36 gubernatorial elections taking place in 2018 and who controls the 14 seats not up for election.
59.0% of thepopulation
WA
VA
NC
NJ
NY
PA
CA
MI
IL
FL
WA
VA
NC
NJ
NY
PA
CA
MI
IL
FL
41.0%
IN
MA
TX
TN
AZ
OH
GA
IN
MA
TX
TN
AZ
OH
GA
500,000 RESIDENTS
No election
Solid D
Likely D
Lean D
Toss-up
Lean R
Likely R
Solid R
No election
≥95%
≥75%
≥60%
<60% both
≥60%
≥75%
≥95%
AK
AK
CA
CA
CO
CO
ID
ID
IL
IL
IA
IA
KY
KY
LA
LA
MD
MD
MN
MN
MO
MO
NY
NY
OR
OR
TN
TN
TX
TX
VA
VA
WI
WI
AL
AL
AZ
AZ
AR
AR
IN
IN
KS
KS
ME
ME
CT
CT
DE
DE
GA
GA
HI
HI
SC
SC
SD
SD
MA
MA
MI
MI
MS
MS
NE
NE
NV
NV
NH
NH
NJ
NJ
NM
NM
NC
NC
ND
ND
RI
RI
OH
OH
OK
OK
PA
PA
FL
FL
MT
MT
UT
UT
VT
VT
WA
WA
WV
WV
WY
WY
Who’s ahead in each race
The closer the dot is to the center line, the tighter the race. And the wider the bar, the less certain the model is about the outcome.
KEY
AVERAGE
80% CHANCE OUTCOME FALLS IN THIS RANGE
StateCandidatesIncumbentExpected margin of victory
D+75
D+50
D+25
R+25
R+50
R+75
Nevada
–
Sisolakvs.Laxalt
R+0.1
Georgia
–
Abramsvs.Kemp
R+0.6
Ohio
–
Cordrayvs.DeWine
R+1.5
Wisconsin
R
Eversvs.Walker
D+2.2
Kansas
–
Kellyvs.Kobach
R+2.5
Florida
–
Gillumvs.DeSantis
D+3.5
Oklahoma
–
Edmondsonvs.Stitt
R+6.4
Connecticut
–
Lamontvs.Stefanowski
D+7.3
New Mexico
–
Lujan Grishamvs.Pearce
D+7.3
Iowa
R
Hubbellvs.Reynolds
D+7.8
Oregon
D
Brownvs.Buehler
D+9.4
Maine
–
Millsvs.Moody
D+10.4
Colorado
–
Polisvs.Stapleton
D+10.4
South Dakota
–
Suttonvs.Noem
R+10.8
Michigan
–
Whitmervs.Schuette
D+11.5
Arizona
R
Garciavs.Ducey
R+11.8
South Carolina
R
Smithvs.McMaster
R+11.9
Alaska
I
Begichvs.Dunleavy
R+12.0
Minnesota
–
Walzvs.Johnson
D+12.5
Illinois
R
Pritzkervs.Rauner
D+12.6
Vermont
R
Hallquistvs.Scott
R+13.6
Tennessee
–
Deanvs.Lee
R+14.3
Idaho
–
Jordanvs.Little
R+15.0
Pennsylvania
D
Wolfvs.Wagner
D+16.1
New Hampshire
R
Kellyvs.Sununu
R+16.6
Alabama
R
Maddoxvs.Ivey
R+17.1
California
–
Newsomvs.Cox
D+17.7
Maryland
R
Jealousvs.Hogan
R+17.7
Texas
R
Valdezvs.Abbott
R+18.7
Rhode Island
D
Raimondovs.Fung
D+19.4
New York
D
Cuomovs.Molinaro
D+22.2
Nebraska
R
Kristvs.Ricketts
R+22.6
Wyoming
–
Thronevs.Gordon
R+24.8
Massachusetts
R
Gonzalezvs.Baker
R+29.3
Arkansas
R
Hendersonvs.Hutchinson
R+30.3
Hawaii
D
Igevs.Tupola
D+31.4
Our latest coverage
10 HOURS AGO
Young Voters Might Actually Show Up At The Polls This Year
By Geoffrey Skelley
2 DAYS AGO
Why The House And Senate Are Moving In Opposite Directions
By Nate Silver
OCT 12
Can Heitkamp Pull Off A Second Upset In North Dakota?
By Janie Velencia and Dhrumil Mehta
How this forecast works
Nate Silver explains the methodology behind our 2018 midterm forecasts. Read more …
State populations are based on forecasted populations as of Election Day (Nov. 6, 2018), using data extrapolated from the American Community Survey and the Census Bureau’s U.S. population Clock and factoring in recent growth rates in each state.. The third-party and independent candidates listed represent our best approximation of who will appear on each state’s general election ballot. The candidates listed will update as each race is finalized; some listed candidates may not ultimately qualify for the general election.[b][c][d]
Forecast models by Nate Silver. Design and development by Jay Boice, Aaron Bycoffe, Rachael Dottle, Ritchie King, Ella Koeze, Andrei Scheinkman, Gus Wezerek and Julia Wolfe. Research by Andrea Jones-Rooy, Dhrumil Mehta, Mai Nguyen and Nathaniel Rakich. Notice any bugs? Send us an email.
RELATED STORIES
Young Voters Might Actually Show Up At The Polls This Year
Young Voters Might Actually Show Up At The Polls This Year
Why The House And Senate Are Moving In Opposite Directions
Why The House And Senate Are Moving In Opposite Directions
Can Heitkamp Pull Off A Second Upset In North Dakota?
Can Heitkamp Pull Off A Second Upset In North Dakota?
Democrats Have A Chance To Win One Of The Reddest Districts In The Country
Democrats Have A Chance To Win One Of The Reddest Districts In The Country
Politics Podcast: Two Forecasts Diverged In A Wood
Politics Podcast: Two Forecasts Diverged In A Wood
Get more FiveThirtyEight
Newsletter
Videos
Podcasts
Twitter
Facebook
Data
RSS
Contact
Jobs
Masthead
About Nielsen Measurement
Terms of Use
Privacy Policy
Your California Privacy Rights
Children’s Online Privacy Policy
Interest-Based Ads
© 2018 ABC News Internet Ventures. All rights reserved.
0 notes
Link
via Politics – FiveThirtyEight
Welcome to Pollapalooza, our weekly polling roundup.
Poll(s) of the week
The 2018 midterm election confirmed America’s urban-rural divide; Democrats excelled in cities, Republicans dominated in the country and the suburbs were the tiebreaker that handed Democrats the House. Will the 2020 election play out the same way? This week, we got two polls of President Trump’s approval rating that suggest it might.
First, a Selzer & Co. (one of our favorite pollsters) national poll conducted Nov. 24-27 for Grinnell College found that Trump had a 43 percent approval rating and a 45 percent disapproval rating among all adults. However, his support isn’t distributed equally across different types of communities. He’s enormously popular among residents of rural areas, with a 61 percent approval rating and a 26 percent disapproval rating. In small towns, that breakdown is 44 percent approve vs. 42 percent disapprove. But in suburban areas, only 41 percent of residents approve of the job that Trump is doing as president, while 50 percent disapprove. Trump’s approval rating is lowest among urbanites — 31 percent approve of him while 59 percent disapprove.
We saw similar geographic trends in an Investor’s Business Daily/TIPP poll that was conducted from Nov. 26 to Dec. 2. Trump again got the highest marks from residents of rural areas — a 62 percent approval rating and a 35 percent disapproval rating. And yet again, his standing took a nosedive among suburbanites and urbanites. In suburban areas, Trump’s approval rating was 32 percent, and his disapproval rating was 60 percent. In urban areas, his approval rating was 27 percent, and his disapproval rating was 67 percent. (The IBD/TIPP poll didn’t include “small town” as an option for respondents.) Overall, Trump’s approval/disapproval spread was much lower in the IBD/TIPP poll (39 percent approve, 55 percent disapprove) than it was in the Selzer poll, which explains why the IBD/TIPP poll is worse for Trump in all three geographic categories as well.
Here are the results of the polls side by side:
Trump is more popular in rural areas
Presidential net approval rating among adults by density type
Category Selzer Poll IBD/TIPP Poll Urban -28 -40 Suburban -9 -28 Small town* +2 — Rural +35 +27 Overall -2 -16
* The Investor’s Business Daily/TIPP poll did not include a breakdown for “small town.”
Sources: Selzer & Co., Grinnell College, Investor’s Business Daily
This is perhaps stating the obvious, but Trump would do well to approve his standing among suburban and urban voters before 2020. Less than 20 percent of the U.S. population lives in rural areas. Granted, not all rural voters will cast their ballot for the president, nor will all urban and suburban voters back whoever is the Democratic nominee. But elections are winner-take-all contests waged within discrete geographic areas — states or districts. According to the Congressional Density Index from CityLab, a news website covering urban issues, just 70 congressional districts are “pure rural,” and an additional 114 are a “rural-suburban mix.” CityLab is still in the process of making similar assessments for states, but David Montgomery, a journalist for CityLab, told FiveThirtyEight that 11 states could be classified as mostly rural, while an additional 17 could be classified as a mix of rural areas and suburbs. The former are worth a combined 53 electoral votes, while the latter are worth a combined 138; 270 are needed to win a presidential election.
None of this means that Trump lacks a path to electoral victory. It’s still early in the 2020 campaign; approval ratings may change, and a person’s feelings about the president aren’t the only determinant of his or her vote. But those numbers aren’t great for Republicans even if institutions like the Electoral College give disproportionate influence to rural areas. Without urban and suburban areas, they’ll find it difficult to cobble together a sustainable majority.
Other polling nuggets
A YouGov poll found that only 26 percent of Americans either “strongly” or “somewhat” approve of the way Trump is handling the fallout from the killing of journalist Jamal Khashoggi. There was a sharp party divide in responses: 57 percent of Republicans approved, while only 6 percent of Democrats did.
59 percent of Americans today either “strongly” or “somewhat” approve of the way George H.W. Bush handled his presidency, from 1989 to 1993, according to YouGov. That includes 53 percent of Democrats and 77 percent of Republicans. You can see for yourself how Bush’s approval rating changed over the course of his presidency using our presidential approval rating tracker.
A Gallup poll taken in France earlier this year, before the riots in December over increased living costs, found that President Emmanuel Macron’s job approval had declined by double digits among the three poorest of France’s five income groups but remained virtually unchanged among the two richest groups.
Americans still prefer to watch the news instead of reading or listening to it, according to a study by the Pew Research Center: 47 percent of respondents said they preferred to watch the news, 34 percent said they preferred to read the news, and 19 percent said they preferred listening to it. These habits remained mostly unchanged from 2016. Among those who would rather watch the news, 75 percent said they preferred doing so on the television, while 20 percent said they preferred to watch online.
A poll conducted by The Research Moms, a group of researchers at Edison Research, found that only 15 percent of moms said they split parenting responsibilities evenly with another parent. Forty-three percent said they handle the majority of the parenting responsibilities, and 41 percent said they handle all the parenting responsibilities. The Research Moms surveyed mothers in the U.S. age 18 to 64.
According to a Quinnipiac poll of New York City voters, 57 percent of New Yorkers approve of Amazon locating one of its new headquarters in Queens, while 26 percent disapprove. But when respondents were asked about the $3 billion in tax breaks that Amazon will get from the city and state government as part of its deal to relocate, support was roughly split, with 10 percent unsure.
Support for Amazon is even higher in Virginia, where a second headquarters is planned. A poll by Christopher Newport University asked registered voters in the state whether they approve or disapprove of the announcement that Virginia would provide $573 million in incentives for an Amazon headquarters; 68 percent said they approve of the announcement, while 30 percent said they disapprove.
The masses have spoken, determining that “Die Hard” is not a Christmas movie. That’s according to a Morning Consult/Hollywood Reporter poll, which found that only a quarter of American adults considered the Bruce Willis vehicle a Christmas movie; 62 percent said it was not, and 13 percent said they didn’t know or had no opinion on this important matter.
Armenians go to the polls Sunday to participate in snap parliamentary elections, the first since the “non-violent velvet revolution” protests in April and May that resulted in the resignation of Prime Minister Serzh Sargsyan. An in-person survey of 1,100 voters conducted this week by an affiliate of the Gallup International Association in Armenia found that more than 69 percent of Armenians who plan to participate in elections said they would vote for the My Step alliance, led by current acting Prime Minister Nikol Pashinyan, followed by about 6 percent who said they would vote for the Prosperous Armenia Party. The Republican Party of Armenia, which had served as the ruling party, polled at less than 2 percent.
Trump approval
According to FiveThirtyEight’s presidential approval tracker, 42.1 percent approve of the job Trump is doing as president, while 52.3 percent disapprove (a net approval rating of -10.2 points). At this time last week, 42.4 percent approved and 52.6 percent disapproved (a net approval rating of -10.2 points). One month ago today, Trump had an approval rating of 41.8 percent and a disapproval rating of 52.8 percent, for a net approval rating of -11.0 points.
1 note
·
View note
Link
via Politics – FiveThirtyEight
Welcome to Pollapalooza, our weekly polling roundup.
Poll of the week
You know when you go see a good popcorn movie and the fun sidekick character doesn’t get nearly enough screen time, but then they announce a sequel that puts that character front and center? In politics, that’s Gary Johnson. The former two-term Republican governor of New Mexico turned Libertarian presidential candidate got 3.3 percent of the popular vote in the 2016 election — more than 4 million votes — but it seemed like that would be the last we’d hear from him. But fortunately for Johnson superfans, that’s not how it worked out: After the Libertarian candidate in New Mexico’s U.S. Senate race dropped out last month, the New Mexico Libertarian Party drafted Johnson into the race.
The field was particularly inviting for Johnson because the GOP wasn’t taking this race that seriously. The only Republican on the primary ballot was Mick Rich, an Albuquerque contractor who had never run for office before. That, plus Johnson’s residual name recognition in the Land of Enchantment, has raised the possibility that Johnson, not Rich, could be the main threat to topple Democratic Sen. Martin Heinrich this fall.
And so our poll of the week is an Emerson College survey released Monday suggesting exactly that. Heinrich led the poll, conducted Aug. 17-18 among 500 registered voters, with 39 percent, but Johnson came in second with 21 percent. Rich received 11 percent, and 30 percent were still undecided. Crucially, Emerson found that the secret to Johnson’s success was that he had surpassed Rich as the choice of both Republicans (Johnson led Rich 27-25 among GOP voters) and independents (Johnson led Rich 25-7 among independents, with Heinrich receiving 32 percent). Probably in order to counter this narrative, the next day Rich’s campaign released its own poll of the race that claimed Heinrich led Rich “only” 41 percent to 34 percent, with Johnson way back at 19 percent.
If Johnson were to pull off the unlikely win, he would be the first Libertarian in U.S. history to win a major statewide election. But even if the Rich poll’s pessimistic-for-Johnson view of the race is correct, that would still make Johnson one of the most successful Libertarian candidates in history. In top-of-the-ticket races1 since the party’s founding in 1971, Libertarians’ best performance at the ballot box has been Joe Miller’s 29 percent in the 2016 U.S. Senate race in Alaska. (Hat tip to Eric Ostermeier of Smart Politics for doing much of this research.)
The strongest Libertarian Party candidates in history
Libertarian candidates for president, Senate and governor who have exceeded 8 percent of the vote in any state
Candidate Office State Year Vote share Joe Miller U.S. Senate Alaska 2016 29% Michael Cloud U.S. Senate Mass. 2002 18 Dick Randolph Governor Alaska 1982 15 Steve Osborn U.S. Senate Ind. 2006 13 Carla Howell U.S. Senate Mass. 2002 12 Ed Clark President Alaska 1980 12 Ed Thompson Governor Wisc. 2002 10 Gary Johnson President N.M. 2016 9 Steven Rosile U.S. Senate Kan. 2002 9
Sources: Smart Politics, Clerk of the U.S. House of Representatives, Associated Press, Ballotpedia, Dave Leip’s Atlas of U.S. Presidential Elections
There are certain states that seem particularly predisposed toward Libertarians: Alaska, with its isolation-driven libertarian streak, and Massachusetts, with its sympathy to third-party candidates broadly. New Mexico appears on the list, but only because of Johnson himself: It was his best state in 2016, but he’ll have to improve upon his 9 percent showing this time around if he wants to win his Senate race. On the positive side for him, it definitely looks like the Libertarian Party is gaining influence: The party’s candidates rarely cracked 8 percent in its first few decades of existence, but they’ve picked up steam in elections this century.
But finally, there’s a big caveat to this list: Three of the names are only on this list because one of the major parties sat out that race. Michael Cloud was able to get 18 percent of the vote in the Bay State’s 2002 U.S. Senate race against John Kerry, but Kerry had no Republican opponent, so Cloud was his main opposition. Steve Osborn and Steven Rosile, meanwhile, ran in elections where there was no Democratic nominee. That hints at the single biggest factor that could boost Johnson’s chances in New Mexico this year: if Rich drops out to consolidate the anti-Heinrich vote. So far, he has shown no inclination to do so.
Other polling nuggets
A Marist College poll of Texas found Democrat Beto O’Rourke only 4 percentage points behind incumbent Republican Sen. Ted Cruz. That’s one more in a series of polls this month that shows O’Rourke within single digits of Cruz in a state where Senate races in the past few decades have ended in double-digit margins of victory for Republicans. Still, Cruz is ahead in every poll of the race so far this year.
A Fox News poll found that 59 percent of respondents approve of special counsel Robert Mueller’s investigation of the Trump campaign’s ties to Russia. That’s up from 48 percent in July and 55 percent in June. Republican approval of the investigation stayed steady at about 25 percent.
New Jersey Democratic Sen. Bob Menendez led his Republican opponent, Bob Hugin, by 6 points, 43 to 37, according to a Quinnipiac University poll. About half of respondents (including 38 percent of Democrats) said they believe Menendez, who is running for re-election after his trial on corruption charges ended in a hung jury, was involved in serious wrongdoing.
A Wisconsin poll from Marquette University showed close races for governor and Senate. The poll found incumbent Republican Gov. Scott Walker running even with Democrat Tony Evers at 46 percent, and Democratic Sen. Tammy Baldwin just 2 points ahead of Republican challenger Leah Vukmir, 49 percent to 47 percent.
While a Quinnipiac poll this month found that 9 percent of black voters approve of President Trump and a Gallup poll from last month found that 13 percent do, a recent Rasmussen Poll put Trump’s approval rating among African-Americans at 36 percent. While it is possible that Trump has made small gains among black voters since his election, it is highly unlikely that the true level of his support among black voters is anywhere close to a third given the number of more transparent and reputable polls that say otherwise.
Just over half of Americans said in a Monmouth poll this week that, all else being equal, they would be more likely to support a candidate for Congress who is a political outsider, compared to a quarter who said they would prefer a political insider.
26 percent of white respondents said in a YouGov poll that they have used the N-word to refer to a black or African-American person while 66 said they have not. (Keep in mind: These numbers may be thrown off by the fact that some people likely don’t want to admit to a pollster that they’ve used that word.)
The Miss America organization announced in June that it is ending its swimsuit competition and replacing it with an interview segment. Sixty-seven percent of women said they either somewhat or strongly support the decision, but only 43 percent of men said the same, according to a Morning Consult poll.
68 percent of Americans, including 68 percent of Republicans and 79 percent of Democrats, approved of cancelling this year’s planned military parade due to high costs, according to a YouGov poll.
Trust in media may be up, according to a study by the Poynter Institute that included polling by YouGov.
45 percent of Americans said in a Monmouth University poll that they think the charges against former Trump campaign chairman Paul Manafort suggest there may be widespread illegal activity among staff in the White House. That number, predictably, breaks down along partisan lines, with 19 percent of Republicans and 68 percent of Democrats saying that the charges suggest widespread illegal activity.
Morning Consult tested a variety of possible Democratic contenders for a 2020 run for president against Trump and found that Bernie Sanders and Joe Biden topped the list of those who would fare the best.
Only 15 percent of Russians believe that their government tried to influence the 2016 U.S. presidential election, according to a Pew Research survey, while 71 percent believe it did not. The poll also found that 72 percent of Russians think their country plays a more important role in the world than it did 10 years ago, up from 59 percent who thought so last year.
Trump approval
Trump’s net approval rating currently sits at -10.9 points, according to our tracker. (That’s a 42.1 percent approval rating and a 53 percent disapproval rating.) One week ago, his net approval was -10.3 points; 42.1 percent approved of Trump’s job performance, and 52.4 percent disapproved. At this time last month, that net approval was -11.1 points — 41.8 percent approval, 52.9 percent disapproval. Plus ça change …
Generic ballot
Per our tracker of generic-ballot polls, Americans currently opt for the Democratic House candidate over the Republican by a 7.8-point margin (47.8 percent to 40 percent). One week ago, their lead was a similar 7.8 points (47.7 percent to 39.9 percent). At this time last month, our tracker sat at Democrats 48.1 percent, Republicans 40.6 percent, or a 7.5-point Democratic advantage. In other words, the national environment has been pretty steady too.
Check out our 2018 House forecast and all the polls we’ve been collecting ahead of the midterms.
1 note
·
View note
Last Seen Blogs

wexking89aa
WEXKING89 > VVIP

bsd-disability-week-2024
Bsd Disability Week

heiseinbtch
NORTHERN LIGHTS

ichea-it
A.A.A. Compro Tempo

crymeashovel
Untitled