#KimBurns
Text
2019 Home Buyers And Sellers Generational Trends

2019 Home Buyers And Sellers Generational Trends.
Since 2013, the National Association of REALTORS® has produced the Home Buyers and Sellers Generational Trends Report.
This report provides insights into differences and similarities across generations of home buyers and home sellers. The home buyer and seller data is taken from the annual Profile of Home Buyers and Sellers.
Click HERE to download the report.
* Younger Millennials are broken out in this report—at 11 percent they are now a larger home buyers group than the Silent Generation (7 percent).
* Millennials overall remain the largest generation of buyers.
* 1 in 4 Younger Boomer and Silent Gen buyers are single females.
* Older Millennials are most likely to have children under the age of 18 in the home at 69 percent.
* Gen Xers are now most likely to buy a multi-generational home at 16 percent.
* Younger Millennials purchase homes through agents, with the highest share of any generation at 92 percent.
If you are thinking about buying or selling we can help you understand how to use this report to your advantage.
Burns & Bertha - Changing Lives - Red Line Investors - © 2019
www.DiscoverSuncoastHomes.com
Report reproduced with the permission of the National Association of REALTORS®.
Read the full article
1 note
·
View note
Text
March 2020 Real Estate Activity In Sarasota Manatee
March 2020 Real Estate Activity In Sarasota Manatee
Sarasota and Manatee single family home, condo and townhome sales - including distressed sales.
Residential Sales Rise While Market Slowdown Begins.
The March housing market transitioned from a soaring spring season to a slowdown in activity when COVID-19 concerns began to rise mid-month. Most pending sales from the previous month became closed sales in March with an 8.3 percent rise in closed sales for both markets in Sarasota and Manatee. Fewer properties were added to the market in March, which was expected during the coronavirus pandemic.
Closed sales in Sarasota and Manatee totaled 2,249 in March 2020, a 31.5 percent increase from the previous month, February of 2020. Year-over-year, Sarasota condo sales increased by 15.5 percent to 454 sales and single-family sales increased by 7.2 percent to 834 sales in Sarasota County. Manatee condo sales increased by 9.8 percent to 303 sales and single-family homes increased by 4.6 percent to 658 sales.
Median prices continue to rise across the two-county area. Single-family home prices increased by 2.4 percent to $319,500 in Manatee and increased by 10.5 percent to $315,000 in Sarasota. Condo prices increased by 5.7 percent to $215,000 in Manatee and increased by 7.5 percent to $245,000 in Sarasota.
For the condo market, new listings decreased by 5.2 percent in Manatee and by 1 percent in Sarasota. Single-family new listings decreased by 3.3 percent in Manatee and decreased by 11.4 percent in Sarasota.
As expected, pending sales experienced a decrease in both markets in both counties. Combined for Sarasota and Manatee, single-family pending sales decreased by 32.9 percent and condo pending sales decreased by 39.5 percent.
Year-over-year, the combined inventory in both markets decreased by 16.8 percent. Singlefamily home inventory decreased by 14.1 percent in Manatee and by 22 percent in Sarasota. Condo inventory in Manatee decreased by 3.8 percent, while Sarasota decreased by 17.9 percent.
The month's supply of inventory also declined in response to shrinking inventory and a rise in sales this month. Sarasota condo inventory declined by 28.1 percent to a 4.6-months' supply and Manatee condos decreased by 8.3 percent to a 4.4-months' supply. Sarasota single-family homes decreased by 30.2 percent to a 3.7-months' supply and Manatee fell by 19 percent to 3.4-months.
Download the complete March Sarasota/Manatee real estate summary by clicking HERE.
Information courtesy of Ed Bertha Kim Burns, Red Line Investors dba Burns & Bertha. DiscoverSuncoastHomes.com
Read the full article
#BurnsandBertha#DiscoverSuncoastHomes#EdBertha#KimBurns#ManateeRealEstate#RedLineInvestors#SarasotaRealEstate
0 notes
Photo

Here is the first #FeatureFilm that eYe @venusleone was hired to do all of the #sounddesign and #rerecordingmix winning Carlie Sheen style (...winning over here, winning over there...”) - created, directed and edited by #BrazilianWomen (I’m just half, but I’m totally taking the credit) 🥇 #femalefilmmakerfriday #filmsound #postproduction #womeninmedia #thejtclist #soundengineer #soundgirl #venusleone #RepostPlus @juliamca - - - - - - #Repost @oliverrayon with @get_repost ・・・ Congrats to the IN TRANSIT team!! Branca Ferrazo as Olga. Oliver Rayón as Daniel. Kim Burns as Nancy. Director: Júlia Câmara. Editor: Tati Leite. Composer: Tamara Douglas-Morris 💻 🎥 #InTransitFilm #Cinema #Drama #Humor #experimentalfilm #hollywoodfilm #EntrepreneurLife #Filmmaking #JuliaCamara #JúliaCâmara #BrancaFerrazo #KimBurns #OliverRayon #OliverRayón #TatiLeite #TamaraDouglasMorris @chicanadirectorsinitiative @awd_directors (at Hollywood) https://www.instagram.com/p/ByJe32dpoI7/?igshid=zdevgngtg641
#featurefilm#sounddesign#rerecordingmix#brazilianwomen#femalefilmmakerfriday#filmsound#postproduction#womeninmedia#thejtclist#soundengineer#soundgirl#venusleone#repostplus#repost#intransitfilm#cinema#drama#humor#experimentalfilm#hollywoodfilm#entrepreneurlife#filmmaking#juliacamara#júliacâmara#brancaferrazo#kimburns#oliverrayon#oliverrayón#tatileite#tamaradouglasmorris
0 notes
Text
Commercial For Lease 5670 Jason Lee Place Sarasota FL 34233
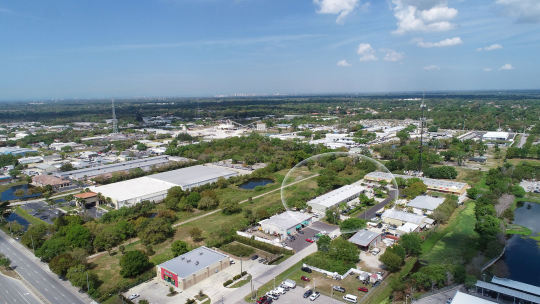
Presenting 5670 Jason Lee Place Sarasota FL 34233.
Just Listed - For Lease.
5670 Jason Lee Place is a warehouse, storage facility, light manufacturing building located in Sarasota, off of Clark Road and less than 2 miles from I-75. 3 bays are available for lease; unit 2 -1,500sf, unit 4 - 1,500sf and unit 5 - 2,000sf. All bays have 10' high garage doors in the rear.
Available Space for lease:
Unit 2 1,500 sq ft AVAILABLE AUGUST 1, 2020
Unit 4 1,500 sq ft AVAILABLE FOR LEASE NOW
Unit 5 2,000 sq ft AVAILABLE SEPTEMBER 1, 2020
The building was just painted and the roof brought up to like new standards.
Stellar MLS A4468635
5670 Jason Lee Place
Sarasota FL 34233
Priced Upon Request for Lease
Warehouse, Storage, Light Manufacturing
Building Area 13,500 sq ft
Property Type Industrial
No. Stories 1
Property Sub-type Manufacturing
Zoning ILW Industrial Light & Warehousing
Year Built 1986
Building Class C
Parking Ratio 1.7/1,000 sq ft
Lot Size 1.04 acre
Google Maps click HERE
Represented by:
Ed Bertha
Red Line Investors
2707 Barnard Road
Bradenton, FL 34207
(941) 921-2117
[email protected]
Burns & Bertha - Changing Lives - Red Line Investors - © 2020
www.DiscoverSuncoastHomes.com
Read the full article
0 notes
Text
Commercial For Sale Lease 5670 Jason Lee Place Sarasota FL 34233

Presenting 5670 Jason Lee Place Sarasota FL 34233.
Just Listed - For Sale/Lease.
5670 Jason Lee Place is a warehouse, storage facility, light manufacturing building located in Sarasota, off of Clark Road and less than 2 miles from I-75. Built in 1986, this property encompasses 13,500 sq ft, features 6 bays and is set on a 1.04 acre lot. All bays have high garage doors in the rear and the two end units (4 total) have high garage doors in the front also.
Existing layout:
Unit 1 3,237 sq ft
Unit 2 1,500 sq ft
Unit 3 1,500 sq ft
Unit 4 1,500 sq ft AVAILABLE FOR LEASE
Unit 5 2,000 sq ft
Unit 6 3,663 sq ft
The building was just painted and the roof brought up to like new standards.
Stellar MLS A4468635
5670 Jason Lee Place
Sarasota FL 34233
Priced Upon Request Lease/Purchase
Warehouse, Storage, Light Manufacturing
Building Area 13,500 sq ft
Property Type Industrial
No. Stories 1
Property Sub-type Manufacturing
Zoning ILW Industrial Light & Warehousing
Year Built 1986
Building Class C
Parking Ratio 1.7/1,000 sq ft
Lot Size 1.04 acre
No. Drive In / Grade-Level Doors 13
2019 taxes $11,610.29
Sarasota County Property Appraiser Record click HERE
Google Maps click HERE
Represented by:
Ed Bertha
Red Line Investors
2707 Barnard Road
Bradenton, FL 34207
(941) 921-2117
[email protected]
Burns & Bertha - Changing Lives - Red Line Investors - © 2020
www.DiscoverSuncoastHomes.com
Read the full article
#5670JasonLeePlace#BurnsandBertha#CommercialForLease#CommercialForSale#DiscoverSuncoastHomes#EdBertha#KimBurns#RedLineInvestors
0 notes
Text
Cap Rates - The Truth

The Truth About Cap Rates.
5 Myths Busted.
A lot of what you read about cap rate is simply wrong. I’m here to dispel the myths and tell you the real story.
Perhaps no topic is more overrated, misunderstood, or debated than cap rate. I would also argue that cap rate has more inaccurate or misinformed articles written about it than pretty much any other topic on real estate, but no one wants to listen to me argue.
Instead, why not just forget everything you’ve read about it, and start from scratch here?
Cap Rate Definition
Cap rate is short for “capitalization rate,” which is a mathematical formula used by appraisers to measure the value of income-producing real estate. Because it’s impractical to compare one income-producing property to another the same way you can with tract homes, a different method was needed to gauge value. Cap rate became the most widely accepted measurement.
Cap rate is calculated by dividing the net operating income (NOI) by the property’s purchase price (or sale price, depending on which side of the table you are sitting on).
For example, if the property produces $100,000 of NOI and is purchased for $1 million, the cap rate is 10%. If the purchase price is $2 million, the cap rate is 5%.
NOI is income minus operating expenses. Debt service payments and capital improvement costs are ignored for the purpose of this calculation.
NOI / (Purchase Price) = Cap Rate $100,000 / $1,000,000 = 10% Cap Rate
Commercial real estate investors have an odd love affair with cap rate, which leads to all sorts of opinions on what cap rate is and what it means for their investment strategy. Here’s a list of some common statements I hear and read about cap rate:
“Cap rate is equivalent to the return I receive if I pay cash for the property.”
“I need to buy at a high cap rate to get the returns I’m looking for.”
“A high cap rate means I’m getting a better deal.”
“If interest rates rise by 1%, cap rates have to increase by 1%, too.”
“I bought the property at a 5% cap rate and turned it into a 10% cap rate!”
What do these five statements about cap rate have in common?
They are all wrong. Yes, every one of them.
Myth Busted: The All-Cash Return
I wish people would stop saying, “Cap rate is the return you get if you paid all cash.” It is not.
Here are two ways that this is wrong:
I once bought a property that was around 300 units. The previous owner had their eye completely off the ball and hadn’t kept their rental rates up with the market. The day we closed escrow, our new management team arrived at the office to take over. Each time a new prospect walked in the door, we raised the quoted rent $25. We did this all day until the first person said no.
It took five prospects, so we immediately had a $125 increase in new leases on the first day. It would only be a matter of time before the entire property cycled to the higher rate.
Did that affect our return? You bet it did. So much for cap rate telling us anything about our expected return.
Even if we hadn’t done that, to buy the property, we would have needed to inject additional cash to close the purchase. Closing costs, title insurance, legal fees, immediate capital improvements to correct deferred maintenance—you name it. The price we paid was not the cash we would spend.
Cap rate is net operating income divided by purchase price. Our purchase price was less than the cash outlay, so this misconception of cap rate fails for a second time.
Myth Busted: Higher Cap Rates Mean Higher Returns
Reflecting on our second incorrect statement about cap rate, “I need to buy at a high cap rate to get the returns I’m looking for,” consider these two examples:
Example 1: An 8% cap rate on a stabilized property in a stagnant market with no rent growth, no job growth, a slowly declining population, and no ability to push rents with renovations.
Example 2: A 6% cap rate in a market with above-average population growth, job growth, and income growth with stable occupancy and high rent growth. The property is underperforming relative to nearby comps. With some minor cosmetic improvements, rents can be increased 20% on each unit that is rented to a new resident in upgraded condition.
In nearly every case, over the long-term, example 2 will outperform example 1 despite example 1’s higher cap rate.
Myth Busted: High Cap Rates Mean a Good Deal
“A high cap rate means I’m getting a better deal.” This statement by itself is false.
Our examples above illustrate this point across two different markets, but even within the same market you could have a property selling at an 8% cap rate that could be a worse deal than another property in the same market selling at a 6 percent cap rate.
Example 1: An 8% cap rate on a 50-year-old property in which all the interiors have been recently renovated and the seller has pushed the rents to $25 higher than the comps. The property doesn’t need a thing; it is totally turnkey.
Example 2: A 6% cap rate on a 20-year-old property that hasn’t been touched since it was built, except that the owner just put on a new roof. Interiors are original, rents are $150 below market, and renovated comps are getting $100 more than the non-renovated comps.
Example 2 is more likely to be a better deal despite the lower cap rate. There’s nothing you can do to push the income in example 1; it’s been pushed as far as it can go. And example 1 is 50 years old. So despite the upgrades, the maintenance bills are likely to increase substantially over time. There could also be big-ticket items in your future, such as a new roof, foundation repairs, new windows, and new heating and cooling systems. The list goes on and on.
But in example 2, you have multiple opportunities to increase income. The low-hanging fruit is just bringing the rents to market rate, in line with non-renovated comps. Then you have the option to go to the next level by performing minor interior cosmetic improvements to push rents further toward the level of the renovated comps in the area.
Myth Busted: Rising Interest Rates Mean Rising Cap Rates
It is often thought that cap rates move when interest rates move. You might hear people say things like, “If interest rates rise by 1%, cap rates have to increase by 1%, too.” There are two concepts at play that give people reason to believe this.
Investment return
The thinking is that if someone can invest in risk-free treasury bonds at 3% interest, why would they invest in real estate at a 4.5% cap rate? There isn’t enough of a risk premium to justify investing in real estate at such a low yield.
Hopefully by now you already see why this argument is a red herring. Cap rate is not a measurement of investment return; it is a measurement of market sentiment. Under the right conditions, it’s entirely possible to capture a 20% return from a 4% cap rate property. As a result, comparing risk-free yields to real estate cap rates is like comparing airplanes to submarines.
Borrowing costs
The thinking here is that if interest rates rise, it costs more to borrow money. Therefore, you have to buy at a correspondingly higher cap rate in order to preserve investment returns. There are two reasons why this usually isn’t true.
First, the debt represents only a portion of the purchase price, such as 65-75%—and in many cases even less—and the remainder of the purchase price is cash. This mutes the effect of a higher interest rate on the borrowed money to some extent.
Second, if interest rates are increasing, it is also likely that the economy has momentum and perhaps inflation. Rents tend to rise during inflationary times, which in turn increases the income from the property—perhaps to an even greater extent than the increased borrowing cost takes from it.
The bottom line is that cap rates compress and decompress at the whim of market sentiment. When real estate becomes less popular, prices go down, which means cap rates go up. When real estate is highly sought after, prices go up, which means cap rates go down.
Cap rates can also move when outside factors alter investment returns. For example, if rent growth slows or operating expenses go up, the only way to achieve the same desired investment return is to pay a lower price for the property, which means buying at a higher cap rate. Interest rates are only one of the many inputs in solving for returns. Higher borrowing costs will certainly have an effect, but interest rates and cap rates don’t move precisely in parallel.
Myth Busted: Forcing the Cap Rate
Here’s another funny statement I hear often: “I bought the property at a 5 cap and took it to a 10 cap!”
Someone might be inclined to boast this claim if, for example, they bought a property that historically threw off $100,000 NOI for $2 million (a 5% cap rate) and then they were subsequently able to increase the NOI to $200,000. But this claim fails from two directions.
First is that cap rate is simply a measure of market sentiment, so “taking a 5 cap and making it a 10 cap” means that they just destroyed the market and lowered their property’s value by 50%. Remember, cap rate isn’t about their property; it’s what the market is willing to pay for an income stream.
They alone can’t move the whole market, so they alone can’t move the cap rate. No matter what they did to the income later, they still bought $100,000 of historical NOI for $2 million, and that will always be a 5% cap rate.
The second reason this statement fails is that they undoubtedly had to invest capital into the property by making physical improvements to drive the revenue higher. Boasting about moving cap rate (which is calculated using only the purchase price) ignores the additional capital required to achieve the higher NOI. And of course, this says nothing of the fact that using post-acquisition NOI to calculate cap rate is bending the rules of the formula itself.
What anyone making this claim should be talking about is their yield on cost. This is similar to cap rate but more like a first cousin than a twin. To calculate it, divide the current NOI by the entire project cost, including purchase price, closing costs, sponsor fees, and capital improvements.
Using the property from the example above, let’s say that $1 million was spent on closing costs, fees, and improvements, bringing the total project cost to $3 million, and the NOI grew from $100,000 to $200,000. In this case, they could claim that they bought the property at a 5 cap and after they stabilized it, they brought the yield on cost to 6.7%.
This doesn’t sound as sexy as claiming they “made it a 10 cap,” but at least they’d be telling an accurate story.
And here’s one more thing: It is entirely possible to double a property’s income and add no value at all. In the above example, if $2 million was spent on closing costs, fees, and improvements, the total project cost would be $4 million. Doubling the NOI to $200,000 results in a 5% yield on cost. If the market cap rate is still 5%, the property is worth exactly what was spent on it—there was no value added. Even if someone claims that they “brought the 5 cap to a 10 cap”—they really did nothing at all.
Article courtesy of Brian Burke, President/CEO of Praxis Capital, Inc.
For Specific Information contact Ed Bertha at (941) 921-2117 or [email protected]
Burns & Bertha - Changing Lives - Red Line Investors - © 2020
www.DiscoverSuncoastHomes.com
Read the full article
0 notes
Text
Coronavirus And America's $25 Trillion Debt Explosion

Coronavirus And America's $25T Debt Explosion, A Visualization.
In April 2020, the national debt hit an eye-popping $25 trillion, coming off the back of a $2.2 trillion stimulus passed by the U.S. Congress. The projected annual deficit for this year alone is almost $3.7 trillion -- over triple what it was the year prior.
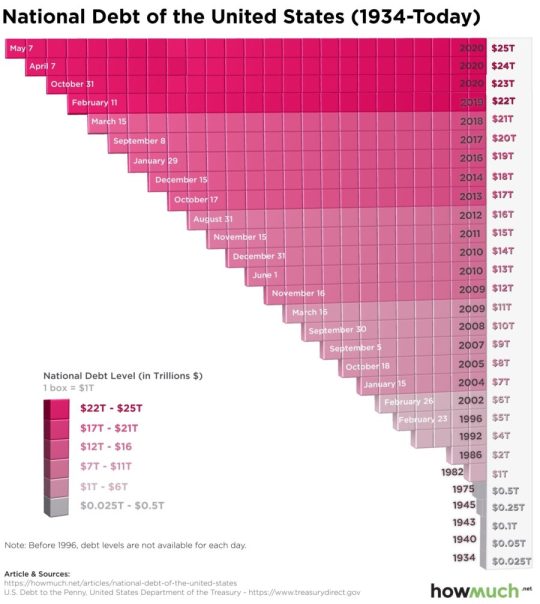
Recently, The Balance published an article noting major milestones in the accumulation of national debt, using data from the ”U.S. Debt to the Penny” report from the United States Department of the Treasury. We used the information compiled by The Balance to create our latest visualization, which shows how much the national debt has grown since 1934. Prior to 1996, the visualization only uses years but not the exact dates because debt levels are not available for each day. Each box in the visualization is equal to $1 trillion.
In 1934, the national debt was only $25 billion. It began increasing rapidly in the 1980s, reaching $1 trillion in 1982 and ballooning throughout the 1990s and 2000s.
Just as with household debt, the national debt increases when spending outpaces revenue. In the case of the government, the majority of revenue comes from taxes levied on personal and corporate income. To amass more funds (which results in accruing debt), the federal government issues treasury bills, notes, and bonds to creditors.
The national debt is composed of two main categories: intragovernmental debt and debt held by the public. Intragovernmental debt is held by federal agencies, such as the Social Security Trust Fund and Medicare. For debt held by the public, the creditors are individuals, corporations, state or local governments, Federal Reserve Banks, foreign governments, and other entities outside the United States government. About two-thirds of the national debt is classified as debt held by the public.
Acquiring too much debt can have a negative effect on a number of economic factors, including slower economic growth, lower stock market returns, and decreased confidence in the U.S. government’s ability to repay its debt. Currently, the debt-to-GDP ratio in the U.S. is 106%, above the World Bank’s recommendation of 77%. The higher the ratio, the greater the risk of default. This makes it more imperative than ever to rein in the national debt and get the government’s “checkbook” under control.
Information courtesy of HowMuch.net.
Ed Bertha
(941) 921.2117
[email protected]
Burns & Bertha - Changing Lives - Red Line Investors - © 2020
www.DiscoverSuncoastHomes.com
Read the full article
0 notes
Text
April Listings Down

New Home Listings In April Cut In Half.
As stay-at-home orders increased across the nation last month, it translated into a lack of homes for sale.
New listings fell 44.1% in April, asking prices flattened and homes are staying on the market longer, according to a new report from realtor.com.
As the report says, the Northeast was hit hardest by the pandemic and also saw the greatest decline in new listings – a whopping 59.4%. The rest of the U.S. didn’t stray too far off, as the Midwest saw another 49.5% decline, a 44.1% decline in the West and a 31.4% decline in the south.
This makes the total number of homes for sale across the U.S. down 15.3% year over year, with April’s drop in inventory amounting to a 189,000 loss of listings compared to this time last year.
According to realtor.com, within the 50 largest U.S. metros, inventory declined 16% year over year with the biggest declines seen in the Milwaukee-Waukesha-West Allis, Wisconsin metro (down 46.1%); Philadelphia-Camden-Wilmington, Pennsylvania-New Jersey-Delaware-Maryland metro (down 38.7%); and Providence-Warwick, Rhode Island-Massachusetts metro (down 29.3%).
For specific information contact Ed Bertha at (941) 921.2117 or [email protected]
Burns & Bertha - Changing Lives - Red Line Investors - © 2020
www.DiscoverSuncoastHomes.com
Read the full article
0 notes
Text
Countries Manufacturing Output

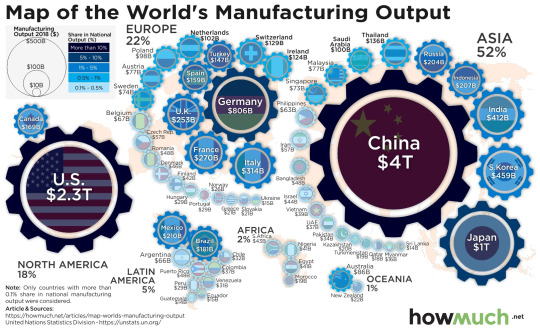
Mapping Countries Manufacturing Output:
China's Superpower vs. the World.
In 2016, then-candidate Donald Trump said on the campaign trail, "My plan includes a pledge to restore manufacturing in the United States." Manufacturing has remained a major emphasis of Trump’s presidency, perhaps never more so than during the coronavirus pandemic, with the invoking of the Defense Production Act. So, what is the state of the U.S., and the global, manufacturing industry?
- The $2.33 trillion U.S. manufacturing sector made up 11.6% of the country’s economic output in 2018.
- U.S. factory production shrank by 1.3 percent in 2019.
- While half a million manufacturing jobs have been added during the Trump administration, job growth in the Midwest remains sluggish.
- Chinese manufacturing expanded slightly in March, as factories slowly came back online after the coronavirus shutdown.
The data comes from the United National Statistical Division and is plotted as a map. Only countries with more than a 0.1% share of national manufacturing output were considered. A larger gear wheel indicates a larger manufacturing output, and a darker shade of blue indicates a larger share of manufacturing as related to total national output.
Top 5 Countries with the Biggest Manufacturing Output
1. China: $4T (28.37% of world total)
2. United States $2.3T (16.65% of world total)
3. Japan: $1T (7.23% of world total)
4. Germany: $806B (5.78% of world total)
5. South Korea: $459B (3.29% of world total)
Much of President Trump’s focus on manufacturing has laid with China: in August 2019, Trump ordered U.S. companies to begin looking for an alternative to manufacturing in that country. Calls for decreased dependence on Chinese manufacturing have intensified with the coronavirus outbreak, as lawmakers have questioned the natural security implications of relying heavily on a foreign country for essential supplies like pharmaceuticals.
While new data indicates that U.S. companies are indeed shifting production from China, the effects to the U.S. manufacturing economy remain unclear. Ironically, the manufacturing sector has been adversely impacted by tariffs on Chinese imports enacted by the Trump administration. As a whole, factory production in the U.S. shrank by 1.3 percent in 2019, a ten-year low.
All that said, manufacturing remains an essential component of U.S. GDP: at $2.33 trillion in 2018, it drove 11.6% of U.S. economic output, and comprise half of the country’s exports. And, while the sector is likely in for record lows during March amid the coronavirus pandemic, there may be hope for a speedy recovery from rival China’s manufacturing rebound: Chinese manufacturing expanded slightly in March as the country begins slowly rebounding from the coronavirus.
Unfortunately, other manufacturing giants have been slower to recover: the German manufacturing sector saw its steepest decline in over a decade in March, as did Korea. Meanwhile, Japanese manufacturers took a rare pessimistic view of their sector for the first time in seven years. This has led to the rare furloughing of workers at Nippon Steel, the world’s third-largest steelmaker.
Information courtesy of HowMuch.net.
Ed Bertha
(941) 921.2117
[email protected]
Burns & Bertha - Changing Lives - Red Line IInvestors - © 2020
www.DiscoverSuncoastHomes.com
Read the full article
#BurnsandBertha#Coronavirus#COVID-19#DiscoverSuncoastHomes#EdBertha#KimBurns#RedLineInvestors#WorldwideManufacturingOutput
0 notes
Text
April 2020 Sarasota Manatee Real Estate Sales Snapshot
April 2020 Real Estate Activity In Sarasota Manatee.
Hot off the press. Snapshot of real estate sales activity for March 2020; single family & condos in Sarasota Manatee.
Download the report below.
Download the report HERE.
For Specific Information contact us at (941) 921-2117 or [email protected]
Burns & Bertha - Changing Lives - Red Line Investors - © 2020
www.DiscoverSuncoastHomes.com
Data courtesy of Stellar MLS.
Read the full article
#BurnsandBertha#DiscoverSuncoastHomes#EdBertha#KimBurns#ManateeRealEstate#RedLineInvestors#SarasotaRealEstate
0 notes
Text
Securities Held By The Federal Reserve Banks
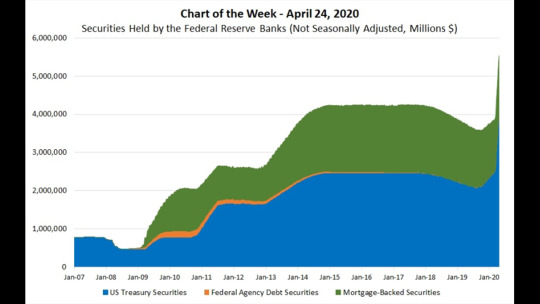
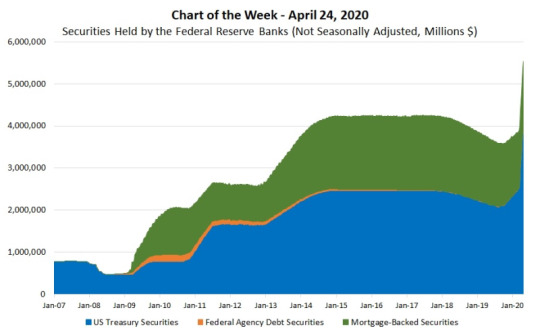
Securities Held By The Federal Reserve Banks.
This week’s MBA Chart of the Week shows the evolution of the securities held outright by the Federal Reserve Banks since 2007.
Between the summer of 2007 and November 2008, the Fed intermittently redeemed and sold Treasuries to offset the reserve-adding effects of credit operations, and it held less than $500 billion in securities going into 2009.
Historically, the outright purchases or sales of securities was a tool to manage the supply of bank reserves to maintain conditions consistent with the federal funds target rate set by the Federal Open Market Committee (FOMC). Starting with the Great Recession, however, the Fed has since employed multiple rounds of unconventional policy measures.
Source: Board of Governors of the Federal Reserve System
Between late 2008 and 2014, the FOMC authorized three rounds of large-scale asset purchase programs to ease its stance of monetary policy – often referred to as quantitative easing – and a maturity extension program, which lengthened the maturity profile of the Fed’s holdings of Treasury securities. Starting in October 2017 (when the Fed held $4.25 trillion in securities), the FOMC began to reduce its securities holdings to normalize the size of its balance sheet. Heading into 2020, the Fed held $3.75 trillion in securities.
On Sunday, March 15 (perhaps ominously on the Ides of March), the FOMC brought back the unconventional policy of quantitative easing (“QE4”) by directing the New York Fed’s Open Market Trading Desk to purchase at least $500 billion in Treasury securities and at least $200 billion in mortgage-backed securities. Since then, the Fed has taken additional actions to support the flow of credit to households, businesses, and the overall U.S. economy during these unprecedented times. As of April 22, the securities held by the Fed has reached $5.53 trillion.
We expect that at the FOMC’s next meeting on Wednesday, April 29, they will outline the pace of purchases over the next several weeks. Given that MBS markets have become more stable, we anticipate that they will continue to reduce the pace of purchases. Through the course of this year, while we expect a modest increase in Treasury rates, we think mortgage rate and Treasury spreads will decline, leaving mortgage rates little changed. With rates at or near record lows, this support from the Fed should keep the refinance wave going at least through the third quarter of this year.
Article courtesy of Edward Seiler, Mortgage Bankers Association.
To Sell, Buy or Invest contact Ed Bertha at (941) 921-2117 or [email protected]
Burns & Bertha - Changing Lives - Red Line Investors - © 2020
www.DiscoverSuncoastHomes.com
Read the full article
0 notes
Text
COVID-19 And Commercial Building Health
Why COVID-19 Raises The Stakes For Healthy Buildings.
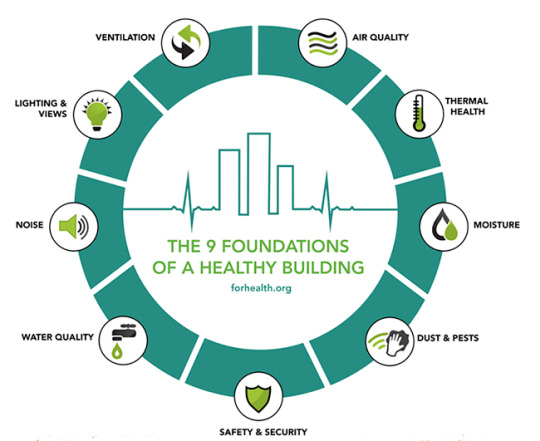
"Like it or not, humans have become an indoor species, so buildings have a major impact on our health. That's why the Healthy Building Movement is gaining momentum," say John Macomber and Joseph Allen.
Will you ever again step onto a crowded elevator without hesitation? Reach for a doorknob without concern (or gloves)?
Easing social distancing restrictions might reopen businesses, but as long as memories of COVID-19 lockdowns are still fresh in people’s minds, the experience of being inside an office building most likely will not return to “normal.”
Even before the pandemic struck, there were plenty of reasons to be concerned about air quality and ventilation in the buildings where we live and work. After all, healthier indoor environments don’t just keep us from getting sick—they also enhance cognitive performance.
“OFFICES WITH THE PREMIER HEALTH STORY WILL GET THE PREMIUM RENT AND GET THE TENANTS, AND THE OFFICES WITH A LAGGING HEALTH STORY WILL LAG.”
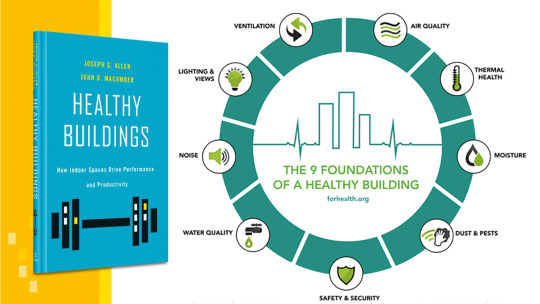
To convey to managers the benefits of the healthy building movement, John D. Macomber, a senior lecturer at Harvard Business School, recently wrote a book about it: Healthy Buildings: How Indoor Spaces Drive Performance and Productivity, published April 21, 2020.
Although facilities managers might think they’re saving a few dollars on electricity and air filters, “There's just no reason anymore to economize on airflow and filtration,” Macomber says. “That just doesn't make any sense. It's a cheap way to help people be healthier.”
Together with co-author Joseph G. Allen, a professor at Harvard’s T.H. Chan School of Public Health, Macomber explores “nine foundations for a healthy building” and studies how simple tweaks to increase air flow and quality can have dramatic effects on workers.
But the economic benefits don’t stop there. Macomber expects that a growing public focus on health measures will drive major changes across a variety of industries, but especially in travel and hospitality. Increasingly, Macomber postulates, savvy business leaders and landlords will begin to leverage healthier indoor spaces as recruitment tools and sources of competitive advantage. Anxieties over COVID-19 are likely to accelerate these trends, he says.
“I think awareness is heightened, and in this economy there'll be a drop in demand for space, both for apartments and offices,” he says. “With those two things together, I think that the offices with the premier health story will get the premium rent and get the tenants, and the offices with a lagging health story will lag.”
Many elite companies already use their building’s efficiency or grandeur to send a signal to customers and workforce talent. As a result of the global pandemic, Macomber expects an emphasis on indoor air quality and other healthy building measures will diffuse through the rest of the economy.
As the country begins to return to work, concerns about the spread of infectious disease will “make it easier than ever to invest in the basics of a healthy building, notably around ventilation, air quality, water, moisture, and security,” says Macomber. “Those aren't expensive to begin with. So, I think those will propagate through pretty quickly, and they’ll be must-haves, because the cost is not relatively very high, and the benefit is extremely high.”
As anyone who has ever felt sleepy on a stuffy airplane can attest, poor ventilation impedes cognition. “Casinos figured this out a long time ago, pumping in extra air and keeping the temperature cool to keep you awake at the gaming tables and slot machines longer,” Allen and Macomber write.
But through scientific, double-blind studies of workers in offices with various levels of air quality and flow, in which the workers were compared with themselves to gauge differences in personal performance, the authors of Healthy Buildings can quantify these effects.
Across all nine dimensions of cognitive function, which include things like “strategy,” “focused activity level,” and “crisis response,” performance was dramatically improved when study subjects worked in the optimal conditions (with high rates of ventilation and low concentrations of carbon dioxide and other harsh compounds).
“Think about that for one second—simply increasing the amount of air brought into an office, something nearly every office can easily do, had a quantifiable benefit to higher-order cognitive function in knowledge workers,” Macomber and Allen write.
Macomber is careful, though, not to make the leap from enhanced performance to increased productivity, because productivity involves so many different factors.
Among the nine foundations for a healthy building (see graphic) is “security,” a term the authors expect will take on a broader meaning in a post-pandemic world. Building security will involve monitoring not just who enters and what they are physically carrying, but also what they might be carrying internally. In addition to metal detectors, infrared scanners at building entrances will take visitors’ temperatures, to help prevent the spread of viruses and other pathogens, similar to technology already in place at some airports.
As people begin to internalize the collective nature of public health, sharing of personal health and air quality metrics—using wearables and smartphones—could lead to new applications that provide real-time information about the conditions inside buildings. Imagine an app that does for public health what WAZE has done for traffic congestion, Macomber says.
“There is going to be substantially more awareness and interest on the part of the public, in terms of the quality of the spaces that they’re occupying, and they’ll be selective about their airplanes and about their cruise ships,” he predicts. “And pretty quickly they'll be selective about their apartments and their offices as well, and they'll share that information with other people.”
Article courtesy of Kristen Senz, Harvard Business School Working Knowledge.
For Specific Information contact Ed Bertha at (941) 921-2117 or [email protected]
Burns & Bertha - Changing Lives - Red Line Investors - © 2020
www.DiscoverSuncoastHomes.com
Read the full article
0 notes
Text
Active Versus Passive Immunity And COVID-19

Active Versus Passive Immunity And COVID-19.
Right now more than 450,000 people worldwide have reportedly recovered from COVID-19, and that number keeps ticking up. That's good news, of course; but just because someone has contracted and ultimately healed from the new coronavirus, doesn't mean they're entirely exempt from re-infection. That's where the issue of immunity comes into play—and currently, researchers and scientists still aren't sure what the body's immune response to SARS-CoV-2 is, and how long it might last.
For the most part, the word 'immunity' conjures up thoughts of complete protection from an illness, but it's much more complicated than that. Generally speaking, a person achieves immunity to a disease through the presence of antibodies, or proteins produced by the body that can neutralize or even destroy toxins or other disease carriers.
These are our 'attack mechanisms' against 'invaders'. Those antibodies are also disease-specific, per the CDC—it's why this year, for example, even if you got your flu shot, you have no immunity against the current coronavirus outbreak.
Past that, immunity itself can be broken down into two different categories: active immunity and passive immunity—and those differences depend on how the body was introduced to whatever virus or bacteria it developed antibodies for, and to what extent (and for how long) they can prevent future disease. The good news: Both types can play a role in future protection from (and even the potential treatment of) COVID-19.
What is active immunity and how is it acquired?
Active immunity results when exposure to a disease organism triggers the immune system to produce antibodies to that disease, and can happen one of two ways: Through infection with the actual disease, which is known as natural immunity; or through a vaccination (essentially, a killed or weakened form of the disease that won't make someone ill, but will trigger the body to make antibodies), which is known as vaccine-induced immunity.
Active immunity that results from either situation—natural immunity or vaccine-induced immunity—will allow a person's immune system to recognize the specific disease, if they ever come into contact with it again, which will then trigger the body to produce the antibodies needed to fight it off.
Active immunity is often longer-lasting and may sometimes even provide life-long protection—but that's entirely based on the disease itself. Immunity to the varicella virus (aka, chickenpox)—either via acquiring the infection as a child or through a vaccine—can provide lifelong immunity or long-lasting protection for up to 10 to 20 years. Whereas a yearly flu shot must be repeated annually, as it provides the most protection within the first three months, and begins to lose most effectiveness after six months.
It's also important to note that active immunity isn't immediate—it can sometimes take several weeks to develop, which is why most doctors suggest getting your yearly flu shot by the end of October, in order to have protection by the time flu season begins to pick up in November or December.
What is passive immunity and how is it acquired?
While active immunity occurs when an individual produces antibodies to a disease through his or her own immune system, passive immunity is provided when a person is given antibodies. This can happen in utero or through antibody-containing blood products—such as immune globulin, or a substance made from human blood plasma—administered when immediate protection from a specific disease is needed.
The major advantage to passive immunity—and the reason why it's sometimes used as a treatment against diseases—is that it provides immediate protection. But passive immunity doesn't last as long as active immunity, and loses effectiveness within a few weeks or months.
Of course, this passive immunity may also be helpful when it comes to COVID-19—primarily through the potential use of convalescent serum or blood plasma collected from those who have previously recovered from COVID-19. This means giving antibodies from the blood of people who have recovered from COVID-19 to people who are actively ill in order to prevent complications and hasten recovery. But the use of convalescent plasma isn't exactly new; it's also been used as a treatment option in a variety of other infectious diseases, including Ebola, Middle East respiratory syndrome (MERS), SARS, and even the H1N1 and H5N1 infections. That may be a helpful treatment for those with critical cases of COVID-19.
Convalescent plasma as treatment for COVID-19 specifically is still being studied, and is not yet recommended as routine treatment—but while it's not yet been approved for use by the US Food & Drug Administration, the FDA did provide guidance to health care professionals and investigators administering or studying the use of convalescent plasma for treatment of COVID-19, according to an April 13, 2020 press release.
Information courtesy of CDC and Health.com.
Coronavirus/COVID-19 Recommendations:
Limit your exposure to coronavirus by staying away from large groups of people and anyone who has recently traveled. Watch for symptoms such as low grade fever (Below 100 degrees), headache, dry cough, shortness of breath, and fatigue.
Click HERE for Florida Department of Health’s COVID-19 Data & Surveillance Dashboard.
Burns & Bertha - Changing Lives - Red Line Investors - © 2020
www.DiscoverSuncoastHomes.com
Read the full article
0 notes
Text
Year Over Year Purchase Applications
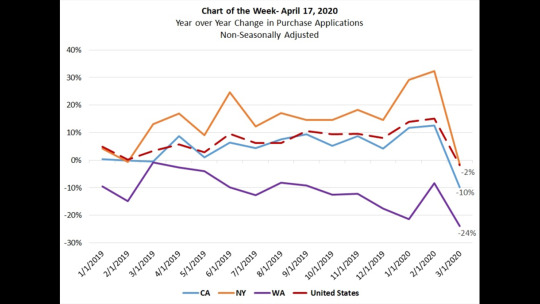
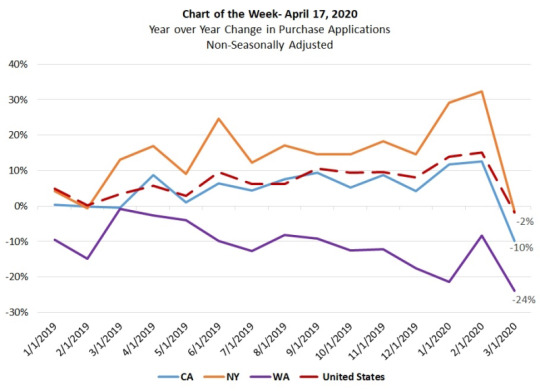
Year Over Year Change In Purchase Applications.
According to data from MBA's State Monthly Activity Report (SMAR), purchase applications grew for 14 consecutive months until the impacts of COVID-19 slowed activity to a 2 percent decline in March. Most of the decline was likely in the last two weeks of the month, when many states enacted restrictions on non-essential business and social activity. The SMAR highlights state level application changes on a non-seasonally adjusted basis each month. This week’s chart highlights some of the year-over-year changes in states most impacted by the virus.
Source: MBA’s State Monthly Activity Report
Washington, which was one of the first areas affected by COVID-19, dropped 24 percent in March, a further weakening of its 2019 trend. California had a decrease of 10 percent in March – after positive gains in 2019 – while in New York, annual purchase applications fell by 2 percent after seeing growth of more than 30 percent in February. In response to the need for timely data to help assess the current state of the housing market, we are also publishing weekly changes for these three states in MBA’s Weekly Application Survey, which is the source for the SMAR data.
This time of year is usually the upswing to the start of the spring home buying season, but it is possible that we see further declines in purchase applications in the coming months as many states remain closed to prevent further spread of the virus. Furthermore, many buyers and sellers may hold off on any housing transactions until the economic and public health picture improves.
Article courtesy of Mortgage Bankers Association.
To Sell, Buy or Invest contact Ed Bertha at (941) 921-2117 or [email protected]
Burns & Bertha - Changing Lives - Red Line Investors - © 2020
www.DiscoverSuncoastHomes.com
Read the full article
0 notes
Text
March 2020 Sarasota Manatee Real Estate Sales Recap

March 2020 Real Estate Market Activity Recap.
Sarasota and Manatee single family home, condo and townhome sales.
Residential Sales Rise While Market Slowdown Begins.
The March housing market transitioned from a soaring spring season to a slowdown in activity when COVID-19 concerns began to rise mid-month. Most pending sales from the previous month became closed sales in March with an 8.3 percent rise in closed sales for both markets in Sarasota and Manatee. Fewer properties were added to the market in March, which was expected during the coronavirus pandemic.
Closed sales in Sarasota and Manatee totaled 2,249 in March 2020, a 31.5 percent increase from the previous month, February of 2020. Year-over-year, Sarasota condo sales increased by 15.5 percent to 454 sales and single-family sales increased by 7.2 percent to 834 sales in Sarasota County. Manatee condo sales increased by 9.8 percent to 303 sales and single-family homes increased by 4.6 percent to 658 sales.
Median prices continue to rise across the two-county area. Single-family home prices increased by 2.4 percent to $319,500 in Manatee and increased by 10.5 percent to $315,000 in Sarasota. Condo prices increased by 5.7 percent to $215,000 in Manatee and increased by 7.5 percent to $245,000 in Sarasota.
For the condo market, new listings decreased by 5.2 percent in Manatee and by 1 percent in Sarasota. Single-family new listings decreased by 3.3 percent in Manatee and decreased by 11.4 percent in Sarasota.
As expected, pending sales experienced a decrease in both markets in both counties. Combined for Sarasota and Manatee, single-family pending sales decreased by 32.9 percent and condo pending sales decreased by 39.5 percent.
Year-over-year, the combined inventory in both markets decreased by 16.8 percent. Singlefamily home inventory decreased by 14.1 percent in Manatee and by 22 percent in Sarasota. Condo inventory in Manatee decreased by 3.8 percent, while Sarasota decreased by 17.9 percent.
The month's supply of inventory also declined in response to shrinking inventory and a rise in sales this month. Sarasota condo inventory declined by 28.1 percent to a 4.6-months' supply and Manatee condos decreased by 8.3 percent to a 4.4-months' supply. Sarasota single-family homes decreased by 30.2 percent to a 3.7-months' supply and Manatee fell by 19 percent to 3.4-months.
Click HERE to download the report.
For Specific Information contact us at (941) 921-2117 or [email protected]
Burns & Bertha - Changing Lives - Red Line Investors - © 2020
www.DiscoverSuncoastHomes.com
Reprinted with permission of Florida Realtors. All rights reserved. ©Florida Realtors®
Read the full article
0 notes
Text
Commercial Real Estate Trends April 2020
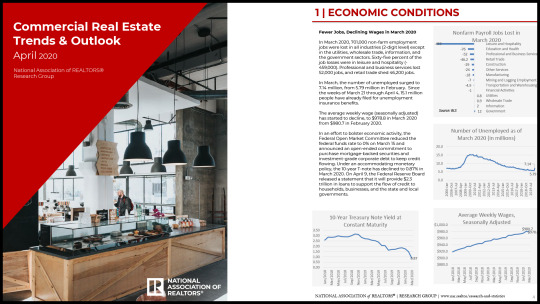
April 2020 Commercial Real Estate Trends And Outlook.
National Association of Realtors' (NAR) Quarterly Market Survey gathers information about the commercial transactions of REALTORS® and members of affiliate organizations (CCIM, SIOR, RLI, IREM, and the Counselors of Real Estate) and the opportunities and challenges facing commercial practitioners.
The 2020 Q1 survey was sent to approximately 75,000 commercial REALTORS® and members of affiliate organizations during April 1–8, 2020, of which 1,463 responded to the survey. A smaller number of respondents reported their sales (951) and leasing (931) transactions or market observations.
Click HERE to download the report.
Article courtesy of National Association of Realtors Research Group.
For Specific Information contact Ed Bertha at (941) 921-2117 or [email protected]
Burns & Bertha - Changing Lives - Red Line Investors - © 2020
www.DiscoverSuncoastHomes.com
Read the full article
0 notes
Last Seen Blogs

ofillyria
just a scared kid.

choppedmagazinestarlight
Untitled

but-what-if-its-whumpy
And It Was Whumpy
“Omg It Was Whumpy”

rinalildiamond
RinaLilDiamond

sundaenelle
Sundays.