
stockmarketanalysis
Arjun Remesh
Arjun is a seasoned stock market content expert with over 7 years of experience in stock market, technical & fundamental analysis. Since 2020, he has been a key contributor to Strike platform. Arjun is an active stock market investor with his in-depth stock market analysis knowledge. Arjun is also an certified stock market researcher from Indiacharts, mentored by Rohit Srivastava.
225 posts
Don't wanna be here? Send us removal request.
Last Seen Blogs

hazhasana
Haz

junespriince
birdflash brainrot

victoriaslittlesecret
Victoria’s Little Secret

almondcroissantsandink
felönious möpery with intent tö gawk

efrain15ricardez-blog
BlogInfor
Text
Deciphering the Pennant Pattern: A Guide to Trading Success
In the ever-evolving landscape of financial markets, traders constantly seek patterns that provide insights into potential price movements. Among the myriad of technical analysis tools available, the pennant pattern stands out as a potent indicator for identifying periods of consolidation and potential breakout opportunities. With its distinct formation resembling a small symmetrical triangle, the pennant pattern offers traders valuable clues about impending market shifts. In this article, we delve into the intricacies of the pennant pattern, exploring its characteristics, significance, and practical applications in trading strategies.
Understanding the Pennant Pattern
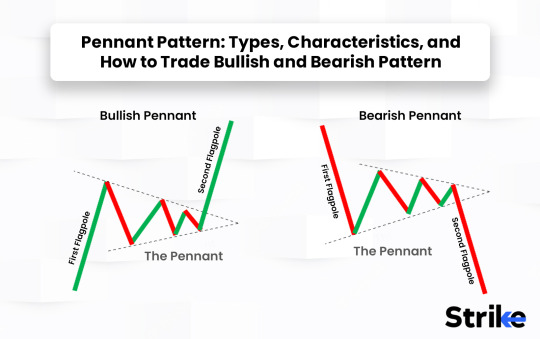
The pennant pattern is a continuation pattern that typically forms after a strong price movement, either upwards (bullish pennant) or downwards (bearish pennant). Its structure consists of two converging trendlines, forming a small symmetrical triangle within the context of the preceding price trend. The pennant pattern is characterized by diminishing trading ranges and declining volume, signaling a temporary pause or consolidation phase following the initial price impulse.
One key feature of the pennant pattern is its relatively short duration compared to other chart patterns, typically ranging from a few days to several weeks. This compressed timeframe reflects the rapid resolution of the consolidation phase, with traders anticipating a breakout in the direction of the preceding trend.
Significance of the Pennant Pattern
The pennant pattern holds significant implications for traders due to its ability to forecast the resumption of the prior price trend. While the pattern represents a temporary pause in the market, its formation suggests that the underlying trend remains intact, with buyers or sellers gathering momentum for the next directional move.
The symmetrical nature of the pennant pattern implies a balance between buying and selling pressure, as reflected in the converging trendlines. This equilibrium phase often precedes a breakout, as traders await a catalyst to propel prices in the direction of the prevailing trend.
Trading Strategies Utilizing the Pennant Pattern
Traders employ various strategies to capitalize on the pennant pattern and its potential implications. One common approach is to enter positions in the direction of the preceding trend once the price breaks out of the pennant formation. This breakout serves as a confirmation of trend continuation, signaling a resumption of the prior price momentum.
To enhance the reliability of trading signals, traders often wait for confirmation through volume analysis or other technical indicators. A breakout accompanied by a surge in trading volume validates the strength of the move, increasing the likelihood of a sustained trend continuation.
Risk management is crucial when trading the pennant pattern. Traders typically place stop-loss orders outside the pennant formation to limit potential losses in case of a false breakout. Additionally, setting price targets based on the height of the pennant or key support and resistance levels can help traders optimize their risk-reward ratio and maximize profit potential.
Conclusion
The pennant pattern represents a valuable tool in the arsenal of technical traders, providing insights into potential trend continuations and breakout opportunities. Its distinct formation and characteristics enable traders to identify periods of consolidation within the context of the prevailing trend, facilitating timely entry and exit decisions.
By understanding the nuances of the pennant pattern and incorporating it into their trading strategies, traders can gain a competitive edge in navigating the complexities of financial markets. However, like any technical analysis tool, the pennant pattern is not without its limitations, and traders should exercise caution and employ proper risk management techniques.
In conclusion, the pennant pattern exemplifies the essence of technical analysis, offering traders a framework for interpreting market dynamics and making informed trading decisions. With its ability to forecast trend continuations and identify breakout opportunities, the pennant pattern remains a valuable resource for traders seeking to capitalize on emerging market trends and unlock profitable trading opportunities.
1 note
·
View note
Text
Cracking the Code of the Rising Wedge Pattern in Trading
In the realm of financial markets, traders are constantly on the lookout for patterns that offer insights into future price movements. Among the plethora of technical analysis tools available, the rising wedge pattern emerges as a compelling indicator for identifying potential trend reversals or continuations. With its distinctive formation resembling a narrowing triangle pointing upwards, the rising wedge pattern holds significant implications for traders seeking to decipher market dynamics. In this article, we delve into the intricacies of the rising wedge pattern, unraveling its characteristics, significance, and practical applications in trading strategies.
Understanding the Rising Wedge Pattern
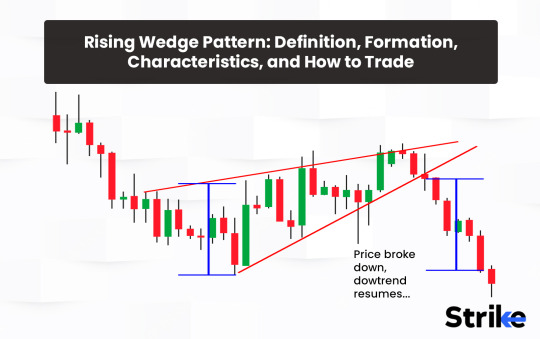
The rising wedge pattern is a bearish reversal pattern that typically materializes during uptrends. Its structure comprises two converging trendlines slanting upwards, with the lower trendline displaying a steeper slope than the upper one. As the pattern unfolds, the price oscillates between these trendlines, creating a contracting range. This gradual narrowing of price movements signals a decrease in buying pressure and waning bullish momentum.
One hallmark feature of the rising wedge pattern is its declining volume throughout its formation. As the price approaches the apex of the wedge, trading volume tends to diminish, reflecting a decrease in market participation. This decline in volume suggests that buyers are losing conviction, paving the way for a potential reversal in the prevailing uptrend.
Significance of the Rising Wedge Pattern
The rising wedge pattern holds considerable significance for traders due to its implications for future price action. While it typically emerges within an uptrend, its appearance signifies that buyers are gradually losing control, and sellers are gaining strength. The narrowing price range indicates a compression of volatility, often preceding a breakdown to the downside.
One crucial aspect of the rising wedge pattern is its ability to provide early signals of trend reversals. As the price approaches the apex of the wedge, traders anticipate a breakdown below the lower trendline, signaling a potential shift from an uptrend to a downtrend. This breakdown is often accompanied by a surge in trading volume, confirming the validity of the pattern and attracting further selling interest.
Trading Strategies Utilizing the Rising Wedge Pattern
Traders employ various strategies to capitalize on the rising wedge pattern and its potential implications. One common approach is to enter short positions once the price breaks down below the lower trendline of the wedge. This breakdown serves as a confirmation of bearish momentum, signaling a shift in market sentiment from bullish to bearish.
To enhance the reliability of trading signals, traders often wait for confirmation through candlestick patterns or other technical indicators. Bearish reversal patterns such as shooting star or bearish engulfing patterns near the upper trendline can provide additional validation of the impending bearish reversal.
Risk management is paramount when trading the rising wedge pattern. Traders typically place stop-loss orders above the upper trendline to limit potential losses in case the breakdown fails to materialize. Additionally, setting price targets based on the width of the wedge or key support levels can help traders maximize their profit potential while managing risk effectively.
Conclusion
The rising wedge pattern exemplifies the essence of technical analysis, providing traders with a framework for interpreting price action and making informed trading decisions. With its ability to anticipate trend reversals and capitalize on emerging opportunities, the rising wedge pattern remains a cornerstone of successful trading strategies in today's dynamic markets.
By understanding the nuances of the rising wedge pattern and incorporating it into their trading strategies, traders can gain a competitive edge in navigating the complexities of financial markets. However, like any technical analysis tool, the rising wedge pattern is not without its limitations, and traders should exercise caution and employ proper risk management techniques.
In conclusion, the rising wedge pattern serves as a powerful tool in the arsenal of technical traders, offering valuable insights into potential trend reversals and continuations. With its distinctive formation and characteristics, the rising wedge pattern enables traders to navigate market dynamics with precision and confidence, unlocking new avenues for profitable trading opportunities.
1 note
·
View note
Text
Unlocking the Potential of the Falling Wedge Pattern in Trading
In the dynamic world of financial markets, traders continually seek patterns that can provide insights into future price movements. Among the myriad of technical analysis tools available, the falling wedge pattern stands out as a versatile and reliable indicator for identifying potential trend reversals or continuations. With its distinct formation resembling a narrowing triangle pointing downwards, the falling wedge pattern offers traders valuable clues about impending market shifts. In this article, we delve into the intricacies of the falling wedge pattern, exploring its characteristics, significance, and practical applications in trading strategies.
Understanding the Falling Wedge Pattern
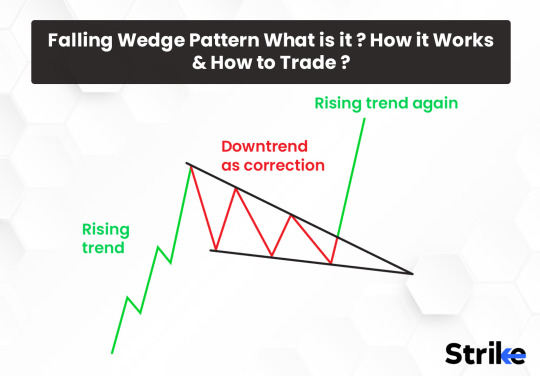
The falling wedge pattern is a bullish reversal pattern that typically forms during downtrends. Its structure consists of two converging trendlines slanting downward, with the upper trendline displaying a steeper slope than the lower one. As the pattern evolves, the price oscillates between these trendlines, creating a contracting range. This gradual narrowing of price movements signals a decrease in selling pressure and diminishing bearish momentum.
One distinctive feature of the falling wedge pattern is its declining volume throughout its formation. As the price approaches the apex of the wedge, trading volume tends to diminish, reflecting a decrease in market participation. This decline in volume suggests that sellers are losing conviction, paving the way for a potential reversal in the prevailing downtrend.
Significance of the Falling Wedge Pattern
The falling wedge pattern holds significance for traders due to its implications for future price action. While it typically forms within a downtrend, its appearance suggests that sellers are gradually losing control, and buyers are gaining strength. The narrowing price range indicates a compression of volatility, often preceding a breakout to the upside.
One key aspect of the falling wedge pattern is its ability to provide early signals of trend reversals. As the price approaches the apex of the wedge, traders anticipate a breakout above the upper trendline, signaling a potential shift from a downtrend to an uptrend. This breakout is often accompanied by a surge in trading volume, confirming the validity of the pattern and attracting further buying interest.
Trading Strategies Utilizing the Falling Wedge Pattern
Traders employ various strategies to capitalize on the falling wedge pattern and its potential implications. One common approach is to enter long positions once the price breaks out above the upper trendline of the wedge. This breakout serves as a confirmation of bullish momentum, signaling a shift in market sentiment from bearish to bullish.
To enhance the reliability of trading signals, traders often wait for confirmation through candlestick patterns or other technical indicators. Bullish reversal patterns such as hammer or engulfing patterns near the lower trendline can provide additional validation of the impending bullish reversal.
Risk management is crucial when trading the falling wedge pattern. Traders typically place stop-loss orders below the lower trendline to limit potential losses in case the breakout fails to materialize. Additionally, setting price targets based on the width of the wedge or key resistance levels can help traders maximize their profit potential while managing risk effectively.
Conclusion
The falling wedge pattern represents a powerful tool in the arsenal of technical traders, offering valuable insights into potential trend reversals and continuations. Its distinctive formation and characteristics make it a reliable indicator for identifying shifts in market sentiment and trading opportunities.
By understanding the nuances of the falling wedge pattern and incorporating it into their trading strategies, traders can gain a competitive edge in navigating the complexities of financial markets. However, like any technical analysis tool, the falling wedge pattern is not without its limitations, and traders should exercise caution and employ proper risk management techniques.
In conclusion, the falling wedge pattern exemplifies the essence of technical analysis, providing traders with a framework for interpreting price action and making informed trading decisions. With its ability to anticipate trend reversals and capitalize on emerging opportunities, the falling wedge pattern remains a cornerstone of successful trading strategies in today's dynamic markets.
1 note
·
View note
Text
Wedge Pattern in Trading: Definition, Features, Types, Trading Strategies, and Advantages
Introduction
The wedge pattern is a significant chart formation used in technical analysis, helping traders to predict the potential continuation or reversal of trends. This pattern can be observed in all financial markets including stocks, forex, commodities, and indices. Understanding the wedge pattern, its features, types, trading methodologies, and advantages can provide traders with a strategic edge. This comprehensive guide covers these aspects in detail.
Definition of the Wedge Pattern
A wedge pattern is formed when the price of an asset moves between two converging trendlines. These trendlines are drawn above and below the price, indicating the levels of resistance and support, respectively. The convergence of these lines suggests a decrease in volatility and a forthcoming breakout. Typically, the pattern is recognized for its ability to signal shifts in market behavior before they occur on a larger scale.
Key Features of the Wedge Pattern
Several key features define the wedge pattern:
Converging Trendlines: Unlike parallel channels, wedge patterns are characterized by lines that move toward each other.
Declining Volume: As the wedge develops, trading volume typically diminishes, which signifies waning momentum and consolidates the pattern’s reliability.
Duration: Wedge patterns can develop over short-term periods (a few weeks) or long-term periods (several months), making them versatile for various trading strategies.
Types of Wedge Patterns
Wedge patterns are primarily categorized into two types based on their potential signal about the price movement direction:
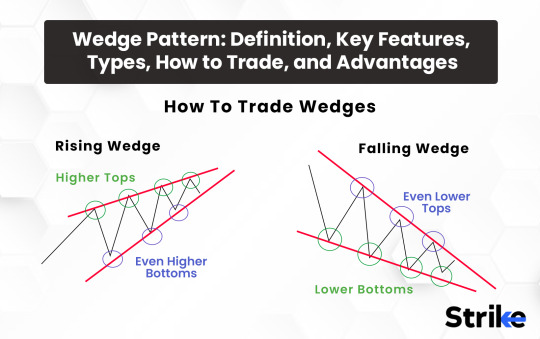
Rising Wedge: This pattern forms during an uptrend, with the lines sloping up as the price makes higher highs and higher lows. It typically indicates a bearish reversal when the price breaks below the support line.
Falling Wedge: Contrary to the rising wedge, this forms during a downtrend with lines sloping downward as the price makes lower highs and lower lows. A falling wedge is generally considered a bullish reversal pattern when the price breaks above the resistance line.
How to Trade the Wedge Pattern
Trading the wedge pattern effectively requires a good understanding of where to enter and exit trades, and how to manage risk:
Entry Points: For a rising wedge in an uptrend, traders should prepare to go short when the price breaks below the lower trendline. Conversely, for a falling wedge in a downtrend, traders should get ready to go long when the price breaks above the upper trendline.
Stop-Loss Orders: It’s prudent to place stop-loss orders just outside the trendline from which the breakout occurs. This minimizes potential losses if the breakout turns out to be a false signal.
Profit Targets: Traders often calculate profit targets by measuring the height at the widest part of the wedge and then projecting this distance from the breakout point in the direction of the breakout.
Advantages of Trading the Wedge Pattern
Trading the wedge pattern comes with several advantages:
Predictive Quality: Wedge patterns are highly regarded for their ability to forecast reversals and continuations well before they occur, allowing traders to position themselves advantageously.
Applicability Across Markets: This pattern can be identified in various asset classes, including stocks, forex, commodities, and more, making it a versatile tool for multi-market traders.
Risk Management: The clear structure of the wedge allows for effective risk management. Traders can set stop-losses relative to the trendlines and manage positions with a clear understanding of where the market could invalidate their analysis.
Conclusion
The wedge pattern is a powerful tool in the arsenal of technical analysis. By recognizing and understanding its types, traders can harness its predictive capabilities to enhance their trading strategies. Whether it indicates a continuation or reversal, the wedge pattern provides clear entry and exit points, helping traders to manage risks and maximize returns. As with any trading strategy, it is recommended to use wedge patterns in conjunction with other technical indicators and fundamental analysis to validate and strengthen trading signals, ensuring a well-rounded approach to market analysis.
0 notes
Text
The Rectangle Chart Pattern: An Essential Guide for Market Traders
Introduction
The rectangle chart pattern, often found in the charts of financial markets, is a classic continuation pattern that occurs in both uptrends and downtrends, serving as a pause before the prevailing trend resumes. This pattern is pivotal for traders as it provides both a clear structure for risk management and potential profit targets. This article explores the definition, characteristics, formation, significance, and strategic implications of the rectangle chart pattern.
Definition of the Rectangle Chart Pattern
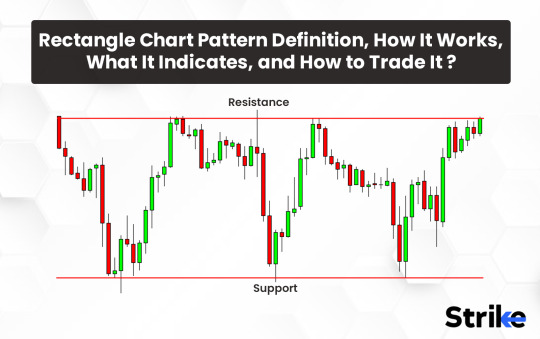
A rectangle chart pattern is formed when the price of an asset moves between two parallel horizontal lines, creating what appears to be a sideways or consolidating price movement. These parallel lines represent the upper and lower price boundaries, which act as support and resistance levels. The pattern is named for its visual similarity to a rectangle.
Formation of the Rectangle Chart Pattern
The formation of a rectangle chart pattern involves several distinct phases:
Initial Trend: The pattern can form in either an uptrend or a downtrend. The presence of a prior trend is crucial as it indicates the continuation nature of the rectangle pattern.
Range-Bound Movement: After a trend is established, the price starts to fluctuate between two horizontal levels: the resistance at the top and the support at the bottom. This phase is characterized by a series of highs and lows that touch these levels repeatedly without breaking out.
Volume Considerations: Typically, volume diminishes as the pattern develops, indicating a decrease in market momentum and a consolidation phase.
Breakout: The rectangle pattern is completed when the price eventually breaks out from the top resistance or bottom support level. The direction of the breakout signals the continuation of the prior trend.
What the Rectangle Chart Pattern Indicates
The rectangle chart pattern is primarily seen as a continuation pattern. This means that it signals that the market is likely to continue in the direction of the preceding trend once the pattern is completed. The consolidation within the boundaries of the rectangle suggests that the market is pausing, perhaps due to traders taking profits or re-evaluating their positions, before gathering the momentum needed to continue the trend.
Parts of the Rectangle Chart Pattern
Understanding the components of the rectangle chart pattern is key to its application:
Support and Resistance Levels: These are the horizontal lines that form the top and bottom boundaries of the rectangle. The resistance level caps upward price movements, while the support level sustains the price during declines.
Duration: The length of time the pattern develops can vary from a few weeks to several months, depending on the time frame of the chart being analyzed.
Volume: The trading volume typically decreases as the pattern forms, suggesting a lack of conviction in the direction of the price until the breakout occurs.
Breakout Point: The breakout is a crucial part of the rectangle pattern. It occurs when the price moves beyond one of the defined levels with increased volume, signaling the resumption of the prior trend.
Trader’s Thoughts and Strategy
For traders, the rectangle chart pattern provides a clear and structured way to plan trades. Here are some strategic considerations:
Entry Points: Traders may look for entry points upon a breakout. A breakout above resistance suggests buying, while a breakout below support suggests selling or shorting.
Stop-Loss Orders: Placing stop-loss orders just outside the opposite boundary of the breakout can help manage risk. For example, if buying on a breakout above resistance, a stop-loss might be placed just below the resistance line.
Profit Targets: Traders often calculate profit targets by measuring the height of the rectangle and projecting this distance from the point of breakout. This provides a proportional expectation based on the price range within the rectangle.
Confirmation: To avoid false breakouts, traders might wait for additional confirmation, such as a closing price outside the rectangle or increased volume during the breakout.
Conclusion
The rectangle chart pattern is a robust tool in the field of technical analysis, providing traders with clear indicators for potential price movements following periods of consolidation. By understanding and utilizing the components of this pattern, traders can enhance their strategies, manage risks more effectively, and potentially increase their profitability. As with all trading patterns, the rectangle chart pattern should be used in conjunction with other technical indicators and fundamental analysis to maximize trading success and accuracy.
0 notes
Text
Double Top Pattern: A Comprehensive Guide for Traders
Introduction
In the world of trading, particularly within the realm of technical analysis, the double top pattern stands out as a crucial reversal pattern that is widely recognized by traders to signal a potential shift from a prevailing uptrend to a downtrend. This pattern is not just popular in stock trading but is also prevalent in forex, commodities, and various financial markets. Understanding the double top pattern is essential for traders looking to capitalize on pivotal market shifts. This article delves into the definition, formation, significance, components, and strategic considerations of the double top pattern.
Definition of the Double Top Pattern
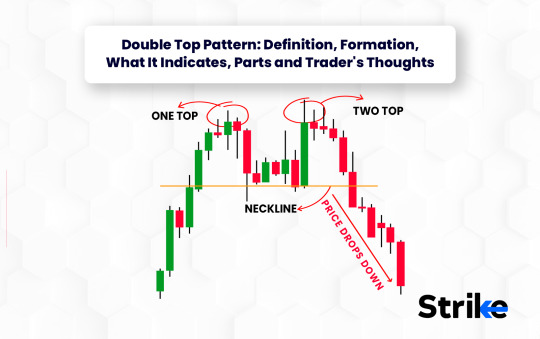
The double top pattern is a highly regarded bearish reversal pattern that occurs after an asset has been in an extended uptrend. It is characterized by the asset reaching a high price point on two separate occasions with a moderate decline in price between these two peaks. These peaks are roughly at the same price level, giving the appearance of the letter "M" on the chart.
Formation of the Double Top Pattern
The formation of a double top pattern involves several key steps:
Initial Peak: The asset's price reaches a new high in its prevailing uptrend, drawing the attention of bullish traders.
Pullback: After reaching this high, the price undergoes a pullback, which is a moderate decline. This pullback is essential as it forms the trough or valley between the two peaks.
Second Peak: Following the pullback, the price ascends to test the initial high. However, the market fails to sustain this level, leading to the formation of a second peak.
Neckline Formation: The lowest point of the pullback between the two peaks forms what is known as the neckline. This is a critical component as it serves as a support level.
Breakdown: The completion of the pattern is confirmed when the price breaks below the neckline after forming the second peak. This breakdown is a signal that a new downtrend is likely to commence.
What the Double Top Pattern Indicates
The double top pattern is a strong signal that the market is turning bearish. It suggests that the buying pressure that was previously driving the asset’s price upward is diminishing. When the price fails to exceed the high of the first peak on the second attempt, it indicates that the momentum is waning and the sellers are beginning to dominate. The decisive break below the neckline confirms this shift, signaling traders to consider taking short positions or exiting long positions.
Parts of the Double Top Pattern
The double top pattern comprises several components, each contributing to its overall interpretation:
Two Peaks: These are the two distinct highs that are approximately at the same price level. Their similarity in height is crucial for the pattern's recognition.
Neckline: This is the support line drawn at the low point between the two peaks. The neckline’s slope can sometimes tilt upward or downward, which may influence the pattern’s bearish strength.
Volume: Ideally, volume should diminish as the second peak forms. A decrease in volume during the formation of the second peak reinforces the lack of buying pressure.
Confirmation Point: This is the point where the price falls below the neckline, confirming the pattern and signaling a potential sell-off.
Trader’s Thoughts and Strategy
Traders who recognize the formation of a double top pattern typically prepare for a shift in their trading strategy. The key is to observe the volume and the behavior of the price as it approaches the neckline after forming the second peak. A prudent approach often involves setting a stop-loss just above the second peak to manage risk effectively.
Moreover, traders might look to measure the potential decline by considering the distance from the peaks to the neckline. This distance can be projected downward from the point where the price breaks through the neckline, providing a target for the subsequent downward move.
Conclusion
The double top pattern is a powerful tool in the arsenal of technical traders, offering significant insights into potential market reversals. By understanding its formation, parts, and what it indicates, traders can better manage their positions and potentially capitalize on the shifts in market momentum. Like all trading strategies, the effectiveness of the double top pattern increases when combined with other technical indicators and thorough market analysis, ensuring a balanced and informed trading approach.
0 notes
Text
Unveiling the Rounding Bottom Pattern: A Guide to Recognizing and Trading this Bullish Reversal Pattern
Introduction:
In the realm of technical analysis, chart patterns play a pivotal role in identifying potential market reversals and trends. One such pattern that has captured the attention of traders and investors is the rounding bottom pattern. Also known as the saucer bottom or the bowl, this pattern is revered for its ability to signal a potential shift from a downtrend to an uptrend. In this article, we'll delve into the intricacies of the rounding bottom pattern, exploring its definition, identification techniques, trading strategies, and its advantages and disadvantages.
Understanding the Rounding Bottom Pattern:
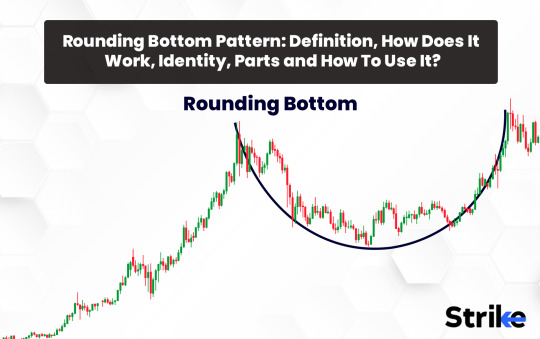
The rounding bottom pattern is a bullish reversal pattern that signifies a transition from a prolonged downtrend to a potential uptrend. Visually, the pattern resembles the shape of a bowl or a rounded bottom, hence its name. It typically forms over an extended period as selling pressure gradually diminishes, and buying interest begins to emerge. The pattern is characterized by a gradual decline in prices followed by a gradual increase, forming a smooth curve or rounding bottom on the price chart.
Identifying the Rounding Bottom Pattern:
Identifying the rounding bottom pattern requires careful observation of price action and trend dynamics. Here are the key steps to identify this pattern:
Downtrend Reversal: The rounding bottom pattern typically occurs after a sustained downtrend, characterized by lower lows and lower highs. Traders look for signs of selling exhaustion and a potential shift in market sentiment.
Rounded Bottom Formation: As selling pressure subsides, prices gradually stabilize and begin to form a rounded bottom on the price chart. This phase is marked by a series of lower lows followed by higher lows, creating a smooth curve that resembles the shape of a bowl.
Volume Confirmation: As the pattern develops, traders look for confirmation through increasing trading volumes during the rounding bottom formation. Rising volumes indicate growing buying interest and validate the bullish reversal signal.
Breakout Confirmation: The pattern is confirmed when the price breaks above the resistance level formed by the highest point of the rounding bottom. This breakout should ideally be accompanied by a surge in trading volume, signaling a decisive shift in market sentiment from bearish to bullish.
Trading Strategies with the Rounding Bottom Pattern:
Traders employ various strategies to capitalize on the rounding bottom pattern. Here are some common approaches:
Entry on Breakout: Traders often enter long positions when the price breaks above the resistance level of the rounding bottom pattern, signaling a bullish breakout. Stop-loss orders can be placed below the breakout point to manage risk.
Measuring Price Target: The height of the rounding bottom pattern can be measured from the lowest point of the curve to the resistance level. This distance can then be projected upward from the breakout point to estimate a potential price target for the upward movement.
Pullback Entry: Some traders wait for a pullback or a retest of the breakout level before entering long positions, seeking confirmation that the breakout is valid. This approach allows for a better entry price and reduces the risk of false breakouts.
Advantages of the Rounding Bottom Pattern:
The rounding bottom pattern offers several advantages for traders:
Clear Bullish Reversal Signal: The pattern's distinctive shape provides a clear signal of a potential trend reversal from bearish to bullish, enabling traders to position themselves accordingly.
Defined Entry and Exit Points: The pattern's well-defined resistance level and breakout point allow traders to establish precise entry and exit points, facilitating effective risk management.
Measurable Price Target: Traders can use the height of the rounding bottom pattern to estimate a potential price target for the upward movement, providing a useful tool for setting profit targets.
Versatility: The rounding bottom pattern can be applied to various timeframes and asset classes, making it a versatile tool for traders across different markets.
Disadvantages of the Rounding Bottom Pattern:
Despite its benefits, the rounding bottom pattern also has some limitations:
False Signals: Like any technical pattern, the rounding bottom pattern is not immune to false signals, where the price briefly breaks out but fails to sustain the upward momentum. Traders must exercise caution and wait for confirmation before entering positions.
Subjectivity in Identification: Identifying the rounding bottom pattern requires subjective judgment, and different traders may interpret the formation differently, leading to inconsistency in trading decisions.
Time-consuming Formation: The pattern's formation can be time-consuming, requiring patience from traders who may need to wait for weeks or even months for the pattern to fully develop.
Market Volatility: High levels of market volatility can lead to erratic price movements that deviate from the expected pattern, making it challenging to accurately predict price behavior.
Conclusion:
The rounding bottom pattern serves as a valuable tool for traders in identifying potential bullish reversal patterns in downtrending markets. By understanding the structure of the pattern and its key characteristics, traders can effectively incorporate it into their trading strategies to capitalize on potential price movements. However, it is essential to recognize the pattern's limitations and exercise caution when trading based solely on its signals. As with any trading strategy, risk management and proper analysis are crucial for success in the markets.
0 notes
Text
Unraveling the Descending Triangle Pattern: A Comprehensive Guide
Introduction:
Technical analysis serves as a cornerstone for traders and investors in deciphering market dynamics and making informed decisions. Among the myriad of patterns and indicators, the descending triangle stands out as a significant chart pattern, offering insights into potential price movements. In this article, we delve into the intricacies of the descending triangle pattern, exploring its definition, identification techniques, trading strategies, and its advantages and disadvantages.
Understanding the Descending Triangle Pattern:
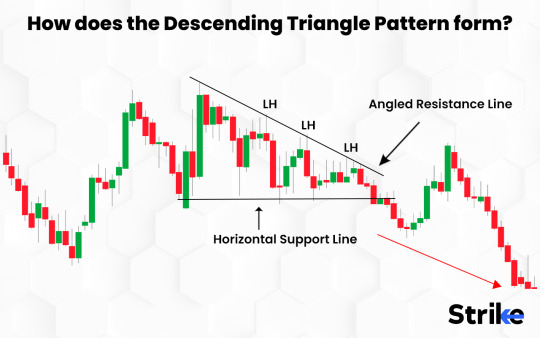
The descending triangle pattern is a bearish continuation pattern characterized by a series of lower highs (forming the upper trendline) and a horizontal support line (forming the lower trendline). This pattern typically forms during a downtrend and signifies a period of consolidation before the resumption of the prevailing downward momentum. Visually, the pattern resembles a triangle with a flat lower trendline and a descending upper trendline, indicating a weakening of buying pressure and a potential breakdown in price.
Identifying the Descending Triangle Pattern:
Identifying the descending triangle pattern requires careful observation of price action and trend dynamics. Here are the key steps to identify this pattern:
Downtrend Confirmation: The pattern is most reliable when it occurs within the context of a well-established downtrend, characterized by lower lows and lower highs.
Lower Highs: Identify a series of lower highs formed by connecting the swing highs in the price action. This forms the descending trendline, indicating selling pressure.
Horizontal Support Line: Observe a horizontal support line formed by connecting the swing lows in the price action. This line represents a level where buying interest has historically been strong enough to prevent further downward movement.
Convergence: As the pattern progresses, the distance between the descending trendline and the horizontal support line narrows, forming a converging triangle pattern.
Breakdown Confirmation: The pattern is confirmed when the price breaks below the horizontal support line, signaling a continuation of the downtrend. This breakdown should ideally be accompanied by increased trading volume, indicating a strong bearish sentiment.
Trading Strategies with the Descending Triangle Pattern:
Traders employ various strategies to capitalize on the descending triangle pattern. Here are some common approaches:
Short Entry on Breakdown: Traders often enter short positions when the price breaks below the horizontal support line, anticipating a continuation of the downtrend. Stop-loss orders can be placed above the breakdown point to manage risk.
Measuring Price Target: The height of the triangle pattern can be measured from the highest point of the triangle to the horizontal support line. This distance can then be projected downward from the breakout point to estimate a potential price target for the downward movement.
Confirmation with Volume: Traders may wait for confirmation of the breakdown with increased trading volume, as higher volume validates the strength of the bearish move and reduces the likelihood of a false signal.
Advantages of the Descending Triangle Pattern:
The descending triangle pattern offers several advantages for traders:
Clear Bearish Bias: The pattern's bearish nature provides a clear signal for traders to anticipate downward price movements, enabling them to position themselves accordingly.
Defined Entry and Exit Points: The pattern's well-defined upper and lower trendlines allow traders to establish precise entry and exit points, facilitating effective risk management.
Measurable Price Target: Traders can use the height of the triangle pattern to estimate a potential price target for the downward movement, providing a useful tool for setting profit targets.
High Probability Setup: When the pattern occurs within the context of a downtrend, it often has a high probability of success, making it an attractive setup for traders seeking short-selling opportunities.
Disadvantages of the Descending Triangle Pattern:
Despite its benefits, the descending triangle pattern also has some limitations:
False Breakouts: Like any technical pattern, the descending triangle pattern is not immune to false breakouts, where the price briefly moves below the support line before reversing higher. Traders must exercise caution and wait for confirmation before entering positions.
Subjectivity in Identification: Identifying the descending triangle pattern requires subjective judgment, and different traders may interpret the formation differently, leading to inconsistency in trading decisions.
Time-consuming Formation: The pattern's formation can be time-consuming, requiring patience from traders who may need to wait for weeks or even months for the pattern to fully develop.
Market Volatility: High levels of market volatility can lead to erratic price movements that deviate from the expected pattern, making it challenging to accurately predict price behavior.
Conclusion:
The descending triangle pattern serves as a valuable tool for traders in identifying potential bearish continuation patterns in downtrending markets. By understanding the structure of the pattern and its key characteristics, traders can effectively incorporate it into their trading strategies to capitalize on potential price movements. However, it is essential to recognize the pattern's limitations and exercise caution when trading based solely on its signals. As with any trading strategy, risk management and proper analysis are crucial for success in the markets.
0 notes
Text
Understanding the Cup and Handle Pattern in Technical Analysis
Introduction:
In the vast world of technical analysis, traders and investors employ various tools and strategies to predict price movements in financial markets. One such tool is the Cup and Handle pattern, which is widely recognized for its potential to identify trend reversals and continuation patterns. In this article, we'll delve into what the Cup and Handle pattern is, how to identify it, and its advantages and disadvantages in trading.
What is the Cup and Handle Pattern?
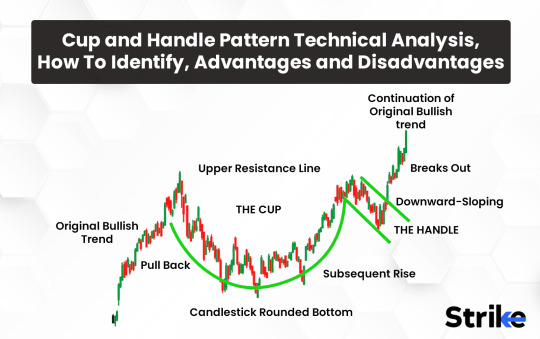
The Cup and Handle pattern is a bullish continuation pattern that typically forms during an uptrend, signaling a potential resumption of the upward momentum after a brief consolidation phase. It consists of two main components: the cup and the handle.
The Cup: The cup is the first part of the pattern and resembles a rounded bottom, often resembling the shape of a "U" or a "V" on the price chart. This phase represents a period of consolidation or correction following an uptrend, where sellers gradually lose control, and buyers start to regain dominance. The depth and symmetry of the cup are important factors in determining the strength of the pattern.
The Handle: Following the formation of the cup, there is usually a small downward price movement, forming what is known as the handle. The handle is characterized by lower trading volumes and typically takes the shape of a small downward sloping channel or a sideways consolidation. It represents a final consolidation before the breakout and serves as a bullish continuation signal.
How to Identify the Cup and Handle Pattern:
Identifying the Cup and Handle pattern requires a keen eye for chart patterns and an understanding of price action dynamics. Here are the key steps to identify this pattern:
Uptrend Confirmation: The pattern is most reliable when it occurs within the context of a well-defined uptrend. Look for a sustained upward movement in prices before the formation of the cup.
Cup Formation: Identify the formation of the cup, which should resemble a rounded bottom with relatively smooth price action. The depth and duration of the cup can vary, but a deeper and more symmetrical cup is considered more reliable.
Handle Formation: After the cup is formed, observe the formation of the handle, which typically appears as a small downward price movement with lower trading volumes. The handle should be relatively shallow compared to the cup and can take the shape of a sideways consolidation or a minor downward sloping channel.
Breakout Confirmation: The pattern is confirmed when the price breaks out above the resistance level formed by the high point of the cup. This breakout should ideally be accompanied by an increase in trading volume, indicating renewed buying interest.
Advantages of the Cup and Handle Pattern:
The Cup and Handle pattern offers several advantages for traders and investors:
Clear Entry and Exit Points: The pattern provides clear entry points near the breakout level, allowing traders to enter positions with defined stop-loss levels to manage risk effectively.
Strong Bullish Bias: The pattern's bullish nature makes it attractive for traders seeking opportunities to capitalize on upward price movements in the market.
Relatively Low Risk: Since the pattern occurs within the context of an uptrend, there is a lower risk of false signals compared to other reversal patterns.
Target Price Projection: Traders can use the height of the cup as a basis for projecting the potential price target after the breakout, providing a useful tool for setting profit targets.
Disadvantages of the Cup and Handle Pattern:
Despite its benefits, the Cup and Handle pattern also has some limitations:
False Signals: Like any technical pattern, the Cup and Handle pattern is not foolproof and can sometimes result in false signals, leading to losses for traders who rely solely on this pattern for decision-making.
Subjectivity in Identification: Identifying the pattern requires subjective judgment, and different traders may interpret the formation differently, leading to inconsistency in trading decisions.
Time-consuming Formation: The pattern's formation can be time-consuming, requiring patience from traders who may need to wait for weeks or even months for the pattern to fully develop.
Market Volatility: High levels of market volatility can invalidate the pattern, leading to erratic price movements that deviate from the expected bullish continuation.
Conclusion:
The Cup and Handle pattern is a valuable tool in the arsenal of technical analysts, offering a reliable method for identifying bullish continuation patterns in uptrending markets. By understanding the structure of the pattern and its key characteristics, traders can effectively incorporate it into their trading strategies to capitalize on potential price movements. However, it is essential to recognize the pattern's limitations and exercise caution when trading based solely on its signals. As with any trading strategy, risk management and proper analysis are crucial for success in the markets.
0 notes
Text
Understanding Demand and Supply Zones in Trading: A Comprehensive Guide
In the realm of financial markets, traders often rely on various tools and techniques to analyze price movements and make informed decisions. One such tool that plays a crucial role in technical analysis is the concept of demand and supply zones. Understanding demand and supply zones is essential for traders looking to identify potential entry and exit points, manage risk, and optimize their trading strategies. In this comprehensive guide, we'll delve into the intricacies of demand and supply zones, exploring what they are, how they're identified, and their significance in trading.
What are Demand and Supply Zones?
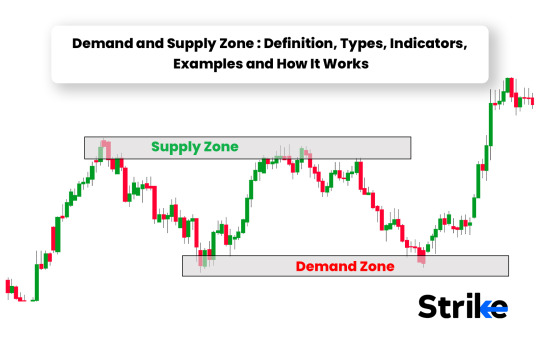
Demand and supply zones are areas on a price chart where significant buying (demand) or selling (supply) activity has occurred, leading to a temporary imbalance between buyers and sellers. These zones represent key levels where price action tends to react strongly, often resulting in reversals or significant price movements.
Demand Zone: A demand zone is a price level where there is a notable concentration of buying interest, causing the price to reverse direction or experience a bounce upwards. In a demand zone, buyers outnumber sellers, leading to increased buying pressure and a potential increase in prices.
Supply Zone: Conversely, a supply zone is a price level where there is a significant concentration of selling activity, causing the price to reverse or experience a downward movement. In a supply zone, sellers outnumber buyers, leading to increased selling pressure and a potential decrease in prices.
Identifying Demand and Supply Zones
Identifying demand and supply zones requires a keen understanding of price action and the ability to interpret market dynamics. While there are various methods and indicators traders use to identify these zones, some common techniques include:
Support and Resistance Levels: Demand zones often correspond to historical support levels, where buying interest has previously outweighed selling pressure, causing the price to bounce higher. Conversely, supply zones are often found near historical resistance levels, where selling pressure has overwhelmed buying interest, leading to price reversals.
Volume Analysis: Volume can provide valuable insights into the strength of buying or selling activity at specific price levels. High volume accompanying a price movement in a particular direction can indicate the presence of a demand or supply zone.
Price Action Patterns: Traders often look for specific price action patterns, such as bullish engulfing patterns in demand zones or bearish engulfing patterns in supply zones, to confirm the presence of buying or selling pressure.
Fibonacci Retracement Levels: Fibonacci retracement levels are frequently used by traders to identify potential demand and supply zones based on the principle of price retracement following a significant move in the market.
Significance in Trading
Demand and supply zones play a significant role in guiding trading decisions and formulating effective strategies. Here are some reasons why these zones are essential for traders:
Entry and Exit Points: Demand and supply zones provide traders with valuable entry and exit points for their trades. Buying at demand zones and selling at supply zones can offer favorable risk-reward ratios and increase the probability of successful trades.
Risk Management: By identifying demand and supply zones, traders can set appropriate stop-loss orders to manage their risk. Placing stop-loss orders just below demand zones for long trades and above supply zones for short trades can help minimize potential losses if the price moves against the intended direction.
Confirmation of Trends: Demand and supply zones can act as confirmation of existing market trends. In an uptrend, demand zones often provide opportunities to buy the dip, while in a downtrend, supply zones can offer opportunities to sell the rally.
Market Psychology: Understanding demand and supply zones provides insights into market psychology and sentiment. These zones represent areas where buyers and sellers are actively participating in the market, reflecting shifts in sentiment and potential changes in trend direction.
Conclusion
Demand and supply zones are fundamental concepts in technical analysis that help traders identify significant levels of buying and selling activity in the market. By understanding how to identify and interpret these zones, traders can make more informed trading decisions, improve their risk management practices, and enhance the effectiveness of their trading strategies. While demand and supply zones are just one aspect of technical analysis, they are a powerful tool that can greatly enhance a trader's ability to navigate the complexities of financial markets.
0 notes
Text
Exploring Four Types of Supply and Demand Patterns in Economics and Trading
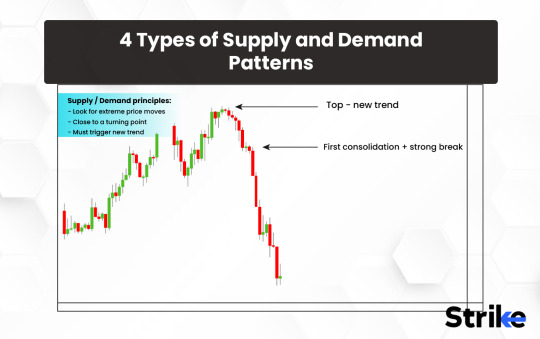
Supply and demand are fundamental concepts in economics and trading, influencing prices, market behavior, and allocation of resources. Understanding the various patterns that emerge within supply and demand dynamics is essential for traders, economists, and policymakers alike. In this article, we delve into four key types of supply and demand patterns, exploring their characteristics, implications, and significance in both theoretical and practical contexts.
1. Normal Supply and Demand Curve:
The normal supply and demand curve represents the foundational relationship between the quantity of a good or service supplied and demanded at different price levels. In this pattern:
Supply Curve: Slopes upward from left to right, indicating that producers are willing to supply more goods or services as prices increase.
Demand Curve: Slopes downward from left to right, indicating that consumers are willing to purchase fewer goods or services as prices increase.
The intersection of the supply and demand curves determines the equilibrium price and quantity, where market forces reach a balance. Any shifts in either curve, caused by changes in factors such as consumer preferences, production costs, or external shocks, lead to adjustments in equilibrium price and quantity.
2. Elastic and Inelastic Demand:
Elasticity of demand refers to the responsiveness of quantity demanded to changes in price. Understanding elastic and inelastic demand is crucial for pricing strategies, revenue optimization, and policy formulation.
Elastic Demand: When a small change in price leads to a proportionally larger change in quantity demanded, demand is considered elastic. Goods with many substitutes, luxury items, and non-essential goods often exhibit elastic demand.
Inelastic Demand: When a change in price results in a relatively small change in quantity demanded, demand is said to be inelastic. Necessities like food, medicine, and utilities typically have inelastic demand because consumers prioritize these items regardless of price changes.
Recognizing whether demand is elastic or inelastic informs producers and policymakers about the potential impact of price changes on consumer behavior and revenue.
3. Shifts in Supply and Demand:
Supply and demand curves can shift due to various factors, leading to changes in equilibrium price and quantity. Some common reasons for shifts include:
Changes in Input Prices: Alterations in the costs of production inputs, such as labor, raw materials, or energy, influence supply curves.
Changes in Technology: Technological advancements can increase production efficiency, shifting supply curves outward.
Changes in Consumer Income: Shifts in consumer income levels affect demand for goods and services, leading to changes in demand curves.
Changes in Government Policy: Policies such as taxes, subsidies, or regulations can impact both supply and demand curves.
Understanding the drivers of supply and demand shifts allows stakeholders to anticipate market changes and adapt their strategies accordingly.
4. Seasonal and Cyclical Demand Patterns:
Seasonal and cyclical demand patterns occur due to recurring factors over specific timeframes, influencing consumer behavior and market dynamics.
Seasonal Demand: Certain goods experience fluctuations in demand based on seasonal factors such as holidays, weather, or cultural events. For example, demand for winter clothing peaks during cold months, while demand for swimsuits surges in the summer.
Cyclical Demand: Economic cycles, including expansions and contractions, impact demand for various goods and services. During economic booms, demand for luxury items and discretionary spending increases, while recessions often lead to decreased demand for non-essential goods and services.
Recognizing seasonal and cyclical demand patterns enables businesses to adjust production schedules, marketing strategies, and inventory management practices to capitalize on opportunities and mitigate risks associated with fluctuations in demand.
Conclusion:
Supply and demand patterns play a pivotal role in shaping economic outcomes and market behavior. By understanding the nuances of these patterns, stakeholders can make informed decisions regarding pricing, production, investment, and policy formulation.
From the foundational normal supply and demand curve to the intricacies of elasticity, shifts, and seasonal/cyclical patterns, each type offers valuable insights into market dynamics and opportunities for optimization.
Whether you're a trader seeking to anticipate price movements, a business owner optimizing production and pricing strategies, or a policymaker crafting effective economic policies, a comprehensive understanding of supply and demand patterns is indispensable in navigating the complexities of the modern economy.
0 notes
Text
Understanding the Three Inside Down Candlestick Pattern in Stock Trading

In the intricate world of stock trading, where every fluctuation and pattern holds potential significance, candlestick patterns stand out as invaluable tools for traders. Among these patterns, the Three Inside Down pattern is notable for its indication of potential trend reversal. With its distinct formation and implications, understanding this pattern can be a valuable asset for traders seeking to navigate the volatile waters of the stock market.
Unveiling the Three Inside Down Pattern:
The Three Inside Down pattern is a bearish reversal pattern that typically forms at the peak of an uptrend. It consists of three candles that provide traders with valuable insights into market sentiment and potential shifts in direction.
First Candle:
The pattern begins with a tall bullish candle, indicating a strong upward movement in the market. This candle signifies the continuation of the existing uptrend, with buyers dominating the market and pushing prices higher.
Second Candle:
Following the bullish momentum of the first candle, the second candle forms as a small-bodied candle, often referred to as a Doji or a spinning top. This candle represents indecision in the market, with neither buyers nor sellers exerting significant control over price movement. It serves as an early sign of potential weakening in the uptrend.
Third Candle:
The third candle is where the pattern's significance becomes apparent. It is a bearish candle that closes below the midpoint of the first candle's body. This candle's appearance confirms the reversal of the previous uptrend and indicates a shift in momentum from bullish to bearish. The closing price of the third candle is often near its low, further emphasizing selling pressure.
Interpretation and Implications:
The formation of the Three Inside Down pattern carries several implications for traders:
Reversal Signal:
The primary significance of the Three Inside Down pattern is its indication of a potential trend reversal. After a sustained uptrend, the emergence of this pattern suggests that selling pressure is beginning to outweigh buying pressure, signaling a possible transition to a downtrend.
Confirmation of Bearish Sentiment:
The bearish nature of the pattern reinforces negative market sentiment. As the third candle closes below the midpoint of the first candle, it reflects a decisive shift in favor of sellers, highlighting their increasing dominance in the market.
Entry and Exit Points:
For traders, recognizing the Three Inside Down pattern provides valuable entry and exit points for positions. Traders may consider entering short positions or liquidating existing long positions upon the completion of the pattern, anticipating further downward movement in prices.
Risk Management:
Incorporating the Three Inside Down pattern into risk management strategies can help traders mitigate potential losses. Implementing stop-loss orders above the high of the third candle can limit downside risk in the event of a failed reversal.
Limitations and Considerations:
While the Three Inside Down pattern offers valuable insights into market dynamics, it is essential to consider its limitations and the broader market context:
Confirmation Needed:
Like any technical indicator, the Three Inside Down pattern requires confirmation from additional signals or factors. Traders should look for corroborating evidence, such as volume analysis or support and resistance levels, to strengthen the validity of the reversal signal.
False Signals:
As with any trading pattern, false signals can occur, leading to losses if traders rely solely on the Three Inside Down pattern without considering other factors. It is crucial to exercise caution and use the pattern as part of a comprehensive trading strategy.
Market Conditions:
Market conditions, such as volatility and liquidity, can influence the effectiveness of the Three Inside Down pattern. Traders should adapt their strategies and risk management techniques accordingly, taking into account the prevailing market environment.
Conclusion:
The Three Inside Down candlestick pattern stands as a powerful tool for traders seeking to identify potential trend reversals in the stock market. Its distinct formation and implications provide valuable insights into shifting market dynamics, allowing traders to make informed decisions about their positions.
However, like any trading indicator, the Three Inside Down pattern is not without its limitations. Traders must exercise caution, conduct thorough analysis, and incorporate risk management strategies to navigate the complexities of the market successfully.
By understanding the nuances of the Three Inside Down pattern and its implications, traders can enhance their ability to identify profitable trading opportunities while effectively managing risk in an ever-changing market landscape.
0 notes
Text
Unlocking Profit Potential with Triple Bottom Patterns: A Comprehensive Guide

In the world of technical analysis, traders constantly search for patterns that offer insights into potential market reversals and trend continuations. One such pattern that holds significant importance for traders is the Triple Bottom pattern. In this article, we'll delve into the definition, formation, trading strategies, as well as the advantages and disadvantages of Triple Bottom patterns.
Definition:
The Triple Bottom pattern is a bullish reversal pattern that occurs after a prolonged downtrend. It consists of three consecutive troughs, or lows, with roughly equal lows separated by temporary rallies. The pattern signifies a shift in market sentiment from bearish to bullish, as buyers gradually overcome selling pressure, leading to a potential trend reversal.
Formation:
The formation of a Triple Bottom pattern typically unfolds over an extended period, as the market undergoes multiple attempts to establish a bottom. Each trough represents a point where selling pressure becomes exhausted, followed by a temporary rally as buyers step in. The third trough, which forms near the same level as the previous two, signals a strong level of support and a potential reversal in the downtrend.
Trading Strategies:
Trading the Triple Bottom pattern requires patience and confirmation from other technical indicators. Here are some common strategies employed by traders:
Confirmation with Volume: A breakout from the Triple Bottom pattern accompanied by a surge in trading volume strengthens the validity of the reversal signal, indicating increased buying interest.
Entry on Breakout: Traders often wait for a breakout above the resistance level formed by the highs between the troughs to confirm the reversal. Entry can be initiated upon the close of the breakout candle or on a retest of the breakout level for added confirmation.
Measuring Price Targets: The height of the Triple Bottom pattern can be used to estimate potential price targets following the breakout. Traders often measure the distance between the lowest trough and the resistance level and project it upwards from the breakout point.
Confirmation from Oscillators: Oscillators such as the Relative Strength Index (RSI) or Moving Average Convergence Divergence (MACD) can provide additional confirmation of bullish momentum, supporting the Triple Bottom pattern signal.
Advantages:
Clear Reversal Signal: The distinct formation of three consecutive troughs with similar lows makes the Triple Bottom pattern relatively easy to identify on price charts, providing traders with a clear bullish reversal signal.
Defined Risk: Traders can set well-defined levels for stop-loss orders below the lowest trough of the pattern, aiding in risk management and trade planning.
Potential for Strong Upside: Triple Bottom patterns often indicate a significant shift in market sentiment, with the potential for a strong rally as buying pressure overcomes previous selling pressure.
Disadvantages:
False Signals: Like any technical pattern, Triple Bottom patterns are not infallible and can sometimes produce false signals, especially in volatile or choppy market conditions.
Subjectivity: Interpretation of Triple Bottom patterns may vary among traders, leading to subjective analysis and potential discrepancies in trading decisions.
Longer Formation Period: Triple Bottom patterns typically take longer to form compared to other chart patterns, requiring patience from traders to wait for the completion of the pattern and confirmation of the reversal.
In conclusion, Triple Bottom patterns offer valuable insights into potential bullish reversals in the market, providing traders with opportunities to profit from trend reversals. While they require patience and confirmation, mastering the art of identifying and trading Triple Bottom patterns can significantly enhance one's trading strategy and profitability. As with any trading strategy, proper risk management and disciplined execution are essential for success in trading Triple Bottom patterns.
0 notes
Text
Deciphering Symmetrical Triangle Patterns: A Comprehensive Guide
In the realm of technical analysis, traders seek patterns that offer insights into future price movements. One such pattern that frequently emerges on price charts is the symmetrical triangle. In this article, we'll explore the definition, formation, trading strategies, as well as the advantages and disadvantages of symmetrical triangle patterns.
Definition:
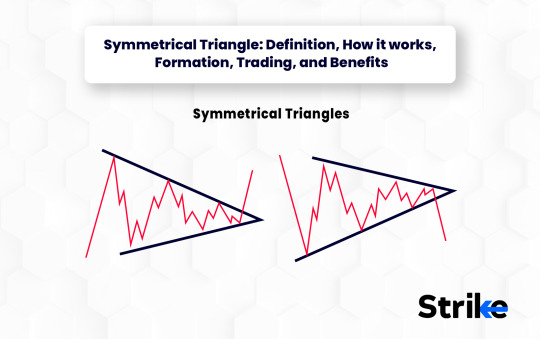
A symmetrical triangle is a chart pattern characterized by converging trendlines, forming a triangle with equal or nearly equal sloping highs and lows. This pattern indicates a period of consolidation, where the price oscillates between a narrowing range, reflecting indecision and a balance between buying and selling pressure.
Formation:
Symmetrical triangles typically develop during periods of market uncertainty, often after a significant price movement. The pattern forms as traders' conflicting expectations lead to a series of lower highs and higher lows, creating the converging trendlines. As the pattern progresses, the price approaches the apex of the triangle, signaling an imminent breakout.
Trading Strategies:
Trading symmetrical triangle patterns requires patience and a thorough understanding of price action. Here are some common strategies employed by traders:
Wait for the Breakout: Traders often wait for a clear breakout of the symmetrical triangle pattern before initiating a trade. Breakouts can occur to the upside or downside, indicating the direction of the impending trend.
Volume Confirmation: A breakout accompanied by a surge in trading volume lends credibility to the validity of the pattern and increases the likelihood of a sustained move in the breakout direction.
Measuring Price Targets: The height of the symmetrical triangle pattern can be used to estimate potential price targets following a breakout. Traders often measure the distance between the initial high and low of the pattern and project it from the breakout point.
Reversal Confirmation: In some cases, symmetrical triangles can act as reversal patterns, signaling a shift in the prevailing trend. Traders look for confirmation from other technical indicators or chart patterns to validate the reversal signal.
Advantages:
Visual Clarity: Symmetrical triangle patterns are easily recognizable on price charts, providing traders with a clear visual indication of market consolidation and impending volatility.
Defined Risk: The converging trendlines of a symmetrical triangle pattern allow traders to set well-defined levels for stop-loss orders, aiding in risk management and trade planning.
Versatility: Symmetrical triangles can occur across various timeframes, from intraday charts to long-term weekly or monthly charts, making them applicable to different trading styles and strategies.
Disadvantages:
False Breakouts: False breakouts are common occurrences in symmetrical triangle patterns, where the price briefly moves beyond one of the trendlines before reversing course. Traders must exercise caution and wait for confirmation before entering a trade.
Subjectivity: Drawing trendlines for symmetrical triangles involves some subjectivity, as different traders may identify slightly different trendline angles or points of intersection. This can lead to discrepancies in analysis and trading decisions.
Market Noise: In volatile or choppy markets, symmetrical triangle patterns may be less reliable, as erratic price movements can distort the formation of the pattern and increase the likelihood of false signals.
In conclusion, symmetrical triangle patterns are valuable tools for traders seeking to anticipate future price movements and capitalize on market volatility. While they require patience and confirmation, mastering the art of identifying and trading symmetrical triangles can significantly enhance one's trading strategy and profitability. As with any technical analysis tool, proper risk management and disciplined execution are essential for success in trading symmetrical triangle patterns.
0 notes
Text
Unlocking the Potential of Tri-Star Patterns in Trading: A Comprehensive Guide
In the vast world of technical analysis, traders often rely on patterns to anticipate market movements. One such pattern that has captured the attention of many analysts is the Tri-Star pattern. In this article, we'll delve into the definition, formation, trading strategies, as well as the advantages and disadvantages of Tri-Star patterns.
Definition:
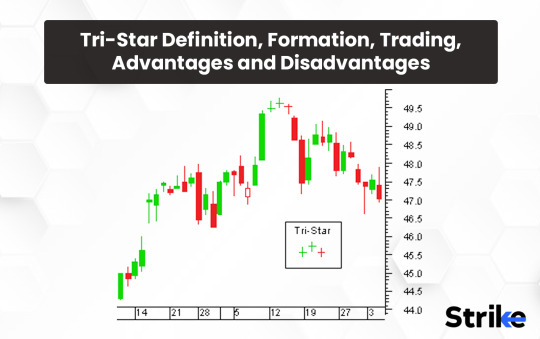
The Tri-Star pattern is a rare and powerful candlestick pattern that signifies a potential reversal in market direction. It consists of three consecutive doji candles, where each candle opens and closes at or near the same price, resulting in small or non-existent bodies. These doji candles are sandwiched between two longer candles, indicating a period of indecision and a potential shift in market sentiment.
Formation:
The formation of a Tri-Star pattern typically occurs after a prolonged uptrend or downtrend, signaling exhaustion among market participants. The first and third candles are usually longer, representing the initial momentum of the trend, while the three consecutive doji candles in between reflect uncertainty and a battle between bulls and bears.
Trading Strategies:
Trading the Tri-Star pattern requires careful observation and confirmation from other technical indicators. Here are some common strategies employed by traders:
Confirmation with Volume: An increase in trading volume during the formation of the Tri-Star pattern strengthens its validity and suggests a higher probability of a trend reversal.
Support and Resistance Levels: Identifying key support and resistance levels can enhance the reliability of the Tri-Star pattern. A Tri-Star pattern forming near a significant support or resistance level adds confluence to the potential reversal signal.
Use of Oscillators: Oscillators such as the Relative Strength Index (RSI) or Stochastic Oscillator can provide additional confirmation of overbought or oversold conditions, complementing the Tri-Star pattern signal.
Wait for Confirmation: It's prudent to wait for confirmation in the form of a subsequent candle confirming the reversal before entering a trade based solely on the Tri-Star pattern.
Advantages:
Early Reversal Signal: Tri-Star patterns often appear at key turning points in the market, providing traders with an early indication of a potential trend reversal.
Clear Signal: The distinct formation of three consecutive doji candles surrounded by longer candles makes the Tri-Star pattern relatively easy to identify on price charts.
Risk Management: Since Tri-Star patterns are formed over a short period, traders can set tight stop-loss orders to manage risk effectively.
Disadvantages:
Rare Occurrence: Tri-Star patterns are considered rare compared to other candlestick patterns, making them less prevalent and requiring patience to identify.
False Signals: Like any technical indicator, Tri-Star patterns are not foolproof and can sometimes produce false signals, especially in choppy or range-bound markets.
Subjectivity: Interpretation of Tri-Star patterns may vary among traders, leading to subjective analysis and potential discrepancies in trading decisions.
In conclusion, the Tri-Star pattern is a unique and valuable tool in a trader's arsenal, offering insights into potential trend reversals and market sentiment shifts. While it requires patience and confirmation from other technical indicators, mastering the art of identifying and trading Tri-Star patterns can significantly enhance one's trading strategy and profitability. As with any trading strategy, risk management and proper analysis are essential to maximize success and minimize losses.
0 notes
Text
Deciphering Market Optimism: A Comprehensive Guide to the Three Inside Up Candlestick Pattern
Introduction:
In the ever-evolving landscape of financial markets, traders rely on various technical indicators and patterns to gain insights into market sentiment and potential price movements. Among these patterns, the Three Inside Up candlestick pattern stands out as a bullish reversal signal, indicating a shift in momentum from bearish to bullish. In this article, we'll explore the intricacies of the Three Inside Up pattern, examining its formation, significance, interpretation, and practical applications for traders navigating the markets.
Understanding the Three Inside Up Candlestick Pattern:
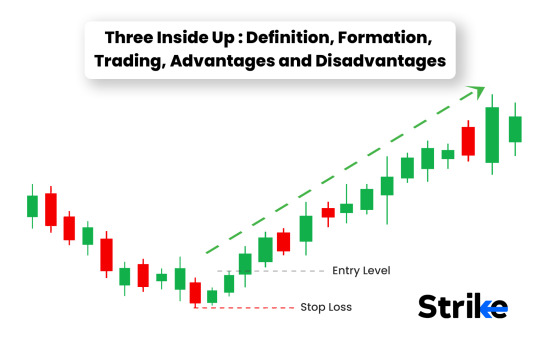
The Three Inside Up pattern is a bullish reversal pattern that consists of three candles and typically occurs at the end of a downtrend. It signifies a transition from selling pressure to buying pressure, with each candle revealing important insights into market dynamics. Let's break down the components of this pattern:
First Candle: The pattern begins with a long black (or red) candle, representing a bearish continuation of the existing downtrend. This candle reflects sustained selling pressure and often closes near its low, indicating dominance by sellers in the market.
Second Candle: The second candle, known as the "inside candle," is characterized by a smaller body that is completely engulfed by the preceding candle's body. It opens and closes within the range of the previous candle, suggesting a contraction in price volatility and indecision among market participants.
Third Candle: The third candle, which completes the pattern, is a bullish candle that closes above the high of the inside candle. This candle signifies a bullish reversal, as buyers regain control and push prices higher, overcoming the resistance posed by the previous candle.
Formation and Characteristics:
The formation of the Three Inside Up pattern provides valuable insights into market sentiment and potential price movements. Traders often look for the following characteristics to identify this pattern:
Contraction in Range: The presence of an inside candle between the first and third candles indicates a contraction in price range and a period of consolidation. This contraction reflects indecision among market participants and sets the stage for a potential reversal in trend.
Bullish Reversal Signal: The appearance of a bullish candle that closes above the high of the inside candle serves as a strong bullish reversal signal. It suggests that buyers have gained momentum and are poised to drive prices higher, marking the end of the preceding downtrend.
Confirmation from Volume: For added validity, traders often look for confirmation from trading volume. An increase in volume accompanying the formation of the Three Inside Up pattern reinforces the significance of the reversal, suggesting heightened buying activity and conviction among market participants.
Significance and Interpretation:
The Three Inside Up pattern holds significant implications for traders and analysts, providing valuable insights into market dynamics and potential price movements. Key points to consider include:
Reversal of Downtrend: As a bullish reversal pattern, the Three Inside Up signals a transition from a downtrend to an uptrend. It indicates that selling pressure has subsided, and buyers are stepping in to drive prices higher, potentially marking the beginning of a new upward trend.
Confirmation of Bullish Sentiment: The formation of the Three Inside Up pattern confirms bullish sentiment in the market, as evidenced by the successful breach of the previous candle's high. This confirmation encourages traders to consider long positions or to exit existing short positions in anticipation of further price appreciation.
Entry and Exit Signals: Traders often use the Three Inside Up pattern as a basis for entry and exit signals. Long positions may be initiated once the third candle closes above the high of the inside candle, while stop-loss orders can be placed below the low of the inside candle to manage risk.
Trading Strategies:
Traders employ various strategies to capitalize on the Three Inside Up pattern and its implications. Some common approaches include:
Long Positions: Traders may initiate long positions following the confirmation of the Three Inside Up pattern, aiming to profit from the anticipated uptrend reversal. This strategy involves buying assets or entering into bullish positions to ride the upward momentum.
Confirmation Signals: To enhance the reliability of the Three Inside Up pattern, traders often look for confirmation signals from other technical indicators or chart patterns. These may include bullish divergences, oversold conditions, or the formation of other bullish reversal patterns, providing added conviction to trading decisions.
Risk Management: While the Three Inside Up pattern signals a bullish reversal, it's essential for traders to implement proper risk management techniques. This includes setting stop-loss orders to limit potential losses and adhering to strict risk-reward ratios to ensure favorable risk-adjusted returns.
Conclusion:
In conclusion, the Three Inside Up candlestick pattern serves as a valuable tool for traders seeking to identify potential trend reversals and capitalize on emerging opportunities in the market. By understanding the formation, characteristics, significance, and trading strategies associated with this pattern, traders can enhance their ability to navigate dynamic market conditions and make informed trading decisions. However, as with any trading strategy, it's crucial to exercise caution, conduct thorough analysis, and employ proper risk management techniques to mitigate downside risks and optimize profitability.
0 notes
Text
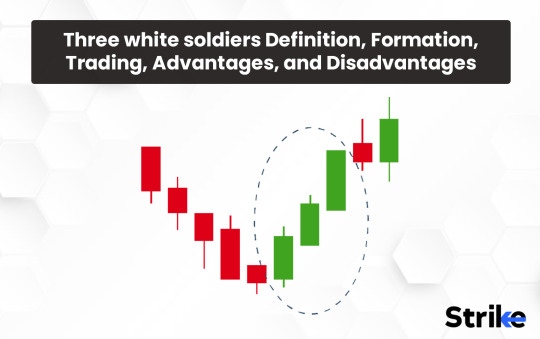
Unveiling the Three White Soldiers Candlestick Pattern: A Bullish Sign for Traders
Introduction:
In the realm of technical analysis, traders rely on various candlestick patterns to decipher market sentiment and forecast price movements. One such pattern that often heralds optimism among traders is the Three White Soldiers. This pattern, characterized by its bullish nature and representation of strong buying pressure, holds significance for market participants seeking opportunities in uptrending markets. In this comprehensive guide, we will delve into the intricacies of the Three White Soldiers candlestick pattern, exploring its formation, interpretation, significance, and potential trading strategies.
Understanding the Three White Soldiers Candlestick Pattern:
The Three White Soldiers pattern is a bullish reversal pattern that consists of three consecutive long white (or green) candles with small or nonexistent wicks. Each candle opens within the previous candle's real body and closes progressively higher, signifying a steady increase in buying momentum. The pattern typically occurs during a downtrend or a period of consolidation and indicates a shift in market sentiment from bearish to bullish. Let's break down the components of this pattern:
First White Soldier: The pattern begins with a long white candle that opens near the low of the day and closes near the high, reflecting strong buying pressure and bullish conviction among market participants.
Second White Soldier: Following the first candle, the second white soldier appears with similar characteristics—a long white body with a small or nonexistent wick. It opens within the previous candle's real body and continues the upward momentum, closing near its high.
Third White Soldier: The third candle completes the pattern, continuing the trend established by its predecessors. Like the first two soldiers, it opens within the previous candle's real body and closes near its high, reaffirming the bullish sentiment and indicating sustained buying pressure.
Formation and Characteristics:
The formation of the Three White Soldiers pattern signifies a decisive shift in market dynamics, with buyers seizing control from sellers. Traders often look for the following characteristics to identify this pattern:
Long White Bodies: Each candle in the pattern is characterized by a long white body, indicating significant buying pressure and bullish sentiment prevailing in the market.
Absence of Upper Wicks: Ideally, the candles in the Three White Soldiers pattern should have small or nonexistent upper wicks, indicating that buyers remained in control throughout the trading session, pushing prices higher without significant retracements.
Progressive Higher Closes: One of the key features of the Three White Soldiers pattern is the progressive higher closes of each candle, reflecting the increasing dominance of buyers and their ability to push prices higher with each successive candle.
Significance and Interpretation:
The Three White Soldiers pattern holds significant implications for traders and analysts alike, serving as a reliable bullish reversal signal. Key points to consider include:
Reversal Signal: As a bullish reversal pattern, the Three White Soldiers signal a shift from bearish to bullish sentiment in the market. The pattern often marks the end of a downtrend or a period of consolidation, signaling the potential onset of an uptrend.
Confirmation of Buying Pressure: The successive formation of three long white candles underscores the strength of buying pressure and the conviction of market participants. Traders interpret this pattern as a sign of increasing bullish momentum and a willingness to bid prices higher.
Breakout from Consolidation: In addition to signaling a reversal in trend, the Three White Soldiers pattern often coincides with a breakout from a period of consolidation or range-bound trading. This breakout confirms the resumption of the uptrend and presents traders with an opportunity to capitalize on the upward momentum.
Trading Strategies:
Traders employ various strategies to capitalize on the Three White Soldiers pattern and its implications. Some common approaches include:
Long Positions: Traders may initiate long positions or add to existing positions following the confirmation of the Three White Soldiers pattern. This strategy aims to ride the upward momentum and profit from the anticipated continuation of the uptrend.
Confirmation Signals: To enhance the reliability of the Three White Soldiers pattern, traders often look for confirmation signals from other technical indicators or chart patterns. These may include bullish divergences, oversold conditions, or the formation of other bullish reversal patterns, providing added conviction to trading decisions.
Risk Management: While the Three White Soldiers pattern signals a bullish reversal, it's essential for traders to implement proper risk management techniques. This includes setting stop-loss orders to limit potential losses and adhering to strict risk-reward ratios to ensure favorable risk-adjusted returns.
Conclusion:
In conclusion, the Three White Soldiers candlestick pattern serves as a valuable tool for traders seeking to identify potential trend reversals and capitalize on emerging opportunities in the market. By understanding the formation, characteristics, significance, and trading strategies associated with this pattern, traders can enhance their ability to navigate dynamic market conditions and make informed trading decisions. However, as with any trading strategy, it's crucial to exercise caution, conduct thorough analysis, and employ proper risk management techniques to mitigate downside risks and optimize profitability.
1 note
·
View note