
Last Seen Blogs


Text
Capstone Project 3
My choice of data for the capstone project is from DrivenData. The data records nearly 60,000 water mines, including some features and the functionality, which is the response variable. I decided to use 9 predictors, in total, for this prediction.
First I plot the frequency of functionality of all water mines.
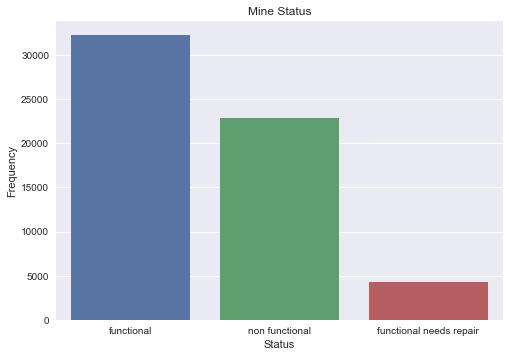
From the graph, we can find that around half of all water mines are functional. So I think it is important to analyze if there is a difference between those functional mines and those that are not.
Then since there are multiple predictors, I decided to use plot PairGrid to see the analysis between each feature and the response variable.
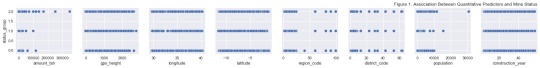
In the graph, I let 2 denote that the mines are functional, 1 denote the mines are functional but need repair, and 0 denote that the mines are not functional. From the graph, I found that the difference between each group of mines in terms of predictors are very subtle. The only difference to help categorize are some outliners. So I think all features are needed to help make predictions.
0 notes
Text
Project Methods
Sample
The sample was drawn from the data provided by Taarifa and the Tanzanian Ministry of Water. This sample measures aspects of a water point and the goal is to use the data to predict the functionality of each water point. The initial sample size is 59,400. I choose all the quantitative variables, and one categorical variable “public_meeting.” Because these variables have more connection to the functionality of water points. The result training set gives 36,385 samples. This sample measures aspects of a water point and the goal is to use the data to predict the functionality of each water point.
Measures
All the variables used to predict “status_group” is shown below:
amount_tsh - Total static head (amount water available to waterpoint)
gps_height - Altitude of the well
longitude - GPS coordinate
latitude - GPS coordinate
region_code - Geographic location (coded)
district_code - Geographic location (coded)
population - Population around the well
public_meeting - True/False
construction_year - Year the waterpoint was constructed
After choosing these variables, I drop all the data with nan or have no record on “construction year.” Besides, I computed the number of years from the water points were established to replace the original data in construction year.
Analyses
Since the response variable is a three-level categorical variable, I decided to use three methods to predict: Decision Tree, Random Forest and Adaboost. Each method is suitable in this situation. I split the data to get a train set as 60% of the whole data and the rest 40% are test set. In the end, I used 10-fold cross validation to verify and help select the best method.
0 notes
Text
Research on Data Mining the Water Table
After carefully examining all of the options for this project, I choose to compete in the drivendata website.
The title of this research is “Research on Data Mining the Water Table.”
My capstone project will be about data mining the water table. The goal of the competition is to predict the functionality of each water point. The whole data table includes all kinds of information about each observations on water points, such as Total static head and The kind of extraction the waterpoint uses. I am going to extract information relevant to the project and make an analysis on it.
I choose this competition simply because of my interest. I do not have a particular intention about which dataset and research to do right now. All I want is a project that gives me practice on what I have learned. Since this research question is particularly interested to me, I decided to use this as my capstone project.
The content of this research has a great impact on many poverty area, especially those with difficulty getting enough water. This research could help people to determine the condition of each water point and ensure Tanzanian people could get clean and potable water.
0 notes
Text
K-Means Cluster Analysis
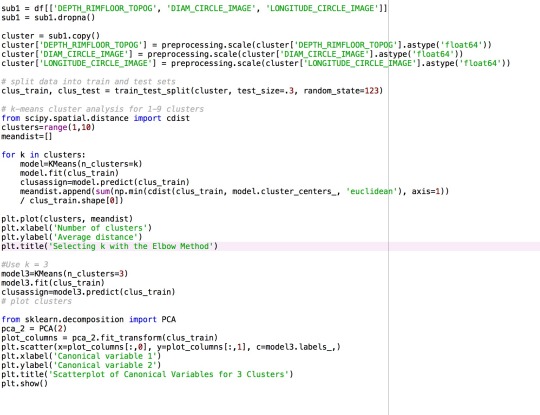
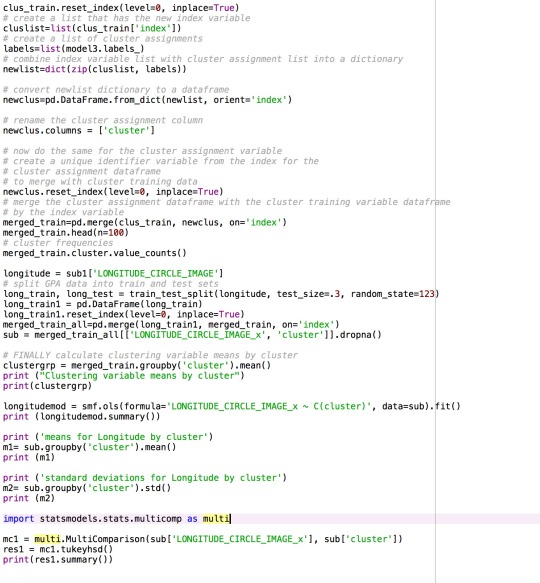
Code:
Output:
Summary:
I used longitude, diameter and depth as three main variables for this program.
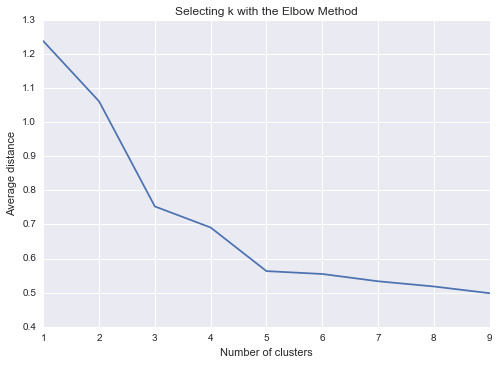
First I checked from 1 to 9 clusters for the data. The results show that the elbow points are 3 and 5, which are the most obvious ones. Therefore, I chose 3 as my number of clusters.
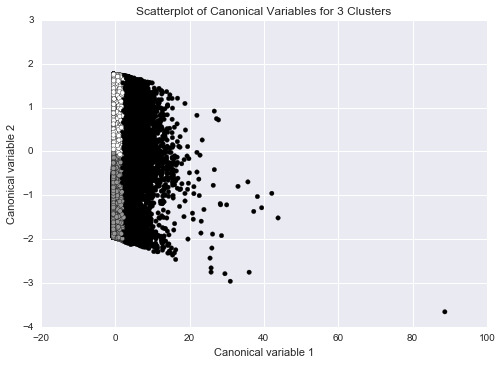
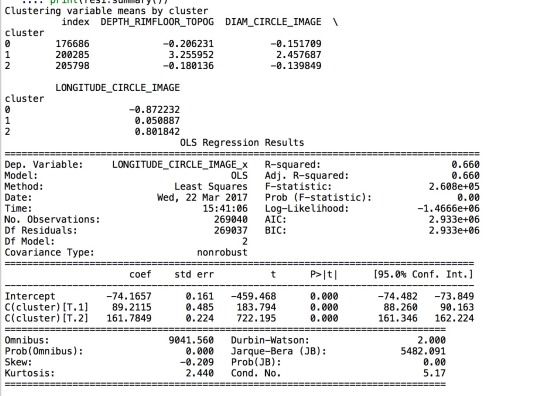
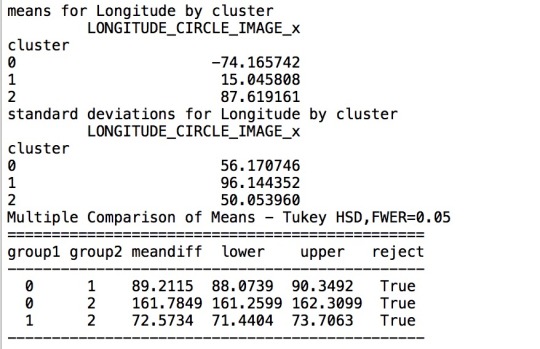
So I ran the k-means cluster analysis. The graph, shown above, represents the clusters for the data. Then I ran the ANOVA test on the data, the results show that there is a significant difference among all three clusters for longitude (-74, 15, 88).
0 notes
Text
Logistic Regression
Code:
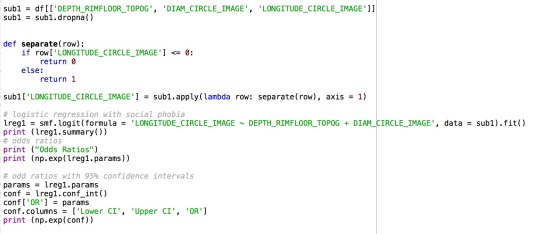
Output:
Summary:
Since my objective is to find the potential relationship between the locations and sizes of craters, I made diameters and depths as my explanatory variable, while made longitude as my response variable.
I first transform the longitude into two categories based on whether it is a positive or negative value. Therefore, this regression actually finds the relationship between sizes of a crater and whether this crater is in south or north half of Mars. 0 means south, and 1 means north.
The regression result is shown above. For depth, it has an odds ratio of 1.26, with 95% confidence interval from 1.21 to 1.30, while the p value is less than 0.001. Therefore, it shows that, as the depth of craters increases, there is a slight tendency that these craters are in north half of Mars. As for diameter, it has an odds ratio of 1.00, with 95% confidence interval from 0.999 to 1.002, while the p value is 0.196. Therefore, we can conclude that diameter is a less meaningful factor to predict the location of craters, since the odds ratio is very close to 1.
0 notes
Text
Multiple Regression
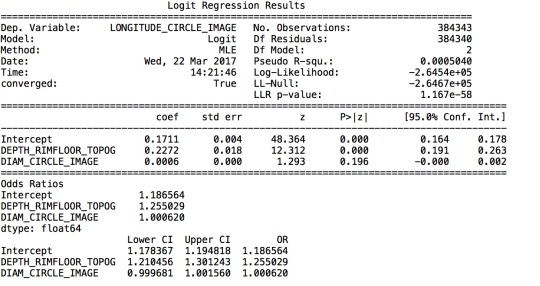
Code:
Output:


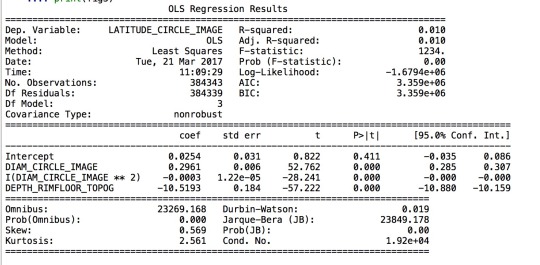
Summary:
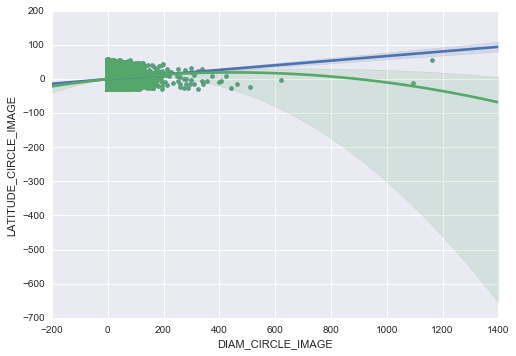
I used diameters and depths of craters as my explanatory variables, and latitude of craters as my response variables. And I put my main focus on diameters as my primary factor, since this variable represents the size of craters in a large scale.
The first four outputs represent the model I created. The first model suggests a very high p-value for the intercept. The plot for diameter shows that the quadratic fit seems to be a better fit than a linear one. Then I include the quadratic term in the formula, which decreases the p-value significantly. Therefore, I believe that this is a great model to use. In all three cases, the R-Squared value is smaller than 0.05, which suggests that the model fits quiet well. The results show that I cannot reject my hypothesis that there is association between my explanatory variables and response variables. In the last mode, the coefficient for the quadratic term of diameter is extremely. The intercept coefficient is also pretty low, so I would suspect that the model actually does not worth using for testing.
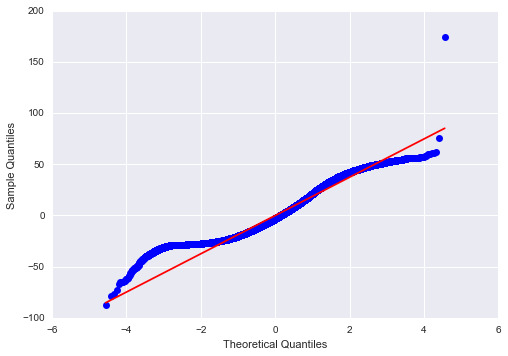
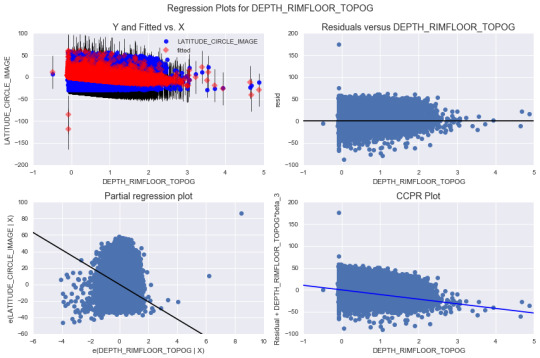
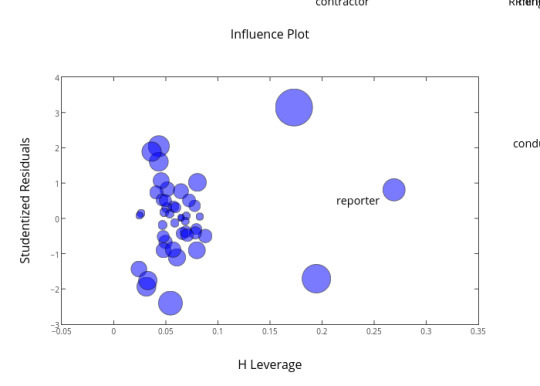
Then I plot the evaluation plots to analyze the model. The QQ-plot provides information that all quantiles are pretty much in a linear line. Then the four residue plots suggests that the model actually has a very high residues for all cases. The data mostly is in the positive or negative 50 residue, and there are still some outliners, which go to over 150 residue. Therefore, the regression created seems a bad one in terms of actually predicting. The leverage plot provides information about the outliners. As the plot shows, there are many suspicious outliners that has an impact on the model.
0 notes
Text
Lasso Regression
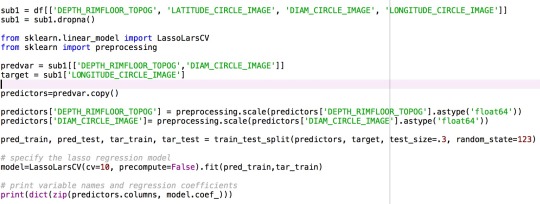
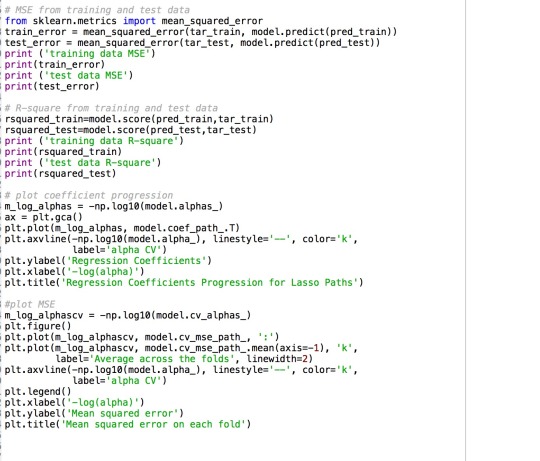
Code:
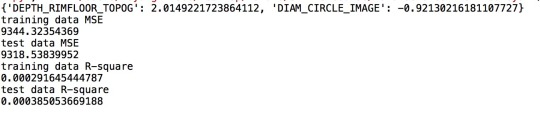
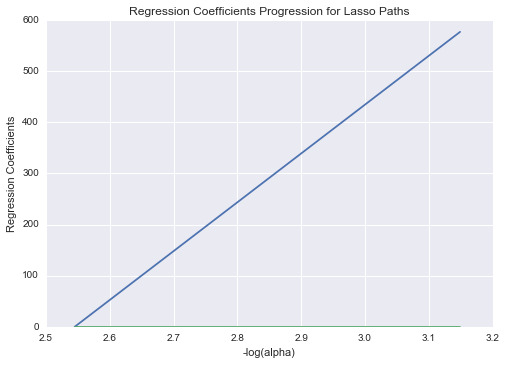
Output:
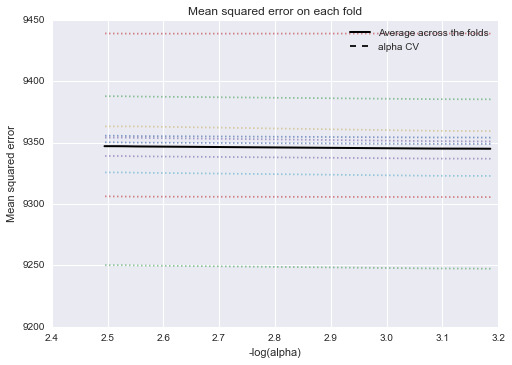
Summary:
I ran a regression program based on the information about the craters. As I suspected that there is relationship between the size of a crater, I made both diameter and depth as my explanatory variables and longitude as my response variable.
The model suggests a very high error both in the test and train data. Besides, the R-Squared value is also pretty low. And they are pretty consistent in the test and train results. Therefore, I can conclude that the explanatory variables and response variable are not related in a large scale. It is hard to find the real relationship among them. In addition, the graph also suggests the same for the results I got from the model itself.
0 notes
Text
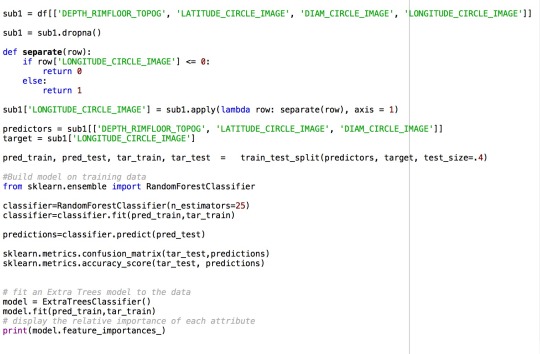
Random Forest
Code:
Output:

Summary:
I decided to use the same response and explanatory variables as that in the decision tree model. I consider the longitude of any craters in negative value to be 0 and positive to be 1, which creates a binary response variable. Then the diameters, latitude and depth are three explanatory variables.
After running the Random Forest model. I found that in these three variables, latitude is the most likely factor the account for the variance of longitude, while depth is the most unlikely one. Therefore, I will consider running more programs using other proper models to find out how much the diameters of craters are related to the location of the craters, especially on the question of north or south half.
0 notes
Text
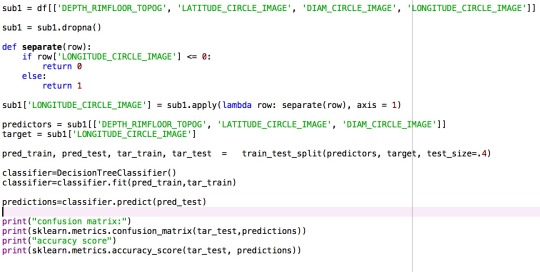
Decision Tree
Code:
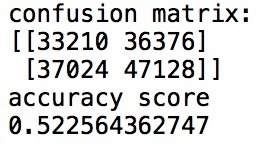
Output:
Summary:
Since my research is on the relationship between the locations of craters on Mars and their sizes, I decided to transform longitude into a categorical variable, 0 for negative values and 1 for positive values. Then I try to use latitude, diameter and depth these three variables as explanatory variable and transformed longitude as my response variable.
As the output shows, the model is not good. These three variables only provide about half of information for the categorical variable of longitude. So I believe it is not a good model to predict the longitude or there are more information that may has an impact on the result. All of these three explanatory variables are quantitative variables. So I believe that this model does not work well because the relationship between the explanatory and response variables is not sufficient to predict any variance of the response variable. I believe that there are some more data independent from these three explanatory variables would help to predict the result.
0 notes
Text
Moderator Analysis
Code:
Output:
Summary:
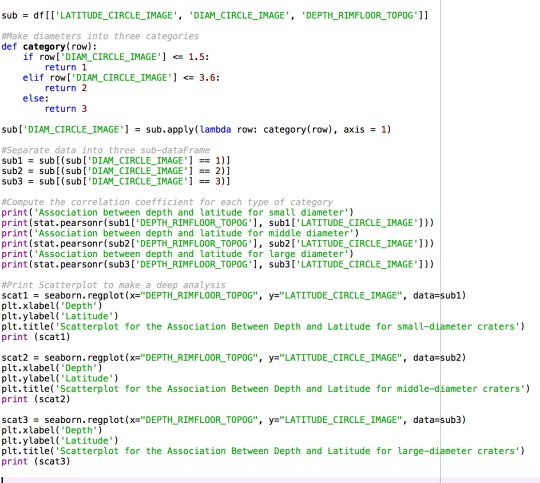
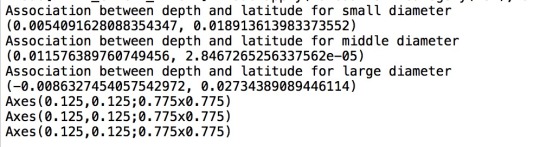
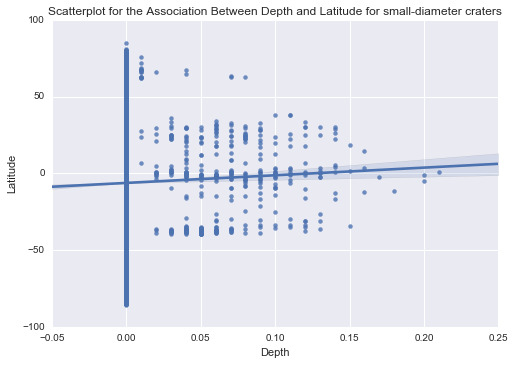
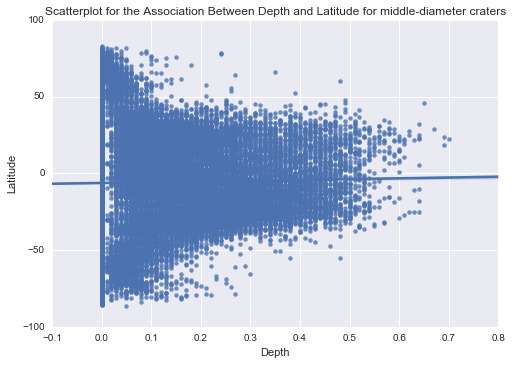
Follow my initial research problem that is to find the potential relationship between sizes of craters and their locations, I decided to make diameters as moderator and evaluate the association between depth and latitude under each category of diameter.
After running the program, the correlation coefficients show that there is no significant association between them, but in both small and large diameter categories, the R-Squared values are much larger. So, in both small and large diameter categories, I believe that there is potentially some associations between depth and latitude, which seem to be different from the one in middle diameter category.
In conclusion, I believe that there is no significant relationship between depth and latitude considering the diameter as the moderator.
0 notes
Text
Correlation
Code:
Output:
Summary:
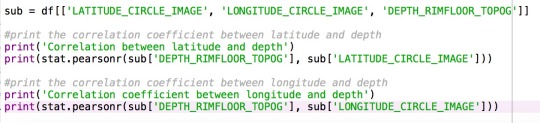
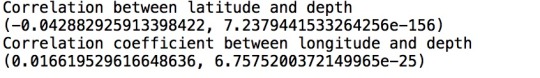
My research is to determine if the sizes of craters are related to the location. For this test, I chose to test the correlation coefficient between latitude, longitude and depth of craters.
As the output shows, both coefficients are pretty close to 0. Therefore, I can conclude that the relationship between depth of craters and latitude or longitude of craters is pretty weak. Besides, the R Squared values are also extremely low for both cases, if we know the depth of craters, we cannot even predict 0.1% of variability of latitude or longitude.
0 notes
Text
Linear Regression
Code:
Output:
Summary:
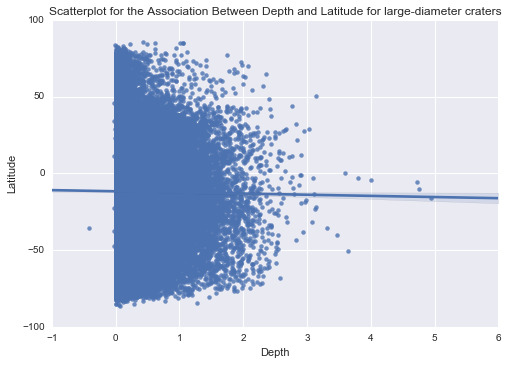
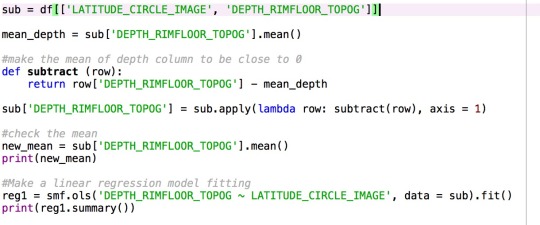
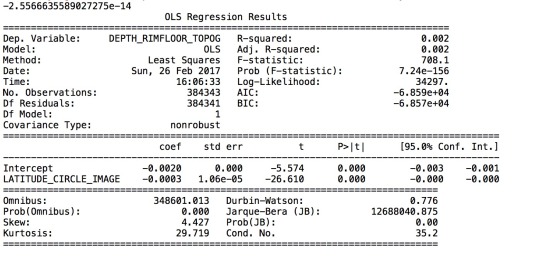
My code is to check the linear regression between the depth of all craters, as explanatory variable, and the latitude of the craters, as response variable. Since both variables are quantitative variables, I subtracted the mean of depth from all samples of depth. The resulting depth column has a mean of “-2.56e-14,” which is extremely small.
Then I ran the linear regression model. The result table shows that all observations are counted into the model. The model can be explained using the formula LATITUDE = -0.002 + (-0.0003) * DEPTH. But the R-Squared value is extremely small, which means that the variability of depth alone does not explain a lot on the variability of latitude. More factors may have impact on determining the latitude of the craters.
0 notes
Text
Chi Square Test
Code:
Output:
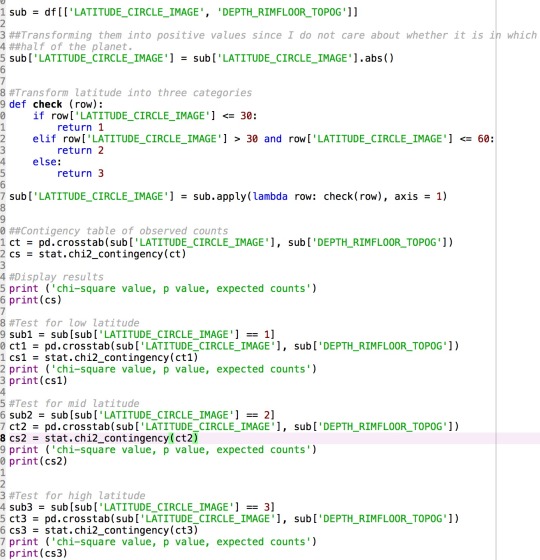
Summary:
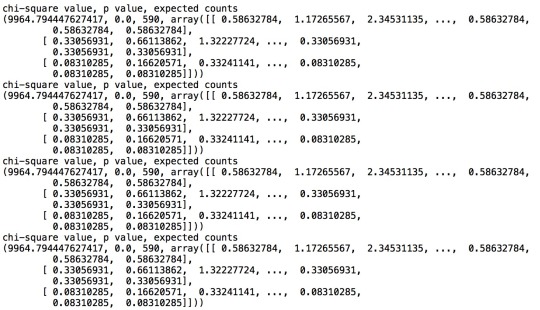
To find out if the levels of latitude are related to the depth of the craters, I transformed all latitude data into three categories based on the data, which are 1 = low, 2 = medium and 3 = high. Then I ran the Chi-Square test to test whether the there is a difference of depth in all three categories. The result shows that there is a difference among three categories since the p-value is very low.
Then I ran the post-hoc test for all three categories to see if any one of the categories stand out to explain the difference. The results show that all three of them seem to be related equally as the p-values are equal. This means that there should be a difference between three levels of latitude in terms of depth of craters.
0 notes
Text
About my Data (Variables)
Variables
My explanatory variables are the depth and diameter of the craters, and the response variables are the latitude and longitude of the craters. The depth and diameters are both measured in kilometers, while the latitude and longitude are measured in degrees. I put variables together to find the potential relationship between them, based on the knowledge that I suspect that craters were created by different sizes of asteroids, which will hit on different locations since they have different sizes. Also since the data was collected directly from the telescope near the Mars, I am able to use the data directly without modifications.
0 notes
Text
About my data (Procedure)
Procedure
The study originally only focuses on the measurement of all craters identified and researchers made observations and measurements to get the data. The original purpose for the data collected is to record the craters and make an analysis of all the craters on crater physics and potential volcanic activity on Mars. The data was collected using the Mars Odyssey NASA spacecraft that is a multi-spectral thermal-infrared imager. And the data was collected in 2010 in NASA.
0 notes
Text
About my data (sample)
Sample
The study will be focused on craters on Mars and involves an aggregate level of samples. The number of observations is 378,540. My sample is from the New Global Martian Crater Database. They collected 378,540 craters that covers craters that has a diameter larger or equal to 1 km. The sample includes the location, depth, diameter and morphology. For my study, I will cover the aggregate level of all the data. I will use depth, diameter, latitude and longitude to justify if there exists a relationship between the size (depth and diameter) of craters and their locations (latitude and longitude).
0 notes
Text
Graph of data
I decided to continue to analyze the relationship between location and depth of craters on Mars.
Here are the codes, after the importing stuff:
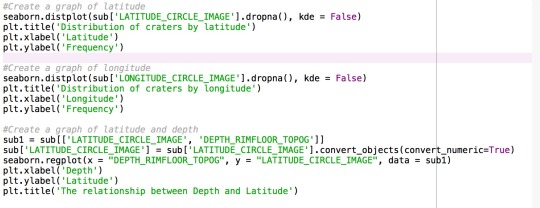
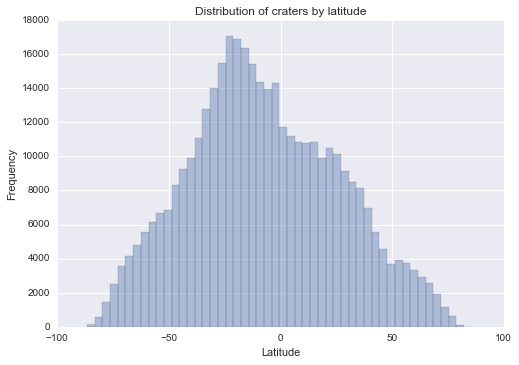
Then I got the graph of latitude of craters
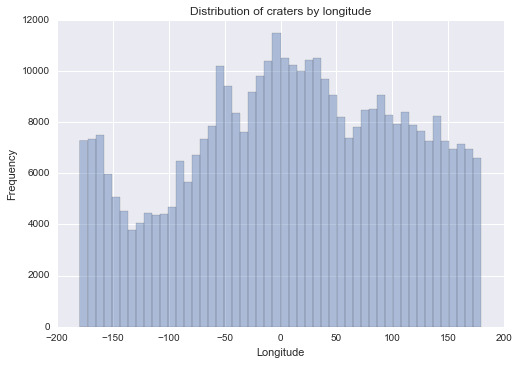
And the longitude
Since latitude shows a clear center in the middle, I decided to use latitude to analyze the relationship between latitude and depth of craters (I changed all values of latitude to absolute values since it does not matter much in terms of which half of the planet):
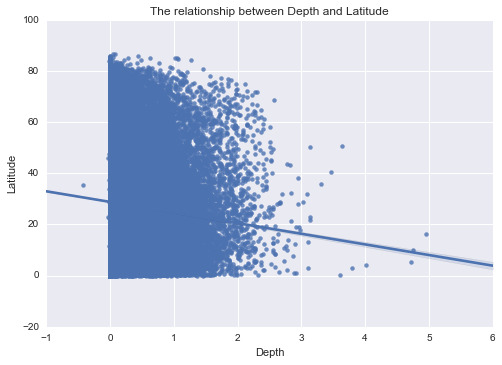
In summary, the first graph shows that the craters are centered near the equator a lot, with an emphasis on the southern part of Mars. The second graph shows no significant sign of distribution of Mars differed in terms of longitude. The last graph does provide a negative relationship between absolute Latitude and Depth, which means that smaller craters are more likely to show in low latitude area. But it still worth discussing for future analysis.
0 notes