
Last Seen Blogs

jzxr7
Sometimes I Write Fic. Mostly I Scream In The DMs.

benhviennamkhoa
Bệnh Viện Nam Khoa Hải Phòng

tantive404
"charming, to the last."


a-bird-sometimes
Bird's Wandering
Text
SQL Diagnostic Manager
Physical and Virtual Performance Monitoring
Easily monitor and view the performance of both physical server and VMware or Hyper-V virtual server environments to get a complete view of SQL Server databases. View performance metrics and alerts for virtual machines and their related hosts including CPU, memory, disk usage, network etc. to get a complete performance picture of the SQL server environment.
Query Performance Monitoring
Identify and monitor inefficient and poor performing SQL queries, batches, statements and stored procedures causing blocks and deadlocks, such as long or most frequent queries or queries consuming unusually high CPU or I/O. Thresholds can be configured on each individual server allowing for greater flexibility, and the interface makes it very easy to see the most costly queries by looking at individual query executions or query signatures.
*NEW* Transactional SQL Server Application Monitoring with SQL Workload Analysis
Now available in the Pro version of SQL Diagnostic Manager
SQL Workload Analysis focuses on wait state and application transaction monitoring and analysis by continuously sampling queries and plans. It significantly upgrades the wait state analysis capabilities.
Combine the operational monitoring from SQL Diagnostic Manager and transactional monitoring with SQL Workload Analysis to view instance properties and alerts, receive prescriptive recommendations for operational diagnosis, analyze workloads for transactional diagnosis, and arrive at a comprehensive root cause analysis.
Integrated SQL Doctor Expert Recommendations
Expert recommendations from IDERA SQL Doctor are now integrated into SQL Diagnostic Manager. Enhance performance and speed up problem resolutions with built-in tuning advice and best practices developed by SQL Server MVPs. These updated recommendations are integrated into analysis workflows and provide specific guidance to address problem issues including automatic corrective scripts and links to related online content to supercharge your SQL Server performance.
Predictive Alerting
Avoid false alarms with adaptive alerting functionality and set alert thresholds based on built-in historical statistical analysis of your server performance data.
The system has embedded heuristic analysis of event trends and behaviors and presents a percentage of likelihood that various events could happen later in the day based on past behavior trends. This helps DBAs to be better prepared to diagnose, drill down, and resolve an issue quickly and effectively.
Mobile Access
Access SQL Diagnostic Manager from anywhere. Use any mobile device, such as iPhone, Android, Blackberry or Tablet to view real-time and historical SQL Server performance data. Plus, view or kill sessions, start/stop jobs and run queries to resolve or diagnose issues remotely while on-the-go.
View a demo of SQL Diagnostic Manager mobile.
Web Dashboard
Log in from anywhere and quickly check the status of monitored server instances to identify and diagnose issues. View the current status of monitored instances, drill down into single instance details, view the top occurrences of performance issues, and see a rollup of all active alerts. Customize your display with eighteen new widgets, enhanced heat map view, and query wait state visualizations. Create any number of individually configured dashboards to address the needs of the entire organization.
Integration with SCOM
The SQL Diagnostic Manager Management Pack provides easy integration with Microsoft’s System Center Operations Manager (SCOM). The Management Pack propagates the current status, health and events of all monitored instances up to Operations Manager, allowing the DBA and IT Operations staff to share data at a higher level across their enterprise. The management pack is easy to install and does not incur any additional monitoring overhead. Read the FAQ and watch a quick 5 minute video to learn more.
13 notes
·
View notes
Text
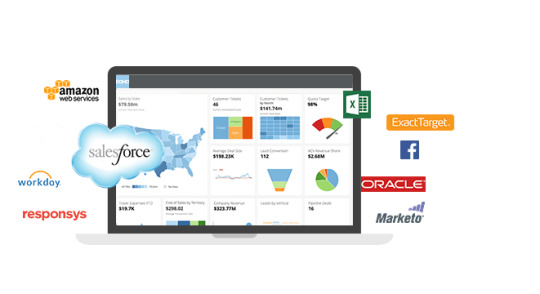
Salesforce CRM U.S

Salesforce CRM
Salesforce began in 1999 with a vision of reinventing Customer Relationship Management (CRM). Since then our pioneering use of cloud computing has revolutionised the way enterprise software is delivered and used, changing the industry forever.
Ever since we launched our first CRM solution, Salesforce products have run entirely in the cloud. That means it’s all online – no software, no hardware. There are no expensive setup costs, no maintenance, your employees can work from any device with an internet connection – smartphone, tablet or laptop – and with 3 free upgrades every year it is ideal for small businesses and large enterprises alike. This revolutionary approach has helped to make Sales Cloud the world’s number 1 CRM system.
But Salesforce is more than just a single product – it’s a complete integrated solution for managing all interactions with your customers and prospects, designed to help your organisation grow and succeed.
2 notes
·
View notes
Text
Microsoft: Database as a Service (DaaS)
“We would like to have the data flow to our clients like ‘water from the faucet” stated the customer for which this solution was designed. This on-premises (on-prem) SQL Server based application contains crucial financial data for the external clients of this customer. External clients using this solution subscribe to this data and there is a need to deliver a subset of this data (8 Terabytes (TB) and growing) to them based on their subscription levels and requirements. A significant number of challenges are present with the current on-prem solution to meet these needs.
Current Challenges
Currently, a custom solution is in place to manually export the subset of the data that each external client needs and to “ship” it to the individual client via File Transfer Protocol (FTP). It currently takes 3 to 4 weeks for on-boarding a new external client with this process. This custom solution is also meant to identify and extract on-going changes and manually push these changes to the individual customers, which takes 1 to 2 days. These external clients are obviously not happy with the latency in data delivery.
Multiple cases of data loss and corruption have also been experienced with this solution. Moreover, the entire solution is disconnected as there is no control over the data sets that are being delivered which poses security concerns, not to mention the monitoring and maintenance challenges.
1 note
·
View note
Text
IoT alimenta crescimento de malware Linux

Malware que visa sistemas Linux está crescendo, em grande parte devido à proliferação de dispositivos criados para se conectar à Internet das coisas.
Essa é uma das descobertas em um relatório WatchGuard Technologies, um fabricante de dispositivos de segurança de rede, lançado na semana passada.
O relatório, que analisa os dados coletados de mais de 26.000 aparelhos em todo o mundo, encontrou três programas de malware Linux nos 10 melhores do primeiro trimestre do ano, em comparação com apenas um durante o período anterior.
“Os ataques e malwares do Linux estão aumentando”, escreveu o diretor de atenção da WatchGuard Corey Nachreiner e o analista de ameaças da segurança Marc Laliberte, co-autores do relatório. “Nós acreditamos que isso é porque as fraquezas sistêmicas nos dispositivos IoT, emparelhados com seu rápido crescimento, estão dirigindo autores de botnet para a plataforma Linux”.
No entanto, “o bloqueio de Telnet e SSH de entrada, juntamente com o uso de senhas administrativas complexas, pode impedir a grande maioria dos possíveis ataques”, sugeriram.
“Os atacantes podem ter acesso a essas interfaces vulneráveis, depois carregar e executar o código malicioso de sua escolha”, disse Fletcher.
Os fabricantes freqüentemente têm configurações padrão precárias para seus dispositivos, ele apontou.
“Muitas vezes, as contas de administrador têm senhas em branco ou senhas padrão fáceis de adivinhar, como” senha123 “, disse Fletcher.
Os problemas de segurança geralmente não são “nada específico do Linux per se”, disse Johannes B. Ullrich, diretor de pesquisa do Instituto SANS.
“O fabricante é descuidado sobre como eles configuraram o dispositivo, então eles tornam trivial a exploração desses dispositivos”, disse ele ao LinuxInsider.
Malware no Top 10
Esses programas de malware Linux criaram o top 10 no recorde do WatchGuard no primeiro trimestre:
Linux / Exploit, que captura vários trojans maliciosos usados para escanear sistemas para dispositivos que podem ser alistados em um botnet.
Linux / Downloader, que captura scripts de shell malévolos do Linux. O Linux é executado em muitas arquiteturas diferentes, como ARM, MIPS e chipsets tradicionais x86. Um executável compilado para uma arquitetura não será executado em um dispositivo com um diferente, o relatório explica. Assim, alguns ataques do Linux exploram scripts shell shell para baixar e instalar os componentes maliciosos apropriados para a arquitetura que eles estão infectando.
O Linux / Flooder, que captura ferramentas de distribuição de negação de serviço do Linux, como Tsunami, usado para executar ataques de ampliação DDoS, bem como ferramentas DDoS usadas por botnets Linux como o Mirai. “Como o botnet Mirai nos mostrou, os dispositivos IoT baseados em Linux são um alvo primordial para os exércitos de botnet”, observa o relatório.
Servidor Web Battleground
Uma mudança na forma como os adversários estão atacando a Web ocorreu, o relatório WatchGuard anota.
No final de 2016, 73 por cento dos ataques da Web visavam clientes – navegadores e software de suporte, a empresa encontrou. Isso mudou radicalmente durante os primeiros três meses deste ano, com 82% dos ataques da Web focados em servidores da Web ou serviços baseados na Web.
“Nós não pensamos que os ataques de estilo de download drive-by vão desaparecer, mas parece que os atacantes concentraram seus esforços e ferramentas na tentativa de explorar ataques do servidor da Web”, escreveram os co-autores Nachreiner e Laliberte.
Houve um declínio na eficácia do software antivírus desde o final de 2016, eles também encontraram.
“Pelo segundo trimestre consecutivo, vimos a nossa solução AV avançada faltar uma grande quantidade de malware que nossa solução mais avançada pode capturar. Na verdade, aumentou de 30% para 38%”, informou Nachreiner e Laliberte.
“Hoje em dia, os cibercriminosos usam muitos truques sutis para reembalar seu malware, de modo que evade a detecção baseada em assinatura”, observaram. “É por isso que muitas redes que usam o AV básico são vítimas de ameaças como o Ransomware”.
1 note
·
View note
Text
Domo Advanced Builder Enhances and Extends Salesforce.com Dashboards and Reporting
Because of its advanced feature set and innovative delivery model, Salesforce.com has become the leader in software-as-a-service (SaaS) customer relationship management (CRM) software and has been adopted by many organizations as their de facto solution for storing CRM data, tracking sales activities and creating forecasts.
Domo Advanced Builder simplifies and enhances these capabilities by bringing together Salesforce.com reports and data from other enterprise systems into one intuitive, comprehensive view, and by creating dashboards that track multiple variables without requiring users to rerun multiple reports.
Domo Advanced Builder provides organizations that use Salesforce.com with additional value by providing these benefits: • Viewing data from multiple sources on one dashboard
• Accessing dashboards through Domo Advanced Builder or Salesforce.com
• Querying Salesforce.com data with the query wizard
• Simplifying Salesforce.com reporting
• Improving time to access Salesforce.com data
• Customizing the appearance of information
• Communicating securely between Domo Advanced Builder and Salesforce.com
5 notes
·
View notes
Text
DOMO SALESFORCE : How Domo works with Salesforce.

Regardless of whether you live and inhale Salesforce consistently, or in case you’re a pioneer who needs bits of knowledge without the quick and dirty points of interest, Domo makes your Salesforce information less demanding to devour and after that put to utilize. Also, Domo encourages you consolidate Salesforce bits of knowledge with information from whatever other source, so you can make quicker, better-educated choices.
Preview authentic information
Disentangle cross-protest announcing
Effective Salesforce detailing choices
Oversee by special case
Consolidation Salesforce information with whatever other framework
5 notes
·
View notes
Text
IDERA SQL Update Statistics – Free Tool
Launch directly within SSMS for optimal usability
Identify out-of-date SQL Server table and index statistics
View and change database statistics options
Create graphical histograms for each column’s statistics
Easy point-and-click rebuilding of statistics
Connect to cloud and run in cloud (provisional)Identify Out-of-Date Statistics
Review the current state of the table and index statistics to determine if they need to be updated.
View and Modify Statistics Options
See the current automatic update statistics settings for the monitored database. Select database properties and table statistics to update, as well as, when to update statistics and sample size.
View Heartbeat Statistics
Build your own easy-to-read graphical view of each column’s statistics. Find out when statistics were last updated and changes since the last update.
Easily Rebuild Statistics
Use SQL Update Statistics’ point and click interface to initiate table and index statistics updates quickly and easily.
Integrate with SSMS
Designed to launch directly within SQL Server Management Studio (SQL 2012 and above) for optimal usability and efficient workflow.
Connect to Cloud and Run in Cloud (Provisional)
Connect to database instances hosted in the cloud, such as SQL Server on Azure Virtual Machine (VM), SQL Server on Amazon Elastic Compute Cloud (EC2), and SQL Server on Amazon Relational Database Service (RDS).
Run on virtual machines hosted in the cloud, such as Windows on Azure Virtual Machine (VM) and Windows on Amazon Elastic Compute Cloud (EC2).
2 notes
·
View notes
Text
*New* SQL Instance Check – Free Tool
Discover All SQL Server Versions
Discover what versions of SQL Server you have by scanning your entire network. Several different scan methods and protocols are available to provide you a complete picture. Scan one IP at a time by IP address, IP range, local subnet, server or computer name, or a stealth probe search. The stealth probe identifies servers registered to the Network Browser Service or the Active Directory.
Patch Compliance Check SQL Servers
Staying on top of security patches and updates is an important part of overall SQL Server maintenance. Knowing what version each server has installed and what updates are available helps you better plan upgrades across your environment. The list of available updates from Microsoft is regularly updated by IDERA making it easy to stay current.
Discover Key SQL Server Information
Find out about the current and latest version of SQL Server instances and their IP addresses. View information about available updates: build number, description, support status, and web address to the relevant knowledge base.
Simple Installation, No Agents Required
Install in minutes with no agents to impact performance.
1 note
·
View note
Text
SQL Statistics Aggregator
Stop combing through hard to read Set Statistics IO and Set Statistics Time performance information to troubleshoot your queries. We make comparing runs over time easy and quickly so you can spend your valuable time fixing SQL Server performance issues and less time and energy parsing lines of command results to discover how your query changes impact IO pattern.
Easily Aggregate Statistics IO Data
Group and aggregate Set Statistics IO data by either table or statement. Correlate IO activity with query plan nodes. Compare statistics over multiple runs of a query to aid in tuning and troubleshooting.
Import & Export Statistics Data
Import or paste in statistic and query plan data for analysis, or run the query directly from the tool. Export statistics and save tuning sessions to simplify sharing your work with others.
Elegant Design & Ease of Use
Download and install in a few minutes. Clean, simple UI allows you to get up and running on a new tuning session in seconds.
Integrate with SSMS
SQL Statistics Aggregator is designed to launch directly within SQL Server Management Studio for optimal usability and efficient workflow.
Use Cases
Use this tool for a variety of performance tuning purposes including:
Identifying which statement in a batch is consuming the most overall IO
Spotting tables which are creating IO hot spots in your queries
Comparing IO to isolate problem operations
Viewing changes to the IO patterns
2 notes
·
View notes
Text
IDERA ER/Studio Enterprise Team Edition
Document and enhance data and metadata for enterprise architectures
Implement naming standards and a data dictionary to improve consistency
Share and collaborate on global business glossary terms and definitions
Effectively communicate data models and metadata across the enterprise
Build a foundation for data governance and compliance programs
Document Data and Metadata
With ER/Studio Data Architect’s extensive data modeling and metadata capabilities, you can document critical data elements, business data objects, and regulatory data elements and show their sources, interactions, and dependencies, in logical and physical data models.
Assign a naming standards template to your model, submodel, entities, and attributes, and ER/Studio Enterprise Team Edition will automatically apply those naming standards between the logical and physical models, ensuring consistency between models. You can also integrate model elements into reusable constructs via a built-in enterprise data dictionary.
1 note
·
View note
Text
IDERA Releases SQL Secure and SQL Doctor Cloud Updates

HOUSTON–(BUSINESS WIRE)–IDERA, a leading provider of database lifecycle management solutions, today released major updates to its flagship SQL Secure and SQL Doctorproducts to include new cloud capabilities. These releases allow data professionals to adapt to, experiment with and take advantage of expanding cloud strategies, and helps DBAs embrace the speed and agility demands of DevOps with database performance and security recommendations designed for the public cloud.
With the latest versions of SQL Secure and SQL Doctor, database administrators (DBAs) can now see on-premise and public cloud-based databases in a single-pane console. They also receive cloud-specific recommendations to improve the performance, health and security of public cloud databases to ensure they are just as secure as those on-premise. Both SQL Secure and SQL Doctor target SQL Server on-premise and in Azure VM as well as Azure SQL Database. SQL Doctor also targets SQL Server in Amazon EC2 and Amazon RDS SQL Server.
“The continued growth in hybrid cloud environments increases the likelihood of data breaches, which is one of the tradeoffs for realizing the benefits of the public cloud,” said Robert Anderson, vice president of product management at IDERA. “It’s imperative that organizations have policies and tools in place that can detect when sensitive data is at risk. IDERA gives users the confidence to move databases to the cloud by connecting the dots between traditional DBA operations and modern DevOps teams, while helping them improve the performance and security of cloud databases with tools they know and trust.”
While other products provide basic performance and availability monitoring of cloud databases, SQL Doctor now inspects cloud and on-premises databases for common health concerns, providing detailed recommendations and script actions to resolve problems and optimize performance. SQL Doctor also directly manages cloud database as a service (that is, Amazon RDS SQL Server and Azure SQL Database), resulting in superior visibility and performance.
The latest version of SQL Secure now extends product functionality from on-premises databases to databases in the cloud, giving DBAs a comprehensive, automated solution for analyzing, monitoring and reporting on security concerns for SQL Server and Azure SQL Databases. SQL Secure verifies on-premises and cloud databases against security best practices from a single console, allowing companies to move workloads to the cloud without fear of a debilitating security breach.
For more information on IDERA SQL Secure and SQL Doctor, visit https://www.idera.com.
About IDERA
IDERA designs powerful software with one goal in mind – to solve customers’ most complex challenges with elegant solutions. We don’t abide by the belief that a professional must sacrifice powerful features and quality for fast time to value and ease of use. With IDERA, you really can have it all. Our unique DNA is reinforced by a user community of nearly 100,000 database and IT professionals who use and evangelize our tools. From our award-winning SQL Server database solutions to multi-platform database, application and cloud monitoring tools, IDERA ensures your business never slows down. Contact us at +1-713-523-4433 or visit www.idera.com for free trials, free tools and more.
2 notes
·
View notes
Text
SQL Diagnostic Manager Enterprise view of all your SQL Servers
One of the challenges when managing SQL Server is that you probably have several instances that need to be monitored. Just connecting to each instance and going through the same motions over and over again is time consuming. So having a global view of your environment is a major time saver and with SQL Diagnostic Manager you have a couple of global views to see your entire SQL Server enterprise all at once.
The first screen is the SQLdm Today screen as shown below. This screen gives you a status summary for all of your servers, so you can drilldown into each server to address any issues. In the image below, on the left side we have a summary listing of our servers and whether they have issues that need to be addressed. On the right side we can see a list of alerts that need to be addressed for all of our servers. This is a quick way to get a To Do list of items that need to be addressed for all SQL Server instances instead of having to check instance by instance.
1 note
·
View note
Text
SQL Diagnostic Manager Pro
The most comprehensive SQL Server monitoring
tool is better than ever, now featuring:
Performance monitoring for physical and virtual environments
Transactional application monitoring with drilldown transaction analysis
Integrated expert recommendations
Predictive alerting with settings to avoid false alerts
Tempdb monitoring to resolve tempdb contention and performance issues
Web-based dashboard with at-a-glance views of top issues and alerts
1 note
·
View note
Text
Samsung buys Harman
Samsung buys Harman for £6.4bn in firm’s biggest acquisition to date.
All-cash deal will see firm take on Apple and Google in the automotive race.
SAMSUNG HAS ANNOUNCED plans to buy in-car entertainment firm Harman for $8bn (around £6.4bn), marking the firm’s biggest acquisition to date. The all-cash deal will give Samsung a major position in the hotly contested automotive space almost overnight, and the company was keen to tout Harman’s long-standing relationship with almost all major car manufacturers.Samsung Electronics CEO Oh-Hyun Kwon said: “As a Tier 1 automotive supplier with deep customer relationships, strong brands, leading technology and a recognised portfolio of best-in-class products, Harman immediately establishes a strong foundation for Samsung to grow our automotive platform."Samsung elaborated on this by saying that it could work with Harman on several areas of connected car technology, covering infotainment, cyber security, over-the-air updates and telematics.Young Sohn, president and chief strategy officer of Samsung Electronics, explained that the deal is the perfect fit for both firms.
1 note
·
View note
Text
The New Razer Blade PRO
Unlike Apple Pro-ish Mac, this one is for people under ‘pro’ tag.
You’d never imagine that all this power can be packed into a 0.88” thin CNC aluminum unibody chassis, but we’ve done just that. The result is a machine that is both refined and relentless.Cutting Edge Thermal DesignPushing the boundaries of performance in a thin form factor design requires a super-efficient thermal management solution to keep the heat at bay. To survive the heat of the most graphically intense battles, the Razer Blade Pro utilizes an innovative custom cooling design. Dynamic heat exchange coupled with bleeding edge vapor chamber technology spreads heat out quickly, evenly and efficiently. To avoid “hot spots” an internal fan facilitates air movement within the chassis to deliver a cool and comfortable experience, whether you’re gaming on ultra-settings in 4K or rendering high resolution 3D animations.
Desktop DNAExperience a true mobile battlestation with the Razer Blade Pro’s desktop inspired design. Armed with a mechanical keyboard, spacious glass trackpad, and even a scroll wheel to compliment, it’s the layout that any user is familiar with and what augments the desktop experience on the Razer Blade Pro.More Ports. More Possibilities.
Connect your devices, peripherals or accessories with more ports than ever before.
1 note
·
View note
Text
Attach SQL database = access denied
More of a reminder for myself, as this has happened multiple times. If you try to attach to a database and you get an ‘access denied’ error, be sure to run SSMS as an Administrator. Some posts will also mention that the SQL Server service account needs Modify access to the file/folder. But the former 'fix’ did the trick this time.
20 notes
·
View notes
Text
APPROVAL PROCESS IN SALESFORCE CRM
Approval Process in Salesforce Crm
Approval Process in Salesforce Crm:- In previous salesforce tutorial we learned about Workflow rules and workflow actions. In this crm salesforce training tutorials we are going to know about the Approval Process in Salesforce crm .
Approval Process in Salesforce crm is an automated mechanism that we can set up to process the approval of records with in organization. Approval process enables to…
2 notes
·
View notes