
capitalessence
Capital Essence
The holy grail of stock picking since the advent of trading
596 posts
Don't wanna be here? Send us removal request.
Last Seen Blogs

ki-vikki-dougan
Kï-Vikki Dougan

tojis-worm
toji please return my calls

myra-maines
Myra-Maines

wade-news
News

tumbler-and-tipsy
Tumbler and Tipsy
By Michael Kuluva S/S 2020 NYFW
Photo

S&P Vulnerable to further Downside Retracement - we remain near term neutral/negative for S&P as we believe market vulnerable to some downside retracement. S&P has 2433-2428 to trade against. If that were to break, we would see 2400 next
0 notes
Photo

Oil was under selling pressure Tuesday amid rising output from Nigeria and Libya, two OPEC members currently exempt from cutting supply. U.S. crude for July delivery fell 2.19 percent to settle at $43.23 a barrel, retreating to bear market territory defined as a drop of at least 20% from a recent peak. The SPDR S&P Oil & Gas Exploration & Production ETF (XOP) fell more than 24 percent year-to-date. According to our “U.S. Market Trading Map”, there could be more gains ahead for the ETF
0 notes
Photo

Weight Watchers International Inc. (WTW) broke out above the multi-year sideways trading range this week, up more than 7 percent. This is bullish from a technical perspective. In fact, a closer look at the daily chart of WTW suggests that the stock could climb above 45 in the coming days. Just so that you know, initially profiled in our April 7, 2017 “Swing Trader Bulletin” WTW had gained about 94% and remained well position
0 notes


Photo
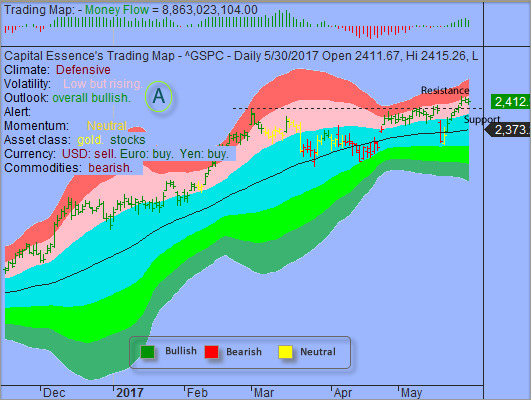
S&P in Short-term Consolidation Phase - we wouldn’t look too much into Tuesday’s trading action because it keeps the S&P within its short-term consolidation phase. Support is strong in the 2400 area and downside momentum does not appear strong enough to generate a decisive breakdown. As for strategy, traders should consider buying into market dips.
0 notes
Photo
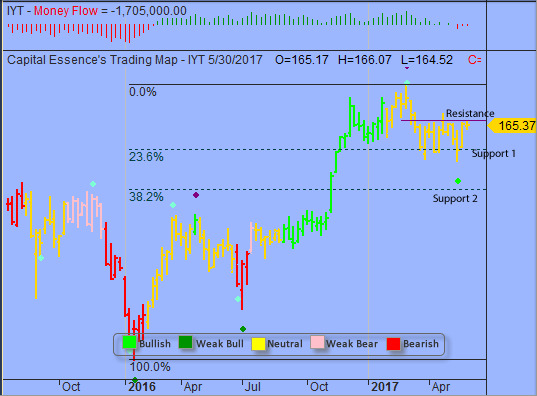
After the post-Brexit rally that saw the Transports gained 37% to its March 1 highs, the sector found itself in a secondary downtrend of lower highs and lower lows. The question is whether this is a pause that refresh or a beginning of a deep correction. According to our “U.S. Market Trading Map”, there could be more pains ahead for the iShares Transportation Average ETF (IYT).
0 notes
Photo

Greif Inc. (GEF) was a notable winner Tuesday, rose 1.72 percent to 59.72. This is bullish from a technical perspective. In fact, a closer look at the daily chart of GEF suggests that the stock could climb above 70 in the coming days. Just so that you know, initially profiled in our October 26, 2016 “Swing Trader Bulletin” GEF had gained about 27% and remained well position
0 notes
Photo
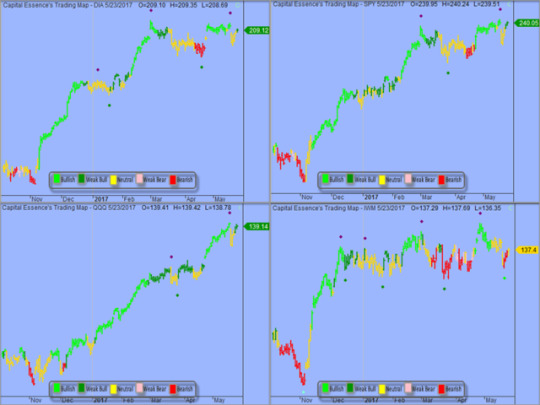
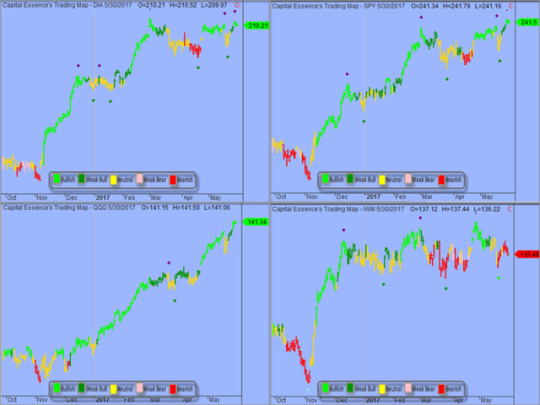
SPDRs Sector Report for Wednesday May 24, 2017 - Daily trend: DIA, SPY and QQQ are in dark-green (weak buy). IWM is in yellow (neutral)
0 notes
Photo

currently rally is testing resistance at the important sentiment 2400 mark on the S&P. This resistance zone is too big and too important to fall quickly, traders should not be surprised to see some backing and fillings over the next few days
0 notes
Photo
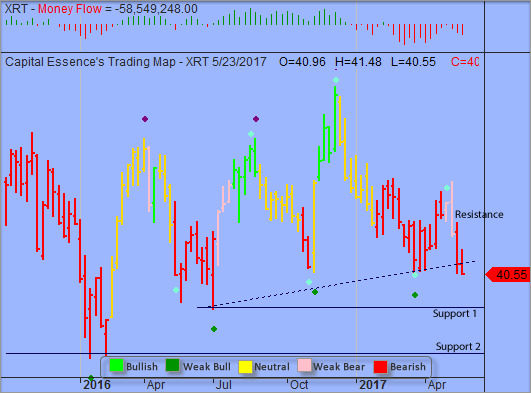
Our “U.S. Market Trading Map” painted Spdr S&P Retail ETF (XRT) bars in red (strong sell). Tuesday’s breakdown pushed the ETF below the summer 2016 rising trend line, signified a bearish breakout. Money Flow measure held below the zero line since early 2017, indicating a negative net demand. These elements increased the probability for a retest of the summer 2016 low near 39
0 notes
Photo

Intuit Inc. (INTU) was a notable winner Tuesday, jumped 1.56 percent to 129.15 – a fresh 52-week high. This is bullish from a technical perspective. In fact, a closer look at the daily chart of INTU suggests that the stock could climb above 140 in the coming days. Just so that you know, initially profiled in our June 13, 2016 “Swing Trader Bulletin” INTU had gained about 22% and remained well position
0 notes
Photo

Pullback Will Set the Stage for Buyers to Come Back In - Wednesday massive decline marked a beginning of the long overdue correction. Although seemingly vulnerable to further short-term weakness the overall technical backdrop remains positive so the pullback will set the stage for buyers to come back in and send the index to new highs
0 notes
Photo
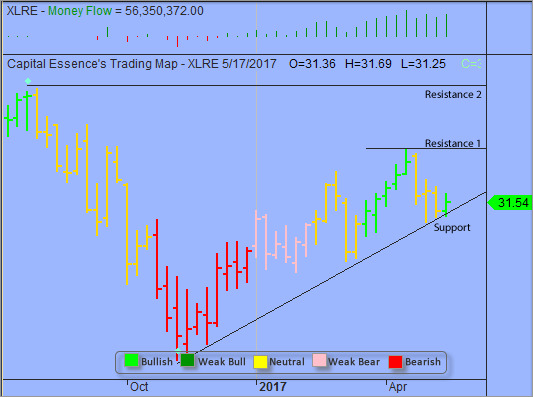
Since peaking in late April, the Real Estate Select Sector SPDR ETF (XLRE) has been trending lower as the sector digested the massive spring rally. This week’s outperformance suggested that an important near-term low has been established and the ETF could be in an early stage of a new upswing. Our “U.S. Market Trading Map” painted XLRE bar in bright green (strong buy)
0 notes
Photo
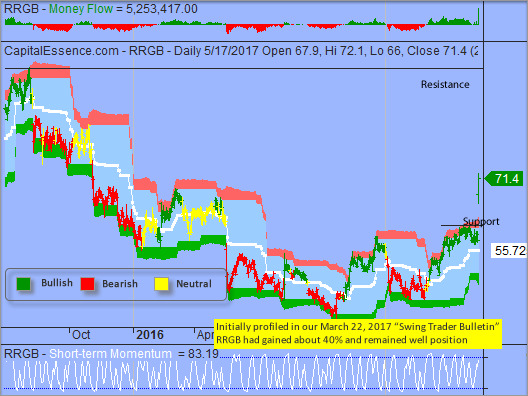
Red Robin Gourmet Burgers Inc. (RRGB) was a notable winner Wednesday, soared 23.10 percent to 71.40 – a fresh 52-week high after the casual restaurant chain reported earnings that came in well ahead of analysts’ forecasts. This is bullish from a technical perspective. In fact, a closer look at the daily chart of RRGB suggests that the stock could climb up to 95 in the coming days. Just so that you know, initially profiled in our March 22, 2017 “Swing Trader Bulletin” RRGB had gained about 40% and remained well position
0 notes
Photo

Traders Should Consider Taking some Money Off the Table - while the market could continue to drift higher in the near term as trading sentiment remains strong, our work on price structure and momentum suggested strongly that risk is greater to the downside in the medium term. As for strategy, traders should consider taking some money off the table
0 notes
Photo

Since peaking in early March, the SPDR S&P Bank ETF (KBE) has slowly been carving out a large triangle pattern as traders wondered whether more gain is warranted given the massive post-election rally. According to our “U.S. Market Trading Map”, there could be more pains ahead for the ETF. Our “U.S. Market Trading Map” painted KBE bars in red (strong sell) since last week
0 notes
Photo

Cavium Inc. (CAVM) was a notable winner Tuesday, jumped 4.14 percent to 75.48 – a fresh 52-week high. This is bullish from a technical perspective. In fact, a closer look at the daily chart of CAVM suggests that the stock could climb above 84 in the coming days. Just so that you know, initially profiled in our January 9, 2017 “Swing Trader Bulletin” CAVM had gained about 24% and remained well position
0 notes