#E) Based on end-use industries segmentation
Text
A totally different kind of calculator
My latest purchase for The Collection, a Calculated Industries ConversionCalc Plus, was mainly to further diversify my collection, as I now want to get calculators from as many distinct manufacturers as possible. As the name suggests, it's a calculator that is entirely dedicated to the task of converting between different measurements.

I picked the conversion calculator because it is by far the least specialised of all of CI's calculators and just about the only one I could imagine being actually useful to me.
After getting it, it's one of my favourite calculators ever and it goes on my desk rather than on the drawers with most of the calculator collection. I use it whenever I have unit conversions to do because it's so much more convenient than opening a new tab and typing conversions into Google, especially because Google converts to feet with a decimal point by default, instead of feet and inches:

Look Google! It's how people expect feet measurements to be formatted!
Most unit conversions are two button presses away because there's no need to type out their names or dig through menus, everything's at the base or shifted layers of the keypad. I would never use my other calculators for this purpose because they don't prioritise it enough to be faster than Google. It's faster to type "1435 mm to ft" into Google than find the conversions menu in my fx-9750Gii and use submenus every time to slowly type out "[mm] -> [ft]":

After all that effort, it still won't present it in feet and inches!
It of course works as a normal calculator, but has some odd limitations, such as lacking cubes and cube roots. Squares and square roots are elegantly integrated into the unit conversion system. Squaring a metre value will turn it into square metres, and taking the square root of an area will show you the side length of a square with that area, automatically changing from square measurements to linear ones. But none of this can happen with the cubic measurements. Oh well.
Unfortunately, this calculator doesn't support the UK imperial system. All imperial units are the US versions. This is not a huge problem for me as the vast majority of the time I use this calculator will be for communication with Americans.
Converting between units never loses precision. If you convert a number into a new unit, all of the digits of the original unit are retained no matter how many conversions you do afterward. This even applies to entering fractional amounts of inches, which has a special "/" (that is, not the usual divide symbol) button on the calculator. Fractions automatically get converted into a fraction with a power of 2 denominator, but when shown as a decimal value, are clearly still their original value rather than rounded. This is really impressive.
Another great part of the calculator's interface is the unusual number of edge cases built in to display as many digits as possible at all times. If needed, the calculator repurposes its scientific notation/fraction digits into a bonus pair of digits after the decimal place:

I thought this was a bug when I first saw it!
It also has a fourteen-segment display to the left of the main seven-segment display, the first calculator in my collection to feature one. This is used for some of the measurements that don't have dedicated segments in the LCD. But it can also display the minus sign, so MILE ends up dropping the E in sufficiently long negative numbers:

Notice here that it's also using the uppermost segment of the last digit as a minus sign for the scientific notation digits. This seems to suggest that these are not intended to show scientific notation and were originally designed to display inches with fractions, and were then repurposed for scientific notation:

In general, the interface shows an incredibly creative approach to using the LCD panel that I've never seen on any other calculator. Looking through CI's range, some of their other calculators seem to feature a similar or possibly identical display, which suggests it's a standard one that they reuse for all of their calculators.
My collection is now at 19 calculators and I have every major type of calculator:
Standard
Financial
Programmer
Scientific
Graphing
I would consider this another category from all of those, the "unit converter" calculator type. Just as scientific calculators often include programmer functionality in their BASE-N modes, this is definitely not something that this calculator is uniquely capable of, but it is something it's uniquely capable in. It is to unit conversion what my DM16L is to BASE-N arithmetic and logic.
Having a totally new kind of calculator is rare and exciting with a collection my size, which is why I've found the CI converter calculator so much more interesting than my other recent additions, which have been scientific and graphing calculators.
It ticks boxes for my calculator collecting, is genuinely useful to me and has a very unusual set of capabilities and user interface. Love it when that happens!
Calculated Industries website
3 notes
·
View notes
Text
Drone Package Delivery Market Are Estimated To Increase During Period 2029 USD 31,188.7 Million At Exhibiting a CAGR of 53.94%
The global drone package delivery market size is projected to reach USD 7,388.2 million by 2028, exhibiting a CAGR of 41.8% during the forecast period. Widespread deployment of drones to deliver medical and food supplies amid the COVID-19 pandemic is expected to aid the market make substantial gains, observes Fortune Business Insights™ in its report, titled “Drone Package Delivery Market Size, Share & Industry Analysis, By Type (Fixed Wing and Rotary Wing), By Package Size (Less Than 2 Kg, 2-5 Kg, and above 5 Kg), By End Use (Restaurant & Food Supply, E-commerce, Healthcare, Retail Logistics & Transportation and others), and Regional Forecast, 2020-2028”.
Get Sample PDF Brochure:
The report states that the market value stood at USD 642.4 million in 2019 and shares the following information:
Comprehensive depiction of the industry outlook and trends;
Detailed insights into the upcoming opportunities in the market;
Tangible analysis of the market drivers, restrains, and all possible segments; and
In-depth assessment of the regional and competitive dynamics impacting the market.
Driving Factor
Emergence of Drone Startups in Logistics to Augment Market Potential
The growing demand for enhancing the efficiency of logistics operations has triggered a sudden emergence of startups specializing in drone technologies to cater to these needs. For example, DroneScan, a South Africa-based startup, designs drones that transmits live data of scanned items in warehouses, making inventory management more efficient and upping the productivity quotient of workers. An Italy-based startup, Archon, provides autonomous robotic drone services to facilitate supervised as well as unsupervised inspection of warehousing and logistics operations. The drone startup culture is gathering momentum in developing countries as well. For example, in India, several startups have spawned in the past few years that are providing next-gen drone services. Aarav Unmanned Systems, for instance, was started in 2013 and is India’s first drone company to develop drone solutions for commercial applications in the public and private sectors. These developments are expected to power the drone package delivery market growth in the forthcoming years.
Regional Insights
North America to Top Other Regions Backed by Rising Preference for Drone Deliveries by Shoppers
North America is set to dominate the drone package delivery market share during the forecast period owing to the increasing inclination of online shoppers towards delivery of goods through unmanned aerial vehicles (UAVs). With a market size of USD 237.7 million in 2019, the region is likely to retain its leading position, which will be supported by the strong financial support to drone startups in the US and Canada.
In Europe, the market is anticipated to be driven by the growing presence of tech companies that are expanding their operations in the region through collaborations and partnerships. Asia Pacific is expected to create exciting opportunities for market players on account of the emerging trend of online purchasing of groceries in the large cities of India, China, and Indonesia.
Competitive Landscape
Supportive Regulations to Novel Ideas to Feed Competitive Ardor of Key Players
With the scope for innovation widening, key players in the market drone package deliveries are engaged in coming up with novel drone solutions, especially during the current coronavirus crisis. Supporting their efforts are regulatory bodies that are easing flying norms and rules to ensure timely delivery of essential supplies to people.
List of Key Companies Profiled in the Drone Package Delivery Market Report:
DroneScan (South Africa)
Cheetah Logistics Technology (US)
Flytrex (Israel)
Flirtey (US)
Matternet, Inc. (US)
Boeing (US)
Amazon Inc. (US)
Wing Aviation LLC (US)
Workhorse Group Inc. (US)
Drone Delivery Canada Corp. (Canada)
Zipline (US)
DHL International GmbH (Germany)
United Parcel Service of America, Inc. (US)
FedEx (US)
Industry Developments:
August 2020: Amazon secured clearance from the Federal Aviation Administration (FAA) to deploy its Prime Air delivery drone fleet to efficiently and securely deliver packages to customers. Amazon is now the third company to receive FAA approval to operate drones on a commercial scale after UPS and the Alphabet-owned company, Wing.
May 2020: Wing, a subsidiary of Google’s parent company Alphabet, announced that it has made thousands of drone deliveries in Australia during the pandemic. Launched in Canberra in 2019, the demand for Wing’s services rose by 500% between February and April 2020.
2 notes
·
View notes
Text
Transparent Display Market - Forecast (2022 - 2027)
Transparent Displays Market size is forecast to reach $7.9 billion by 2026, at a CAGR of 44.9% during 2021-2026. Growing demand for liquid crystal display based transparent displays for various verticals, increasing usage of transparent display for Head-Mounted Display (HMDs), and Head-Mounted Display products is analyzed to enhance the Transparent Display market share. In addition high growth for OLED based transparent display devices and high adoption of transparent display for digital signage products are expected to create significant growth opportunities for players in the market during the forecast period. In 2020, JDI developed transparent display with 87% high transparency, which is nearly the same as looking through a clear glass when the display is turned off. In 2020, Panasonic has released commercial 55-inch transparent self-illuminating transparent OLED display panel that does not require a backlight. Hence these developments are analyzed to drive the Transparent Display industry in the forecast period 2021-2026.

Report Coverage
The report: “Transparent Displays Market Report– Forecast (2021-2026)”,by IndustryARC covers an in-depth analysis of the following segments of the Transparent Display market
By Type: LCD, OLED, E-Paper, Others
By Product: HMD, HUD, Digital Signage, Smart Appliance
By Display Size: Small, Medium, and Large
By Resolution: HD, Full HD, UHD, Others
By End User: Industrial, Retail and hospitality, Automotive, Aerospace and defense, Transportation, Healthcare, Sports and entertainment, others.
By Geography: North America (U.S, Canada, Mexico), South America(Brazil, Argentina and others), Europe(Germany, UK, France, Italy, Spain, Russia and Others), APAC(China, Japan India, SK, Aus and Others), and RoW (Middle East and Africa)
Request Sample
Key Takeaways
Transparent Display market in APAC region held a significant market share of 39.2% in 2020, due to the increase in demand for transparent displays in various end users, such as automotive, Electronics, healthcare.
OLED segment has held significant share of 38% in 2020, rise in demand for OLED display technology due to advantages such as improved image quality, better contrast, higher brightness and much faster refresh rates with lower power consumption as compared to liquid crystal display technology is analyzed to drive the market growth.
High adoption of transparent display for digital signage products is analysed to drive the market growth.
Healthcare sector in Transparent Display Market is expected to witness a highest CAGR of 45.8% the forecast period. Increasing technological advancements in the healthcare industry is paving the way for the use of transparent displays in applications, such as surgery and patient check-up.
Transparent Display Market Segment Analysis - By Type
OLED segment has held significant share of 38.2% in 2020, rise in demand for OLED display technology due to advantages such as improved image quality, better contrast, higher brightness and much faster refresh rates with lower power consumption as compared to liquid crystal display technology is analysed to drive the market growth. Transparent OLED maximizes the advantages of OLED and can be used in various places from stores to autonomous vehicles. Moreover several companies have been launching advanced transparent OLED displays to gain the market traction. In 2021, LG Display has announced its plans to launch its transparent OLED screen. In 2020, Panasonic has released commercial 55-inch transparent self-illuminating transparent OLED display panel that does not require a backlight Hence, OLED display technology expected to provide ample opportunities for the transparent display market during the forecast period 2021-2026.
Inquiry Before Buying
Transparent Display Market Segment Analysis - By End User
Healthcare sector in Transparent Display Market is expected to witness a highest CAGR of 45.8% in the forecast period. Increasing technological advancements in the healthcare industry is paving the way for the use of transparent displays in applications, such as surgery and patient checkup. Transparent displays are being deployed to assist surgeons during critical operations. In addition, the healthcare industry is exhibiting a substantial growth Y-o-Y, moreover several companies and research institutes are developing these displays for various applications. In 2021, Industrial Technology Research Institute (ITRI) has developed a transparent display surgical navigation system that can reduce the risk of surgery. This system provides high accuracy direct view type virtual-real fusion image information to meet the needs of preoperative communication and intraoperative navigation. In addition this can also be used in medical teaching and smart surgery in the future. Similarly, Companies such as LG, Planar and other are providing digital signage and display technology for the healthcare industry ranges across applications in hospitals and medical offices abound. Hence these global trends are analyzed to create demand for Transparent Display industry in the forecast period 2021-2026.
Transparent Display Market Segment Analysis - By Geography
Transparent Display market in APAC region held significant market share of 39.2% in 2020, due to the increase in demand for transparent displays in various end users, such as automotive, Electronics, healthcare and so on is driving the market growth. In addition, high demand for transparent display panels in South Korea, China, and Japan is a major contributor to the growth of the market. The presence of display panel manufacturers gives it a prime benefit of adopting the latest technology-based display devices, which provides ample opportunities to the transparent display market. In 2019, LG Electronics Inc. completed the construction of its new transparent OLED screen production plant in China. This would extensively increase the production of transparent OLED screens, in display sizes of 55 inches and above, by 60,000 units per month. In 2020, Chinese electronics company Xiaomi has launched Mi TV LUX an edge-to-edge transparent display. Hence these factors are analyzed to drive the transparent display industry outlook.
Schedule a Call
Transparent Display Market Drivers
Growing number of product launches with advancements is analyzed to drive the market.
Transparent displays are expected to change the way of using displays as this technology helps in displaying or transferring information. Many companies are investing in huge amount in R&D activities of transparent display technology. For instance, Samsung to launch a new triple foldable tablet and a transparent display phone in 2021. Similarly in 2021, Crystal Display Systems are planning to introduce the curved transparent liquid crystal display for retail displays that really give that unique edge that stand out from the usual displays. Japanese scientists invented intelligent glasses that remembers the place where people saw their keys, mobiles, and other things for the last time. Moreover, emergence of virtual reality devices compatible with smartphones supplements growth of this market. Furthermore, increasing awareness and adoption of advanced technologies are the factors that drive transparent display market share in the forecast period 2021-2026.
Miniaturization of Electronic Devices Drives the Need and Development of Transparent Display Technologies
These days, advanced technologies are growing faster where in each technology is renewed with implementation of new one. The transparent display came to solve major problems related to the device miniaturization. This lack of space on screen-based displays provide an opportunity for the development of transparent displays. The growth in transparent display market can be attributed to presence of major manufacturers and increasing R&D investments towards technology and product development by research universities and major manufacturers. In 2019, Samsung has announced to invest $11 Billion into Next-Generation Displays. Similarly LG has committed to invest heavily for the development of this technology. Hence these investments are analyzed to provide opportunities for the Transparent Display market in the forecast period 2021-2026.
Transparent Display Market Challenges
High Capital Investment Required for the Development of Transparent Displays
Although Transparent Display market is analyzed to grow at a significant rate, the high initial investments required for the R&D of this technology is set to hamper the growth of the market. The competitive display technology segment, new functionalities will increase the cost of development of the products related to this technology. On the other hand most of the technologies required for the outward of transparent display are in development stage only. The high initial investments and slow development process will hinder the Transparent Display market size in the forecast period.
Buy Now
Transparent Display Market Landscape
Product launches, acquisitions, Partnerships and R&D activities are key strategies adopted by players in the Transparent Display market. Transparent Display top 10 companies include Apple, Inc., AU Optronics Corp., Google, Inc., LG Electronics, Samsung Electronics, UDC Corp., Panasonic Corp., Sony Corp, Pioneer and Philips Corp. among others.
Acquisitions/Product Launches
In 2020, Panasonic has released 55-inch transparent OLED display module. The new Panasonic product uses a self-illuminating transparent OLED display panel that does not require a backlight.
In 2020, LG has partnered with Assa Abloy to supply transparent OLED automatic doors.
For more Electronics related reports, please click here
#Transparent Display Market#Transparent Display Market Size#Transparent Display Industry#Transparent Display Market Share#Transparent Display Market Report#Transparent Display Industry Outlook#Transparent Display#Display
2 notes
·
View notes
Text
Water-based Personal Lubricant Market to Witness Excellent Revenue Growth Owing to Rapid Increase in Demand
Latest added Water-based Personal Lubricant Market research study by AMA Research offers detailed outlook and elaborates market review till 2030. The market Study is segmented by key regions that are accelerating the marketization. At present, the market players are strategizing and overcoming challenges of current scenario; some of the key players in the study are Church & Dwight (United States), Reckitt Benckiser Group plc (United Kingdom), Ansell (Australia), Blossom Organics (United States), Bodywise (United States), Clean stream (United States), Cumming Corporation (United States), Good Clean Love (United States), Hathor Professional Skincare (Canada), HLL Lifecare (India), Live Well Brands (United States), Lovehoney Group (United Kingdom), Sensuous Beauty (United States), Sliquid (United States), LifeStyles HealthCare Pte Ltd. (United States) etc.
Get Free Exclusive PDF Sample Copy of This Research @ https://www.advancemarketanalytics.com/sample-report/62915-global-water-based-personal-lubricant-market
The water-based Personal Lubricant market is expected to grow n the future due to an increase in the customer acceptance of sexual wellness products. The change is due to the increased exposure toward the internet, TV shows, and erotic fiction, growing awareness of sexual wellness products among women. The flourishing of the E-commerce industry will boost the Water-based personal lubricant market.
Influencing Trend:
Flourishing E-commerce IndustryRise in the Availability of a Wide Range of Products
Challenges:
Substitute available and government regulations
Opportunities:
Continuous Advancements in the New Product Development
Introduction of Premium Products by Manufacturers
Market Growth Drivers:
Increasing the demand for personal lubricants. Rising Demand for these Products for Reducing Vaginal Dryness and Erectile Dysfunction
Have Any Questions Regarding Global Water-based Personal Lubricant Market Report, Ask Our Experts@ https://www.advancemarketanalytics.com/enquiry-before-buy/62915-global-water-based-personal-lubricant-market The Global Water-based Personal Lubricant segments and Market Data Break Down by Type (Men's Water-based Personal Lubricant, Women's Water-based Personal Lubricant, Unisex Water-based Personal Lubricant), Application (Sexual life, Other), Nature (Organic, Non-organic), Distribution Channel (Online, Offline), End User (Male, Female)), End User (Men, Women, Unisex)
Contact US:
Craig Francis (PR & Marketing Manager)
AMA Research & Media LLP
Unit No. 429, Parsonage Road Edison, NJ
New Jersey USA – 08837
Phone: +1 (201) 565 3262, +44 (161) 818 8166
[email protected]
Connect with us at
https://www.linkedin.com/company/advance-market-analytics
https://www.facebook.com/AMA-Research-Media-LLP-344722399585916
https://twitter.com/amareport
0 notes
Text
How Delivery Controllers are Revolutionizing Supply Chains: Market Analysis and Trends
The Delivery Controller Market Report delves into the dynamic landscape of delivery logistics, providing a comprehensive overview of its current state and future prospects. With the global surge in e-commerce and the increasing demand for efficient supply chain management, delivery controllers have emerged as pivotal tools for optimizing delivery operations. This report encapsulates key market trends, including the growing integration of AI and IoT technologies, the rise of autonomous delivery solutions, and the emphasis on sustainability in logistics practices. It also highlights the competitive landscape, major players, and critical challenges faced by stakeholders, offering insights to navigate the evolving terrain of delivery control systems effectively.
The report outlines the transformative role of delivery controllers in revolutionizing supply chains and meeting the demands of modern consumers. It underscores the importance of technological innovations and strategic adaptation to capitalize on emerging opportunities and address industry challenges effectively.
𝐂𝐥𝐢𝐜𝐤 𝐇𝐞𝐫𝐞, 𝐓𝐨 𝐆𝐞𝐭 𝐅𝐫𝐞𝐞 𝐒𝐚𝐦𝐩𝐥𝐞 𝐑𝐞𝐩𝐨𝐫𝐭
Market Segmentations:
Global Delivery Controller Market:
ByCompany
F5 Networks
Fortinet
Array
Citrix Systems
Brocade Communications Systems
KEMP Technologies
Sangfor Technologies
NGINX
Radware
Hewlett-Packard
Global Delivery Controller Market:
ByType
Software
Hardware
Global Delivery Controller Market:
ByApplication
Retail
IT & Telecom
Banking and Financial Services
Healthcare
Government
Others
Global Delivery Controller Market:
RegionalAnalysis
The regional analysis of the global Delivery Controller market provides insights into the market's performance across different regions of the world. The analysis is based on recent and future trends and includes market forecast for the prediction period. The countries covered in the regional analysis of the Delivery Controller market report are as follows:
North America: The North America region includes the U.S., Canada, and Mexico. The U.S. is the largest market for Delivery Controller in this region, followed by Canada and Mexico. The market growth in this region is primarily driven by the presence of key market players and the increasing demand for the product.
Europe: The Europe region includes Germany, France, U.K., Russia, Italy, Spain, Turkey, Netherlands, Switzerland, Belgium, and Rest of Europe. Germany is the largest market for Delivery Controller in this region, followed by the U.K. and France. The market growth in this region is driven by the increasing demand for the product in the automotive and aerospace sectors.
Asia-Pacific: The Asia-Pacific region includes Singapore, Malaysia, Australia, Thailand, Indonesia, Philippines, China, Japan, India, South Korea, and Rest of Asia-Pacific. China is the largest market for Delivery Controller in this region, followed by Japan and India. The market growth in this region is driven by the increasing adoption of the product in various end-use industries, such as automotive, aerospace, and construction.
Middle East and Africa: The Middle East and Africa region includes Saudi Arabia, U.A.E, South Africa, Egypt, Israel, and Rest of Middle East and Africa. The market growth in this region is driven by the increasing demand for the product in the aerospace and defense sectors.
South America: The South America region includes Argentina, Brazil, and Rest of South America. Brazil is the largest market for Delivery Controller in this region, followed by Argentina. The market growth in this region is primarily driven by the increasing demand for the product in the automotive sector.
𝐂𝐥𝐢𝐜𝐤 𝐇𝐞𝐫𝐞, 𝐓𝐨 𝐆𝐞𝐭 𝐅𝐫𝐞𝐞 𝐒𝐚𝐦𝐩𝐥𝐞 𝐑𝐞𝐩𝐨𝐫𝐭
Key Questions Answered in This Report:
What is the current market size of the delivery controller industry, and what are the projected growth trends over the next five years?
Who are the major players in the delivery controller market, and what are their key strategies for market dominance and expansion?
What are the primary factors driving the demand for delivery controllers across various industries, such as e-commerce, retail, healthcare, and logistics?
How do hardware and software solutions differ in the delivery controller market, and what are the respective market shares and growth trajectories for each segment?
What are the emerging technologies and innovations influencing the development of delivery controllers, and how are these innovations reshaping the market landscape?
What are the key challenges faced by stakeholders in the delivery controller market, such as regulatory hurdles, cybersecurity concerns, or infrastructure limitations?
How are delivery controllers contributing to sustainability efforts within the logistics industry, and what are the trends in environmentally friendly delivery practices?
What are the regional trends and market dynamics driving the adoption of delivery controllers in different parts of the world, and how do these factors impact market growth?
What are the typical implementation challenges and best practices for integrating delivery controllers into existing supply chain management systems?
What future developments or disruptions are anticipated in the delivery controller market, and how can businesses prepare to leverage these changes for competitive advantage?
About Stringent Datalytics
Stringent Datalytics offers both custom and syndicated market research reports. Custom market research reports are tailored to a specific client's needs and requirements. These reports provide unique insights into a particular industry or market segment and can help businesses make informed decisions about their strategies and operations.
Syndicated market research reports, on the other hand, are pre-existing reports that are available for purchase by multiple clients. These reports are often produced on a regular basis, such as annually or quarterly, and cover a broad range of industries and market segments. Syndicated reports provide clients with insights into industry trends, market sizes, and competitive landscapes. By offering both custom and syndicated reports, Stringent Datalytics can provide clients with a range of market research solutions that can be customized to their specific needs.
Contact Us
Stringent Datalytics
Contact No- +1 346 666 6655
Email Id- [email protected]
Web- https://stringentdatalytics.com/
0 notes
Text
Luxury Ski Clothing Market: Report 2024-2032 | Reports and Insights

The Reports and Insights, a leading market research company, has recently releases report titled “Luxury Ski Clothing Market: Global Industry Trends, Share, Size, Growth, Opportunity and Forecast 2024-2032.” The study provides a detailed analysis of the industry, including the global Luxury Ski Clothing Market, size, and growth forecasts. The report also includes competitor and regional analysis and highlights the latest advancements in the market.
Report Highlights:
How big is the Luxury Ski Clothing Market?
The global luxury ski clothing market size reached US$ 1,589.8 million in 2023. Looking forward, Reports and Insights expects the market to reach US$ 2,731.9 million in 2032, exhibiting a growth rate (CAGR) of 6.2% during 2024-2032.
What are Luxury Ski Clothing?
Luxury ski clothing denotes premium-quality attire tailored for skiing and winter sports, distinguished by its top-tier materials, craftsmanship, and fashionable appeal. Crafted from cutting-edge technical fabrics, these garments offer exceptional warmth, breathability, and moisture control to ensure optimal performance in harsh weather conditions. Luxury skiwear often integrates innovative features like waterproof membranes, insulated linings, and customizable ventilation systems, providing superior protection while enabling unrestricted movement. Meticulously designed with stylish elements and trendy aesthetics, these outfits cater to affluent individuals seeking both functionality and luxury in their ski apparel.
Request for a sample copy with detail analysis: https://www.reportsandinsights.com/sample-request/1969
What are the growth prospects and trends in the Luxury Ski Clothing industry?
The luxury ski clothing market growth is driven by various factors. The luxury ski clothing market is witnessing significant growth, fueled by a rising demand among affluent consumers worldwide for high-quality and fashionable winter sports apparel. These premium garments, known for their superior craftsmanship and innovative technical features, cater to discerning skiers who seek both performance and luxury on the slopes. With an emphasis on advanced materials like waterproof membranes and insulated linings, luxury ski clothing provides optimal protection and comfort in harsh weather conditions, while also reflecting the latest fashion trends. As affluent individuals continue to prioritize both functionality and style in their ski attire, the luxury ski clothing market is set to expand further, driving innovation in the industry. Hence, all these factors contribute to luxury ski clothing market growth.
What is included in market segmentation?
The report has segmented the market into the following categories:
By Product Type:
Jackets
Pants
Suits
Base Layers
Gloves
Hats
Accessories
Material Type:
Gore-Tex
Down
Synthetic Insulation
Wool
Technical Fabrics
Gender:
Men
Women
Unisex
Distribution Channel:
Online Retail
Offline Retail
Specialty Stores
Department Stores
Sports Retailers
Price Range:
High-End Luxury
Mid-Range Luxury
End User:
Professional Skiers
Recreational Skiers
Winter Sports Enthusiasts
Sales Channel:
Direct Sales
Indirect Sales
Brand Type:
Established Luxury Brands
Emerging Luxury Brands
Customer Age Group:
Adults
Children
Design Style:
Classic
Contemporary
Sporty
Fashion-Forward
Product Features:
Waterproof
Breathable
Insulated
Windproof
Stretchable
Product Usage:
Alpine Skiing
Freestyle Skiing
Cross-Country Skiing
Consumer Buying Behavior:
Brand Consciousness
Performance Orientation
Style and Fashion Preference
Sustainability Initiatives:
Use of Recycled Materials
Eco-friendly Manufacturing Processes
Social Responsibility Programs
Sales Channel Analysis:
E-commerce Platforms
Specialty Luxury Retailers
Departmental Stores
Company-owned Stores
Third-party Distributors
Segmentation By Region:
North America:
United States
Canada
Europe:
Germany
United Kingdom
France
Italy
Spain
Russia
Poland
BENELUX
NORDIC
Rest of Europe
Asia Pacific:
China
Japan
India
South Korea
ASEAN
Australia & New Zealand
Rest of Asia Pacific
Latin America:
Brazil
Mexico
Argentina
Rest of Latin America
Middle East & Africa:
Saudi Arabia
South Africa
United Arab Emirates
Israel
Egypt
Rest of MEA
Who are the key players operating in the industry?
The report covers the major market players including:
Arc'teryx Inc.
Bogner GmbH & Co. KG
Kjus AG
The North Face, Inc.
Patagonia, Inc.
Canada Goose Holdings Inc.
Peak Performance AB
Helly Hansen AS
Moncler S.p.A.
Descente Ltd.
Obermeyer Skiwear, Inc.
Rossignol Group
Spyder Active Sports, Inc.
Salomon SAS
Mammut Sports Group AG
View Full Report: https://www.reportsandinsights.com/report/Luxury Ski Clothing-market
If you require any specific information that is not covered currently within the scope of the report, we will provide the same as a part of the customization.
About Us:
Reports and Insights consistently mееt international benchmarks in the market research industry and maintain a kееn focus on providing only the highest quality of reports and analysis outlooks across markets, industries, domains, sectors, and verticals. We have bееn catering to varying market nееds and do not compromise on quality and research efforts in our objective to deliver only the very best to our clients globally.
Our offerings include comprehensive market intelligence in the form of research reports, production cost reports, feasibility studies, and consulting services. Our team, which includes experienced researchers and analysts from various industries, is dedicated to providing high-quality data and insights to our clientele, ranging from small and medium businesses to Fortune 1000 corporations.
Contact Us:
Reports and Insights Business Research Pvt. Ltd.
1820 Avenue M, Brooklyn, NY, 11230, United States
Contact No: +1-(347)-748-1518
Email: [email protected]
Website: https://www.reportsandinsights.com/
Follow us on LinkedIn: https://www.linkedin.com/company/report-and-insights/
Follow us on twitter: https://twitter.com/ReportsandInsi1
0 notes
Text
Global Top 24 Companies Accounted for 49% of total Commercial and Household Water Purification Systems market (QYResearch, 2021)
Water Purification Systems are used to remove undesirable chemicals, biological contaminants, suspended solids and gases from water. The goal is to produce water fit for a specific purpose. In this report, we will mainly analyze commercial and residential water purification systems for providing clean and safe drinking or usable water.
According to the new market research report “Global Commercial and Household Water Purification Systems Market Report 2023-2029”, published by QYResearch, the global Commercial and Household Water Purification Systems market size is projected to reach USD 20.64 billion by 2029, at a CAGR of 6.2% during the forecast period.
Figure. Global Commercial and Household Water Purification Systems Market Size (US$ Million), 2018-2029
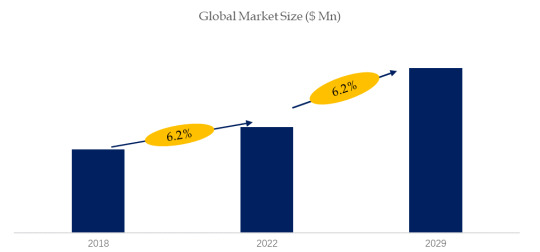
Figure. Global Commercial and Household Water Purification Systems Top 24 Players Ranking and Market Share (Ranking is based on the revenue of 2022, continually updated)
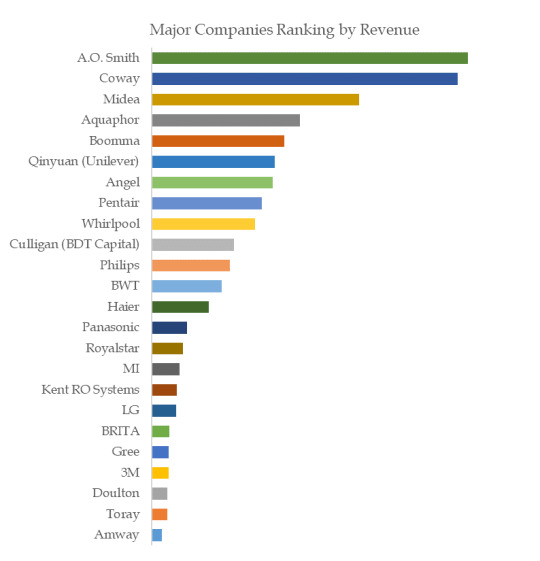
The global key manufacturers of Commercial and Household Water Purification Systems include A.O. Smith, Coway, Midea, Aquaphor, Boomma, Qinyuan (Unilever), Angel, Pentair, Whirlpool, Culligan (BDT Capital), etc. In 2021, the global top 10 players had a share approximately 49.0% in terms of revenue.
About QYResearch
QYResearch founded in California, USA in 2007.It is a leading global market research and consulting company. With over 16 years’ experience and professional research team in various cities over the world QY Research focuses on management consulting, database and seminar services, IPO consulting, industry chain research and customized research to help our clients in providing non-linear revenue model and make them successful. We are globally recognized for our expansive portfolio of services, good corporate citizenship, and our strong commitment to sustainability. Up to now, we have cooperated with more than 60,000 clients across five continents. Let’s work closely with you and build a bold and better future.
QYResearch is a world-renowned large-scale consulting company. The industry covers various high-tech industry chain market segments, spanning the semiconductor industry chain (semiconductor equipment and parts, semiconductor materials, ICs, Foundry, packaging and testing, discrete devices, sensors, optoelectronic devices), photovoltaic industry chain (equipment, cells, modules, auxiliary material brackets, inverters, power station terminals), new energy automobile industry chain (batteries and materials, auto parts, batteries, motors, electronic control, automotive semiconductors, etc.), communication industry chain (communication system equipment, terminal equipment, electronic components, RF front-end, optical modules, 4G/5G/6G, broadband, IoT, digital economy, AI), advanced materials industry Chain (metal materials, polymer materials, ceramic materials, nano materials, etc.), machinery manufacturing industry chain (CNC machine tools, construction machinery, electrical machinery, 3C automation, industrial robots, lasers, industrial control, drones), food, beverages and pharmaceuticals, medical equipment, agriculture, etc.
For more information, please contact the following e-mail address:
Email: [email protected]
Website: https://www.qyresearch.com
0 notes
Text
Xylitol Market Significant Players, Trends in Future, Revenue, Application, Types, Scope Forecast 2031
The “Xylitol Market Share, Size, and Trends | 2031” is market research by The Insight Partners. The Xylitol market has perceived tides of change in the recent past. This study offers precise projections after detailed scrutiny of a range of factors impacting the business. Considering the present market scenario, this report brings forward correct predictions on revenue, market size, and CAGR of the Xylitol market. The novel market research which is based on a fact-based foundation is now accessible for purchase. This report can make a variance in wide decision-making and drive business forward in the right direction.
Business is no longer a game of instincts when it comes to capitalizing on new production lines. In a highly competitive Xylitol market, companies may face several challenges. Having trusted market research is always endorsed for both veteran and new entrants. Xylitol Market report presents a thorough analysis of local, regional, and global market scenarios through the following details.
Report Attributes
Details
Segmental Coverage
Application
Chewing gum
Confectionery
Food
Personal care
Others
Regional and Country Coverage
North America (US, Canada, Mexico)
Europe (UK, Germany, France, Russia, Italy, Rest of Europe)
Asia Pacific (China, India, Japan, Australia, Rest of APAC)
South / South & Central America (Brazil, Argentina, Rest of South/South & Central America)
Middle East & Africa (South Africa, Saudi Arabia, UAE, Rest of MEA)
Market Leaders and Key Company Profiles
Cargill Incorporated
E. I. Du Pont De Nemours and Company
Ingredion Incorporated
Merck KGaA,
Mitsubishi Shoji Foodtech
Novagreen Inc.
Roquette Fr?res
Shandong Futaste Co.
Thomson Biotech
ZuChem
Other key companies
Competitive Landscape
Knowing the state of rivals is a strategically right move to outperform them. This report is the right place to explore key strategies, developments, and recent launches by key Xylitol market players. This report emphasizes an analysis of business strategies and expected growth opportunities for brands.
Key Coverings:
Current and Future Market Estimates- Xylitol Market Share, CAGR, and Forecast | 2031
Market Dynamics – Drivers, Challenges, Regional Trends, and Market Opportunities
Market Segmentation – Product, Application, End-use Industries, and Regional Growth Prospects.
Competition Matrix – Key Market Players and Strategies
Recent Developments and Innovation Contributing Market Growth
Need a Customized Market Research Report?
You can always share any specific requirements that you have, and our team will adjust the scope of research offerings as per your needs.
The following are some customizations our clients frequently ask for:
The Xylitol market report can be customized based on specific regions/countries as per the intention of the business
The report production was facilitated as per the need and following the expected time frame
Insights and chapters tailored as per your requirements.
Depending on the preferences we may also accommodate changes in the current scope.
Key Questions Addressed in the Xylitol Market Research Include:
What are present Xylitol market values, and what can be expected in the upcoming decade?
What are the key segments in the Xylitol market?
What is the regional distribution of the Xylitol market report?
What are the key players and their recent strategies?
What are the key factors driving Xylitol market growth?
What are regulatory concerns and requirements businesses have to compel?
Author’s Bio:
Shashikant Ligade
Senior Analyst The Insight Partners
0 notes
Text
Deliming Agent Market to Exceed USD 14.7 billion by 2031, Growing at a CAGR of 6.7% from 2022-2031
The global industry was valued at US$ 8.2 Bn in 2022. It is estimated to grow at a CAGR of 6.7% from 2023 to 2031 and reach US$ 14.7 Bn by the end of 2031.
Delving into niche industrial applications like electronic device manufacturing and aerospace, previously untouched by deliming agents, is an intriguing driver. As industries diversify and seek efficient processes, deliming agents are being explored for their potential to enhance precision cleaning in delicate components.
Don’t miss out on essential insights – Get your sample copy now: https://www.transparencymarketresearch.com/sample/sample.php?flag=S&rep_id=85777
Market Segmentation
By Service Type
Consultancy Services
Technical Support Services
Custom Formulation Services
By Sourcing Type
Natural
Synthetic
By Application
Leather Tanning
Leather Finishing
Others (e.g., cleaning agents, degreasing agents)
By Industry Vertical
Fashion and Apparel
Automotive
Furniture
Others (e.g., sports equipment, accessories)
By Region
North America
Europe
Asia Pacific
Latin America
Middle East & Africa
Regional Analysis
North America
The North American market is driven by high demand for premium leather products and stringent environmental regulations promoting the use of eco-friendly deliming agents. The United States and Canada are key contributors to the regional market growth.
Europe
Europe is a significant market due to its strong leather manufacturing base and high demand for quality leather goods. Countries like Italy, Germany, and France are prominent players, with a focus on sustainable and efficient leather processing techniques.
Asia Pacific
The Asia Pacific region is expected to witness the highest growth rate, driven by the booming leather industry in countries like China, India, and Vietnam. Increasing urbanization, rising disposable incomes, and a growing fashion industry contribute to the market expansion.
Latin America
In Latin America, Brazil and Argentina lead the market due to their large cattle population and strong leather production capabilities. The region benefits from abundant raw material availability and increasing export demand.
Middle East & Africa
The Middle East & Africa region shows moderate growth potential. The market is driven by increasing industrialization and a growing middle class with rising demand for leather products.
Market Drivers and Challenges
Drivers
Growing Leather Industry: The expanding global leather industry is a major driver for the deliming agent market.
Rising Demand for Premium Leather Goods: Increasing consumer preference for high-quality leather products fuels market growth.
Technological Advancements: Innovations in leather processing technologies enhance the efficiency and quality of deliming agents.
Challenges
Environmental Concerns: The use of certain chemicals in deliming agents raises environmental and regulatory concerns.
High Cost of Eco-friendly Agents: Natural and eco-friendly deliming agents can be more expensive, posing a challenge for widespread adoption.
Fluctuations in Raw Material Prices: Variability in raw material prices can impact the production cost and market stability.
Market Trends
Shift Towards Sustainable Leather Processing: Increasing focus on environmentally friendly and sustainable leather processing techniques is driving the adoption of eco-friendly deliming agents.
Technological Innovations: Development of advanced and efficient deliming agents with improved performance characteristics.
E-commerce Growth: The rise of online retail channels boosts market accessibility and consumer reach for leather products.
Future Outlook
The deliming agent market is poised for steady growth from 2023 to 2031, driven by the expanding leather industry and increasing demand for premium leather products. Continuous innovations in leather processing technologies and a shift towards sustainable practices will further enhance market opportunities.
Key Market Study Points
Detailed analysis of market drivers and challenges.
Comprehensive regional analysis to identify growth opportunities.
Market segmentation to understand specific consumer needs.
Competitive landscape analysis to assess market positioning.
Place an Order Copy of Deliming Agent Market Report at: https://www.transparencymarketresearch.com/checkout.php?rep_id=85777<ype=S
Competitive Landscape
The deliming agent market features several key players, including both established companies and emerging start-ups. Major companies focus on product innovation, sustainable sourcing, and strategic partnerships to maintain a competitive edge.
Recent Developments
Product Innovations: Companies are launching new and improved formulations of deliming agents.
Strategic Partnerships: Collaborations with leather manufacturers and raw material suppliers to enhance market reach and resource availability.
Sustainability Initiatives: Adoption of eco-friendly practices in production and packaging to appeal to environmentally conscious consumers.
About Transparency Market Research
Transparency Market Research, a global market research company registered at Wilmington, Delaware, United States, provides custom research and consulting services. Our exclusive blend of quantitative forecasting and trends analysis provides forward-looking insights for thousands of decision makers. Our experienced team of Analysts, Researchers, and Consultants use proprietary data sources and various tools & techniques to gather and analyses information.
Our data repository is continuously updated and revised by a team of research experts, so that it always reflects the latest trends and information. With a broad research and analysis capability, Transparency Market Research employs rigorous primary and secondary research techniques in developing distinctive data sets and research material for business reports.
Contact:
Transparency Market Research Inc.
CORPORATE HEADQUARTER DOWNTOWN,
1000 N. West Street,
Suite 1200, Wilmington, Delaware 19801 USA
Tel: +1-518-618-1030
USA – Canada Toll Free: 866-552-3453
Website: https://www.transparencymarketresearch.com
0 notes
Text
Buy Now Pay Later: Market Size Research Report by 2031

Buy Now Pay Later Market Report from Market Research Forecast highlights deep analysis on market characteristics, sizing, estimates and growth by segmentation, regional breakdowns & country along with competitive landscape, player’s market shares, and strategies that are key in the market. The exploration provides a 360° view and insights, highlighting major outcomes of the industry. These insights help the business decision-makers to formulate better business plans and make informed decisions to improved profitability. In addition, the study helps venture or private players in understanding the companies in more detail to make better informed decisions.
Major Players in This Report Include:
{"Affirm Holdings Inc. (U.S.)","Paypal (U.S.)","Klarna Bank AB (publ) (Sweden)","Laybuy Group Holdings Limited (New Zealand)","Perpay Inc., (Philadelphia)","Quadpay (U.S.)","Sezzle (U.S.)","Payl8r (U.K.)","Splitit (U.S.)","Billie (Germany)"}
Free Sample Report + All Related Graphs & Charts @: https://marketresearchforecast.com/report/buy-now-pay-later-market-1739/sample-report
The Buy Now Pay Later Market size was valued at USD 30.38 USD billion in 2023 and is projected to reach USD 113.38 USD billion by 2032, exhibiting a CAGR of 20.7 % during the forecast period.
Market Drivers:
Rising Number of E-commerce Platforms with Online Payment Methods is Accelerating Market Growth
Market Trend:
Rising Integration of Artificial Intelligence (AI) Technology in Apps to Augment Growth
Restrains:
Lack of Awareness of Service and High Availability of Multiple Payment Options to Impede Growth
Enquire for customization in Report @: https://marketresearchforecast.com/report/buy-now-pay-later-market-1739/enquiry-before-buy
In this research study, the prime factors that are impelling the growth of the Global Buy Now Pay Later market report have been studied thoroughly in a bid to estimate the overall value and the size of this market by the end of the forecast period. The impact of the driving forces, limitations, challenges, and opportunities has been examined extensively. The key trends that manage the interest of the customers have also been interpreted accurately for the benefit of the readers.
The Buy Now Pay Later market study is being classified {"Channel: Point of Sale (POS)","Enterprise Type: SMEs, Large Enterprises","Category: BFSI, Consumer Electronics, Fashion & Garment, Healthcare, Retail, Media and Entertainment, Others"}
The report concludes with in-depth details on the business operations and financial structure of leading vendors in the Global Buy Now Pay Later market report, Overview of Key trends in the past and present are in reports that are reported to be beneficial for companies looking for venture businesses in this market. Information about the various marketing channels and well-known distributors in this market was also provided here. This study serves as a rich guide for established players and new players in this market.
Get Reasonable Discount on This Premium Report @ https://marketresearchforecast.com/report/buy-now-pay-later-market-1739/request-discount
Extracts from Table of Contents
Buy Now Pay Later Market Research Report
Chapter 1 Buy Now Pay Later Market Overview
Chapter 2 Global Economic Impact on Industry
Chapter 3 Global Market Competition by Manufacturers
Chapter 4 Global Revenue (Value, Volume*) by Region
Chapter 5 Global Supplies (Production), Consumption, Export, Import by Regions
Chapter 6 Global Revenue (Value, Volume*), Price* Trend by Type
Chapter 7 Global Market Analysis by Application
………………….continued
This report also analyses the regulatory framework of the Global Markets Buy Now Pay Later Market Report to inform stakeholders about the various norms, regulations, this can have an impact. It also collects in-depth information from the detailed primary and secondary research techniques analysed using the most efficient analysis tools. Based on the statistics gained from this systematic study, market research provides estimates for market participants and readers.
Contact US :
Craig Francis (PR & Marketing Manager)
Market Research Forecast
Unit No. 429, Parsonage Road Edison, NJ
New Jersey USA – 08837
Phone: (+1 201 565 3262, +44 161 818 8166)
[email protected]
#Global Buy Now Pay Later Market#Buy Now Pay Later Market Demand#Buy Now Pay Later Market Trends#Buy Now Pay Later Market Analysis#Buy Now Pay Later Market Growth#Buy Now Pay Later Market Share#Buy Now Pay Later Market Forecast#Buy Now Pay Later Market Challenges
0 notes
Text
Europe EV Battery Market - Opportunity Analysis And Industry Forecast (2022-2029)
Meticulous Research®, a prominent market research firm, released a report titled "Europe EV Batteries Market by Type (Li-ion, Ni-MH, SLA, Ultracapacitors, Solid-state Batteries), Capacity (<50 kWh, 51-100 kWh, 101-300 kWh, >300 kWh), Bonding Type (Wire, Laser), Form, Application, End User, and Country - Forecast to 2029".
The European EV battery market is projected to expand at a compound annual growth rate (CAGR) of 45.8% from 2022, reaching $94.41 billion by 2029. This growth is primarily fueled by the rising global adoption of electric vehicles, falling battery prices, and the increasing localization of battery production. Additionally, the expanding use of battery-as-a-service presents lucrative growth opportunities for market participants.
However, the market's growth may be somewhat hindered by a potential shortage in lithium mining capacity. Additionally, safety concerns related to EV batteries pose a significant challenge to the expansion of the European EV batteries market.
The European EV batteries market is categorized by type, capacity, bonding type, form, application, end user, and country. The report also assesses industry competitors and conducts a country-level market analysis.
Based on type, the European EV batteries market is primarily divided into lithium-ion batteries, sealed lead acid batteries, nickel-metal hydride batteries, ultracapacitors, solid-state batteries, and other types. In 2022, the lithium-ion battery segment is projected to hold the largest market share. This dominance is largely due to its higher energy density, compact size, lightweight, low maintenance, fast charging capability, and durability. Battery OEMs in Europe are heavily investing in lithium-ion battery production for current and future electric vehicles through partnerships with various automotive OEMs.
Based on capacity, the European EV batteries market is categorized into segments of less than 50kWh, 51kWh to 100kWh, 101kWh to 300kWh, and more than 300kWh. In 2022, the 51kWh to 100kWh segment is anticipated to hold the largest market share. This significant share is primarily due to the rising initiatives such as collaborations between leading automotive OEMs and battery manufacturers to enhance battery technology, along with government targets across Europe to eliminate internal combustion engine vehicles by 2030.
Based on bonding type, the European EV batteries market is primarily divided into wire bonding and laser bonding. In 2022, the wire bonding segment is expected to hold the largest market share. This dominance is mainly due to its advantages such as fast and fully automated connections, thermal relief properties, reduced scrap production, high reliability, lower production costs, and easy replacement of faulty wire bonds. Wire bonding is capable of handling extreme temperatures, shocks, and vibrations over extended lifetimes. Consequently, it is increasingly used in battery cell-to-cell connections, battery cell-to-busbar connections, and battery management system (BMS) interconnects.
Based on form, the European EV batteries market is primarily segmented into prismatic, cylindrical, and pouch types. In 2022, the prismatic segment is expected to hold the largest market share. This significant share is due to its thin profile, which allows for efficient space utilization and design flexibility, along with low energy utilization and high-power quality. Automotive OEMs are collaborating with battery manufacturers to develop prismatic cells, ensuring a secure battery supply chain for both current and future electric vehicles and aiming to achieve technological leadership in EV batteries.
Based on application, the European EV batteries market is categorized into electric cars, light commercial vehicles, heavy commercial vehicles, e-scooters & motorcycles, and e-bikes. In 2022, the electric cars segment is expected to hold the largest market share. This is primarily due to the growing adoption of electric cars for private transportation and shared mobility services, increasing concerns about the environmental impact of vehicle emissions, supportive government initiatives for transportation decarbonization, and efforts by major automotive OEMs to reduce greenhouse gas emissions and shift to environmentally friendly vehicle line-ups. Additionally, automotive OEMs have announced plans to develop batteries specifically for electric vehicles.
Based on end user, the European EV batteries market is divided into electric vehicle OEMs and battery swapping stations. In 2022, the electric vehicle OEMs segment is expected to hold the largest market share. This significant share is primarily due to the rising consumer adoption of EVs for personal use, increased investments by automotive OEMs in EV battery manufacturing to ensure a secure supply chain for future electric vehicles, and the frequent introduction of new EV models by automotive OEMs.
Based on country, In 2022, Germany is projected to hold the largest share of the European EV batteries market. This significant market share is primarily due to the rising uptake of electric vehicles within the country, substantial investments by prominent automotive OEMs in building the electric vehicle infrastructure, and governmental efforts to promote research and development in battery cell technologies. German manufacturers are particularly focused on zero-emission technology advancements, which are contributing to the market's growth in the nation.
However, France is expected to secure the second position in terms of market share within the European EV batteries market in 2022. This substantial market share is primarily driven by growing investments from battery OEMs in establishing battery manufacturing facilities to cater to the rising demand for EV batteries. Additionally, government incentive programs aimed at encouraging EV adoption in the region further contribute to France's significant presence in the market.
The prominent players in the European EV batteries market include Northvolt AB (Sweden), Lithium Werks B.V. (Netherlands), Faradion Limited (U.K.), BMZ Group (Germany), DRÄXLMAIER Group (Germany), E4V (France), Britishvolt Limited (U.K.), Ilika plc (U.K.), and Johnson Matthey Plc (U.K.).
Download Sample Report Now: https://www.meticulousresearch.com/download-sample-report/cp_id=5221
Key Questions Answered in the Report-
What are the market segments experiencing significant growth in terms of type, capacity, bonding type, form, application, end user, and country?
What is the past market size of European EV batteries worldwide?
What are the projected market forecasts and estimates for the timeframe spanning from 2022 to 2029?
What are the primary factors motivating, limiting, offering prospects, and presenting obstacles within the European EV batteries market?
Who are the key players in the market, and what are their respective shares of the market?
What does the competitive environment look like in the European EV batteries market?
What are the latest advancements or updates in the European EV batteries market?
How do major players in the European EV batteries market implement various strategies?
What are the significant geographical patterns, and which countries show notable growth within the European EV batteries market?
Which local newcomers are making an impact in the European EV batteries market, and how do they compete with established players?
Contact Us:
Meticulous Research®
Email- [email protected]
Contact Sales- +1-646-781-8004
Connect with us on LinkedIn- https://www.linkedin.com/company/meticulous-research
#Europe EV Battery Market#EV Battery#Electric Vehicle Battery#EV Batteries#Battery Electric Vehicle#Electric Vehicle Batteries#lithium-ion Batteries
0 notes
Text
Super Apps: A Detailed Analysis of Market Size, and Growth Opportunities, Highlighting Industry Trends
The global super apps market size is expected to reach USD 426.01 billion by 2030, expanding at a CAGR of 27.8% during the forecast period, according to a new report by Grand View Research, Inc. Super apps are applications that consist of multiple features, offering a wide range of services to customers. They offer convenience and ease of use as most features can be accessed through a single application. Moreover, the adoption of digital payment and growth in online shopping among consumers, accelerated by the COVID-19 pandemic, is boosting the adoption of super apps. Moreover, the interest shown by the government in building similar applications further fuels the growth of the market. For instance, in March 2022, the Indian government reportedly planned to develop a super app for farmers. The app was to contain several critical features such as weather information, market price information, advisories, and others.

Super Apps Market Report Highlights
Super apps make it easier for consumers as they offer all essential services for daily activities without having to navigate multiple applications. Continuous increase in time spent on smartphones and mobile applications, mainly social media & messaging applications, contributes to the market's growth
Based on platform, the Android segment dominated the market in 2022 with a revenue share of 61.0% and is expected to expand at a CAGR of over 28.0% from 2023 to 2030
Based on device, the smartphone device segment is projected to grow at the fastest CAGR over the forecast period
Based on application, the social media & messaging segment dominated the market in 2022 and is expected to expand at a CAGR of 27.4% from 2023 to 2030
Based on end-user, the consumers segment is projected to grow at the fastest CAGR of 28.5% over the forecast period
The primary source markets for super apps are China, Japan, India, South Korea, the U.S., the U.K., and Southeast Asian countries such as Singapore and Indonesia are also likely to witness significant growth during the forecast period, owing to growing smartphone penetration and the presence of market players such as Singapore-based Grab and Indonesia-based Gojek tech (goto)
For More Details or Sample Copy please visit link @: Super Apps Market Report
Super apps provide transportation & logistics services such as taxis, carpooling, and food delivery. Many super apps have features where users can book a hotel, flight, and cinema tickets. Moreover, market players aim to drive user engagement which helps brands to promote their products or services on the super apps. Social media companies such as U.S.-based Meta, which operates social media platforms like Facebook and Instagram, are also planning to build their own super apps which is expected to create growth opportunities over the forecast period.
Based on platform, the super apps industry is divided into iOS, Android, and others. Most super apps are available on both iOS and Android. Android is an open-source operating system offering customization options. Whereas iOS is made specifically for U.S.-based Apple Inc. devices. Based on device, the market is divided into smartphones, tablets, and others. Smartphones dominated the device segment in 2022 owing to ease of use due to their smaller size and growing smartphone penetration across the world.
The super apps have lower penetration in developed North American and European countries. The less penetration of super apps in developed countries is due to stricter regulations regarding data privacy policies. Though these countries have less penetration, they have prominent players in each vertical of super app services. For instance, U.S.-based Amazon.com, Inc. dominates the e-commerce space, whereas U.S.-based Uber Technologies Inc. dominates the ride-hailing space.
Some of the key players are adopting different development strategies such as product launches, partnerships, business expansions, and others to expand their presence and market share. In April 2022, India-based Tata Sons Private Limited’s subsidiary Tata Digital announced the launch of a super app called Tata Neu. The super app offers various services, including e-commerce and financial services. The super app was made available on Android and iOS platforms and hosts several brands, including Croma, Tata 1mg, and Tata CLiQ. The company aimed to offer a seamless experience to Indian consumers with the launch of Tata Neu.
#SuperApps#DigitalTransformation#MobileApps#TechnologyTrends#MarketAnalysis#MobilePayments#Ecosystem#UserExperience#PlatformEconomy#EmergingTechnologies#MobileCommerce#AppEconomy#IntegratedServices
0 notes
Text
Caffeine Market - Forecast ( 2022-2027)
The Caffeine Market size is estimated to reach $23.3 billion by 2027 and it is poised to grow at a CAGR of 7.2% over the forecast period of 2022-2027. Caffeine's expanding uses in numerous end-use industries, such as cosmetics and food and beverages, are likely to boost caffeine industry demand. And increased caffeine consumption to treat diseases such as colon, liver and colorectal cancers is fueling the caffeine market size. Caffeine is a white crystalline powder that is extracted from plants. It is known as a drug that stimulates the nervous system in the pharmaceutical industry. Caffeine levels in cocoa beans range from 0.1 to 0.7 percent. Caffeine can also be found in small levels in the skin that surrounds cocoa beans. Caffeine derivatives made from synthetic sources are known as synthesized caffeine. Unlike natural caffeine, which is derived from coffee, tea, cocoa leaves and other natural sources, synthetic caffeine is created in a laboratory using a variety of chemical components. Urea and cyanoacetic acid are the major synthetic substances that are utilized to make synthetic caffeine.
Caffeine Market Report Coverage
The “Caffeine Market Forecast (2022-2027)" by Industry ARC, covers an in-depth analysis of the following segments in the Caffeine Market.
By Type - Natural Caffeine and Synthesized Caffeine.
By End-user - Food & Beverages, Pharmaceuticals, Flavors & Fragrances, Skin Care Products and Others.
by Distribution Channel - Supermarkets/Hypermarkets, Convenience Stores, Discount Stores, Specialty Stores, E-commerce, and Others.
By Geography - North America (the U.S., Canada and Mexico), Europe (Germany, United Kingdom (UK), France, Italy, Spain, Russia and the Rest of Europe), Asia Pacific (China, Japan India, South Korea, Australia & New Zealand and Rest of Asia Pacific), South America (Brazil, Argentina, Chile, Colombia and Rest of South America) and Rest of the World (the Middle East and Africa).
Key Takeaways
Individuals' increasing intake of caffeinated beverages is a crucial driver driving the global caffeine industry forward.
Furthermore, rising health awareness and increased participation in sports and physical activities are driving global market size.
Caffeine's expanding uses in numerous end-use industries, such as cosmetics and food and beverages, are likely to boost caffeine industry demand.
Request Sample
Caffeine Market Segmentation Analysis - by Type
The Caffeine Market based on type can be further segmented into Natural Caffeine & Synthesized Caffeine. The Natural Caffeine segment held a dominant market share in the year 2021. Natural coffee is in high demand owing to the numerous health benefits it provides. For instance, it's high in antioxidants like polyphenols, flavonoids and catechins. It acts by preventing adenosine receptors in the brain from functioning. This prevents the brain from recognizing that it is weary, which is why caffeine is so good at combating tiredness and assisting in staying awake. However, Synthetic caffeine is poised to be the fastest-growing, with a CAGR of 8.4% over the forecast period of 2022-2027. The demand for the product is being driven by rising consumer preferences for instant energy drinks. Moreover, Synthetic caffeine is high in antioxidants and is predicted to gain popularity in the near future as people's reliance on rapid energy items grows.
Caffeine Market Segmentation Analysis- by End User
The Caffeine Market based on type can be further segmented into Food & Beverages, Pharmaceuticals, Flavors & Fragrances, Skin Care Products and Others. The Food & Beverages segment held a dominant market share in the year 2021. This is mainly attributed to rising consumer demand for caffeinated beverages such as tea, coffee and soft drinks. However, Flavors & Fragrances is poised to be the fastest-growing, with a CAGR of 9.5% over the forecast period of 2022-2027 owing to the rising popularity of caffeine in fragrances among customers. Caffeine flavor and fragrance compounds come in a variety of forms, including synthetic substances as well as coffee extract. Caffeine is a popular scented candle scent and it's even been utilized to generate muskier undertones in a number of perfumes and colognes. Caffeine energizing properties have made it popular as a room deodorizer and it has also been employed in a variety of "novelty" fragrance items.
Inquiry Before Buying
Caffeine Market Segmentation Analysis - by Geography
Based on Geography the Caffeine market can be divided into North America, Europe, Asia-Pacific, South America and the Rest of the World based on geography. Asia-Pacific held a dominant market share of 31% in 2021 owing to the focus of cosmetic manufacturers in the region on launching products with natural ingredients. However, owing to the rising consumption of caffeinated beverages in the region, the North American caffeine market is likely to rise at a substantial rate during the forecast period. Furthermore, caffeine is a common element in weight-loss products. As a result, increased obesity rates in the region will increase caffeine demand over the projection period. Obesity is predicted to increase national healthcare costs in the U.S. by US$149 billion a year, according to the Trust for America's Health, a Washington, D.C.-based health policy organization.
Caffeine Market Drivers
Growing Demand for Caffeine-Based Nutritional Drinks is Boosting the Market Growth
Coffee consumption has risen throughout South and East Asia and this expanding market is likely to fuel the caffeine industry. In most Asia Pacific countries, including China and India, busy lifestyles and longer working hours have contributed to an increase in caffeine use to combat drowsiness and exhaustion. For instance, according to ICO’s annual report published in 2019, coffee consumption in South and East Asia has grown at a pace of 6 percent in the last 25 years. According to the USDA, around 80% of adults in the United States consume caffeine on a daily basis each year. Moreover, key manufacturers in the industry are developing new caffeinated goods in response to increased demand for organic meals thus enhancing caffeine market share.
Caffeine's Increasing Use in Pharmaceutical and Personal Care Industries is Propelling the Caffeine Market Size Forward
Caffeine is extensively used throughout the pharmaceutical and personal care industries as an ingredient. Increased usage of coffee-flavored personal care products is expected to boost the caffeine market demand. For example, according to L'Oreal S.A.'s quarterly report released in April 2020, skincare-focused brands including Kiehl's, Lancôme and Helena Rubinstein beat the company's other luxury brands in the first quarter of 2020. The personal care brand caffeine is mostly based on cocoa beans. It has already reached cult status in the Indian D2C beauty market, having sold over 10 million goods. The business is no stranger to the 'world's first club,' which debuted the world's first coffee bean-shaped bathing bar in late 2020 (patent pending in India). As a result of skincare firms focusing on personal hygiene and cleansing products, demand for cosmetic chemicals like caffeine is predicted to rise.
Schedule a Call
Caffeine Market Challenges
The Detrimental Effects of Excessive Caffeine Consumption are Impeding Caffeine Market Share.
Over consumption of caffeine causes negative effects such as restlessness, insomnia, headaches, dizziness, dehydration and anxiety. These adverse effects prompted customers to seek out healthier caffeinated substitutes. Ginseng, pomegranate juice, maca, baobab and reishi are just a few of the caffeine substitutes. The FDA has found that 400 mg per day roughly 4 or 5 cups of coffee is not typically associated with dangerous or damaging effects in healthy people, but that exceeding this amount can have harmful implications. According to Mayoclinic, The US Food and Drug Administration has warned that caffeine in powder or liquid form can contain hazardous quantities of caffeine. Each teaspoon of caffeine powder is about the same as 28 cups of coffee. Furthermore, food ingredients industry players are focusing on creating items that may replace caffeine in food products, which is projected to limit caffeine market growth.
Buy Now
Caffeine Industry Outlook
Product launches, mergers and acquisitions, joint ventures and geographical expansions are key strategies adopted by players in the Caffeine Market. The top 10 Caffeine Market companies are-
BASF SE
CSPC Pharmaceutical Group Limited
Shandong Xinhua Pharmaceutical Co Ltd.
Aarti Healthcare Ltd.
Jilin Shulan Synthetic Pharmaceutical Co Ltd.
Kudos Chemie Limited
Spectrum Chemical Mfg. Corp.
Tianjin Zhong'an Pharmaceutical Co. Ltd.
Taj Pharmaceuticals Ltd.
Bakul Group
Recent Developments
In September 2019, Bawls Acquisition LLC (a soft drink manufacturing firm based in the United States) added BAWLS Guarana's Cherry Cola to its premium line of highly caffeinated sodas. BAWLS Guarana's current collection of caffeinated sodas includes Orange, Cherry, Root Beer, BAWLS Zero and Ginger, among others.
In August 2019, Atomo Coffee Inc. revealed that it has received US$ 2.6 million in funding to produce the world's first molecular coffee made without the use of beans. By reverse-engineering coffee beans, the startup hopes to halt deforestation.
In March 2019, the Coca-Cola Company released Coca-Cola Energy, an energy drink. In Hungary and Spain, the product was released. Caffeine was derived from natural sources, such as vitamin B and guarana extracts, in this energy drink.
For more Food and Beverage Market reports, please click here
#Caffeine Market Price#Caffeine Market Size#Caffeine Market trends#Caffeine Market share#Caffeine Market analysis
2 notes
·
View notes
Text
How Cloud Storage is Revolutionizing Data Management: An In-depth Analysis of the Standalone Cloud Storage Market
The Standalone Cloud Storage Market is experiencing unprecedented growth driven by the increasing need for scalable, flexible, and cost-effective data storage solutions across various industries. This market segment is characterized by a plethora of providers offering standalone cloud storage services, catering to the diverse needs of businesses ranging from small startups to large enterprises. Key players in this market include established tech giants like Amazon Web Services (AWS), Google Cloud Platform, and Microsoft Azure, as well as niche players offering specialized services. Factors such as the rising volume of digital data, growing adoption of hybrid and multi-cloud strategies, and advancements in cloud technology infrastructure are fueling the expansion of the standalone cloud storage market. Moreover, with the proliferation of Internet of Things (IoT) devices and the increasing demand for real-time analytics, the importance of reliable, secure, and scalable cloud storage solutions is becoming paramount. This report provides comprehensive insights into market trends, competitive landscape, key challenges, and growth opportunities shaping the standalone cloud storage market landscape.
𝐂𝐥𝐢𝐜𝐤 𝐇𝐞𝐫𝐞, 𝐓𝐨 𝐆𝐞𝐭 𝐅𝐫𝐞𝐞 𝐒𝐚𝐦𝐩𝐥𝐞 𝐑𝐞𝐩𝐨𝐫𝐭 https://stringentdatalytics.com/sample-request/stand-alone-cloud-storage-market/14317/
Market Segmentations:
Global Stand Alone Cloud Storage Market:
ByCompany
AT&T
Amazon Web Services
Google
HP
IBM
Microsoft
Global Stand Alone Cloud Storage Market:
ByType
Primary Storage
Cloud Storage Gateway
Data Archiving
Disaster Recovery and Back Up Storage
Global Stand Alone Cloud Storage Market:
ByApplication
BFSI
Retail and E-commerce
Government
Travel and Hospitality
IT and Telecommunication
Healthcare
Education
Others
Global Stand Alone Cloud Storage Market:
RegionalAnalysis
The regional analysis of the global Stand Alone Cloud Storage market provides insights into the market’s performance across different regions of the world. The analysis is based on recent and future trends and includes market forecast for the prediction period. The countries covered in the regional analysis of the Stand Alone Cloud Storage market report are as follows:
North America: The North America region includes the U.S., Canada, and Mexico. The U.S. is the largest market for Stand Alone Cloud Storage in this region, followed by Canada and Mexico. The market growth in this region is primarily driven by the presence of key market players and the increasing demand for the product.
Europe: The Europe region includes Germany, France, U.K., Russia, Italy, Spain, Turkey, Netherlands, Switzerland, Belgium, and Rest of Europe. Germany is the largest market for Stand Alone Cloud Storage in this region, followed by the U.K. and France. The market growth in this region is driven by the increasing demand for the product in the automotive and aerospace sectors.
Asia-Pacific: The Asia-Pacific region includes Singapore, Malaysia, Australia, Thailand, Indonesia, Philippines, China, Japan, India, South Korea, and Rest of Asia-Pacific. China is the largest market for Stand Alone Cloud Storage in this region, followed by Japan and India. The market growth in this region is driven by the increasing adoption of the product in various end-use industries, such as automotive, aerospace, and construction.
Middle East and Africa: The Middle East and Africa region includes Saudi Arabia, U.A.E, South Africa, Egypt, Israel, and Rest of Middle East and Africa. The market growth in this region is driven by the increasing demand for the product in the aerospace and defense sectors.
South America: The South America region includes Argentina, Brazil, and Rest of South America. Brazil is the largest market for Stand Alone Cloud Storage in this region, followed by Argentina. The market growth in this region is primarily driven by the increasing demand for the product in the automotive sector.
click Here, To Buy Premium Report
Key Questions Answered in This Report:
1. What are the current market trends driving adoption of stand-alone cloud storage solutions?
2. Which stand-alone cloud storage providers are leading the market, and what distinguishes their offerings?
3. How do stand-alone cloud storage solutions compare in terms of security features and data protection measures?
4. What factors influence pricing models in the stand-alone cloud storage market, and how do they vary among providers?
5. What are the scalability options offered by stand-alone cloud storage solutions, and how can businesses effectively scale their storage infrastructure?
6. How do stand-alone cloud storage solutions address compliance requirements and regulatory standards across different industries?
7. What integration capabilities do stand-alone cloud storage providers offer with other enterprise systems and applications?
8. What are the key challenges and limitations associated with stand-alone cloud storage adoption, and how can businesses mitigate them?
9. What are the emerging technologies and innovations shaping the future of stand-alone cloud storage solutions?
10. How do businesses effectively evaluate and select the right stand-alone cloud storage provider to meet their specific needs and requirements?
About Stringent Datalytics
Stringent Datalytics offers both custom and syndicated market research reports. Custom market research reports are tailored to a specific client’s needs and requirements. These reports provide unique insights into a particular industry or market segment and can help businesses make informed decisions about their strategies and operations.
Syndicated market research reports, on the other hand, are pre-existing reports that are available for purchase by multiple clients. These reports are often produced on a regular basis, such as annually or quarterly, and cover a broad range of industries and market segments. Syndicated reports provide clients with insights into industry trends, market sizes, and competitive landscapes. By offering both custom and syndicated reports, Stringent Datalytics can provide clients with a range of market research solutions that can be customized to their specific needs.
Contact Us
Stringent Datalytics
Contact No- +1 346 666 6655
Email Id- [email protected]
Web- https://stringentdatalytics.com/
0 notes
Text
Global top 24 companies accounted for 48% of Network Encryption market(qyresearch, 2021)
Network encryption is the process of encrypting or encoding data and messages transmitted or communicated over a computer network.
It is a broad process that includes various tools, techniques and standards to ensure that the messages are unreadable when in transit between two or more network nodes.
Network encryption is primarily implemented on the network layer of the OSI model. Network encryption implements one or more encryption algorithms, processes and standards to encrypt the data/message/packet sent over the network. The encryption services are generally provided by encryption software or through an integrated encryption algorithm on network devices and/or in software.
On an IP-based network, network encryption is implemented through Internet Protocol Security (IPSec) -based encryption techniques and standards. Each message sent is in an encrypted form and is decrypted and converted back into plain text/original form at the recipient's end using encryption/decryption keys.
According to the new market research report “Global Network Encryption Market Report 2023-2029”, published by QYResearch, the global Network Encryption market size is projected to reach USD 7.95 billion by 2029, at a CAGR of 11.1% during the forecast period.
Figure. Global Network Encryption Market Size (US$ Mn), 2018-2029
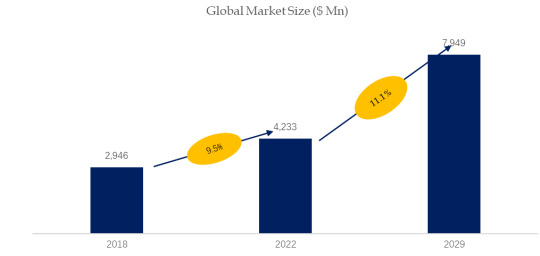
Figure. Global Network Encryption Top 24 Players Ranking and Market Share(Based on data of 2021, Continually updated)
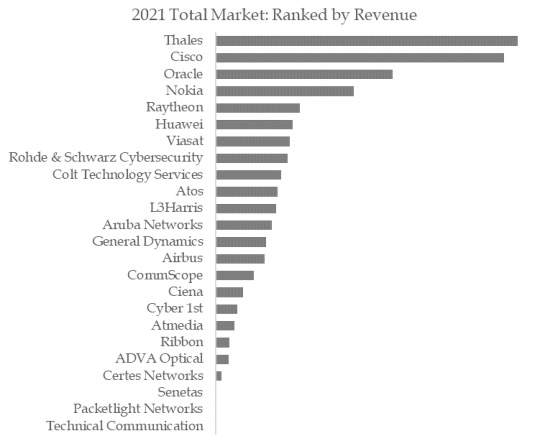
The global key manufacturers of Network Encryption include Technical Communication, Packetlight Networks, Senetas, Certes Networks, ADVA Optical, Ribbon, Atmedia, Cyber 1st, Colt Technology Services, Atos, etc. In 2021, the global top five players had a share approximately 48.0% in terms of revenue.
About QYResearch
QYResearch founded in California, USA in 2007.It is a leading global market research and consulting company. With over 16 years’ experience and professional research team in various cities over the world QY Research focuses on management consulting, database and seminar services, IPO consulting, industry chain research and customized research to help our clients in providing non-linear revenue model and make them successful. We are globally recognized for our expansive portfolio of services, good corporate citizenship, and our strong commitment to sustainability. Up to now, we have cooperated with more than 60,000 clients across five continents. Let’s work closely with you and build a bold and better future.
QYResearch is a world-renowned large-scale consulting company. The industry covers various high-tech industry chain market segments, spanning the semiconductor industry chain (semiconductor equipment and parts, semiconductor materials, ICs, Foundry, packaging and testing, discrete devices, sensors, optoelectronic devices), photovoltaic industry chain (equipment, cells, modules, auxiliary material brackets, inverters, power station terminals), new energy automobile industry chain (batteries and materials, auto parts, batteries, motors, electronic control, automotive semiconductors, etc.), communication industry chain (communication system equipment, terminal equipment, electronic components, RF front-end, optical modules, 4G/5G/6G, broadband, IoT, digital economy, AI), advanced materials industry Chain (metal materials, polymer materials, ceramic materials, nano materials, etc.), machinery manufacturing industry chain (CNC machine tools, construction machinery, electrical machinery, 3C automation, industrial robots, lasers, industrial control, drones), food, beverages and pharmaceuticals, medical equipment, agriculture, etc.
For more information, please contact the following e-mail address:
Email: [email protected]
Website: https://www.qyresearch.com
0 notes
Text
South Korea Paper Products Market– Forecast (2024-2030)
South Korea paper products market size is forecast to reach USD 18.5 billion by 2030, after growing at a CAGR of 5.2% during 2024-2030. The paper products market encompasses the production, distribution, and sale of various goods made from paper and paperboard materials. The emphasis on environmental sustainability is a significant factor in paper packaging. Companies focusing on producing eco-friendly and recyclable packaging materials to meet the growing demand for sustainable and responsible packaging solutions are driving the South Korean paper products market. This includes developing new types of paper products, improving manufacturing processes, and creating sustainable packaging solutions.A growing number of South Korean cosmetic enterprises are adopting eco-friendly packaging in response to the rising demand for KBeauty products and the need to minimize the use of single-use plastic. Consequently, the Korea Cosmetic Association initiated the '2030 Cosmetics Plastic Initiative' in January, intending to eliminate non-recyclable materials by 2030. In May 2021 Kolmar Korea, a cosmetics and pharmaceuticals company based in South Korea, created environmentally friendly paper packaging specifically for tube-shaped beauty creams. According to the Korea Paper Association Corrugated support paper domestic consumption increased from 4,775,394 tons in 2019 to 5,171,959 tons in 2022.
Request Sample
Report Coverage
The report “South Korea Paper Products Market– Forecast (2024-2030)”, by IndustryARC, covers an in-depth analysis of the following segments of the South Korea paper products market.By Type: Paper Cups, Paper Packaging, Paper Straws, and OthersBy Coating: PE Coated, PLA-coated, Water base barrier coating, Others By End User: Quick Service Restaurants, Offices and Educational Institutions, Residential, Courier Companies, Food Delivery Companies, Others
Key Takeaways• Research and development (R&D) initiatives in the paper products market in South Korea can lead to innovative solutions, improved product quality, and a competitive edge. In 2022, Researchers at the Korea Research Institute of Chemical Technology have created readily mass-produced and environmentally friendly paper straws, 100% biodegradable, and function better than traditional paper straws. Presently on the market, paper straws are not composed of paper.• Sustainable packaging solutions are in high demand in South Korea. Packaging waste has steadily increased as a result of the rapid expansion of the e-commerce business, the skyrocketing popularity of HMR items, and the increase in single-person dwellings, among other factors. This tendency was further fueled by the COVID-19 epidemic, which awakened all aspects of Korean society to the environmental effect of packaging waste and the necessity for sustainable packaging alternatives. • The rapid growth of e-commerce is an opportunity for paper packaging while raising expectations for packaging sustainability. Domestic e-commerce sales have been rising over the previous years, reaching $168.5 billion in 2021 from $135.1 billion in 2020, according to the International Trade Administration (ITA). The market is currently expanding due to the growth of the e-commerce and retail industries, as well as the increasing need for ecologically friendly packaging materials.
By Type - Segment AnalysisPaper Packaging dominated the South Korea paper products market in 2023. Due to their hectic lifestyles and growing awareness of the impact packaging materials have on the environment, people in the nation are choosing easily accessible and environmentally friendly packaging solutions. Thus, it is expected that the need for packaging supplies made of paper will rise. The government of South Korea banned all single-use plastics in 2019 due to the country's excessive use of these materials.The market is currently expanding due to the growth of the e-commerce and retail industries, as well as the increasing need for environmentally friendly packaging materials. South Korea's domestic internet sales increased to USD 168.5 billion in 2021 from USD 135.1 billion in 2020, as reported by the US Department of Commerce's International Trade Administration. The proliferation of online shopping platforms has led to a significant growth in the demand for secondary and tertiary paper packaging items.
Buy Now
By Coating - Segment Analysis
PLA-coated dominated the South Korea paper products market in 2023. PLA-coated paper conforms to ASTM D6400 and EN13432 Bio-standards. In a composting environment, it can break down into carbon dioxide and water. It benefits the environment and the human body in a non-toxic way. According to FDA and EU food contact regulations, disposable papenullr containers made of PLA-coated paper are safe to come into contact with food service. Paper goods, particularly cups, were commonly lined or coated with plastic or polyethylene (PE). Plastic is bad for the environment and does not biodegrade. With none of the negative environmental effects of PE, PLA performs the same function. It can drastically cut down on how much plastic film is used in paper packaging.
By End User - Segment Analysis
Quick Service Restaurants dominated the South Korea paper products market in 2023. The paper products market in South Korea's quick service restaurants is thriving, driven by the growing demand for convenient and on-the-go food options. With the focus on eco-friendly and sustainable practices, the market is witnessing an increased demand for biodegradable and compostable paper products. The South Korean Ministry of Environment declared on January 24, 2022, that as of June 10, 2022, a deposit program for single-use cups from chain cafés and restaurants would be put into place. Consumers of South Korean chains with over 100 locations will pay 300 KRW (0.25 USD, 0.22 EUR) for each throwaway cup. This trend has led to an increase in the demand for biodegradable and compostable paper cups and plates in QSRs.
Drivers – South Korea Paper Products Market
• Increasing Government Initiatives will Drive the MarketThe South Korean Ministry of Environment declared on January 24, 2022, that starting on June 10, 2022, a deposit program for single-use cups from chain cafés and restaurants will be implemented put into place. Consumers of South Korean businesses with over 100 locations will pay 300 KRW ($0.25) for each disposable cup. Returning cups to any franchise that is part of the deposit scheme is permitted. The Ministry has established guidelines for both paper hot cups and plastic cold cups to guarantee superior recycling capabilities. The new approach will apply to around 80% of disposable cups sold in South Korea. Governments may implement regulations aimed at reducing the use of single-use plastics and encouraging the adoption of eco-friendly alternatives. This can create a favourable environment for the paper products industry, as paper is often considered a more sustainable option.
• Paper Products and Other Disposable Food Packaging are in High Demand due to the Growth of Delivery Services According to the International Trade Administration (ITA), With 13.3% of all e-commerce transactions in 2021 coming from Korean e-commerce platforms, food delivery services were the most popular services. However, before the COVID-19 pandemic, food delivery services made up only 2.2% of all e-commerce revenues, with travel and transportation services accounting for the majority at 12.9%. In 2021, Koreans purchased more food from restaurants via delivery services, spent a lot less money dining out, and traveled less than previously.Online sales of food delivery services increased by 48.2% year over year to 25.7 trillion won, while sales of food and drink increased by 26.3% to 24.9 trillion won. The significant amount of food and drink in e-commerce transactions might lead to a rise in the country's demand for paper packaging.
Challenges – South Korea Paper Products Market
• Deforestation's Effects on Paper PackagingOne of the primary challenges with paper packaging is the potential for deforestation and habitat destruction. For instance, through its subsidiary firm, Moorim Paper, a South Korean corporation involved in the production and sale of paper and pulp products, took off almost 6,000 hectares of forest between 2015 and 2021. They oversee 64,000 hectares of land, so in the upcoming years, additional forests might be cut down. If the demand for paper is not managed sustainably, it can lead to negative impacts on biodiversity, local communities, and the overall health of forests. Unsustainable logging practices can lead to resource depletion and a loss of biodiversity in forests.
• Limited Shelf LifeIn certain cases, paper packaging might have a shorter shelf life compared to materials with better barrier properties. This can impact the suitability of products with longer shelf lives. Paper packaging may not have the same inherent strength and durability as materials like plastics or metals. Heavy goods require packaging that can withstand the weight and potential impact during transportation and handling. The necessity for the paper to package highly heavy goods presents the biggest obstacle for the paper packaging business, which has led to competition from the plastics and metal packaging sectors. In certain cases, consumers might perceive paper packaging for heavy goods as less reliable or protective than alternatives like plastic or metal.
Market Landscape
Technology launches, acquisitions, and R&D activities are key strategies adopted by players in the South Korea paper products market. In 2023, the South Korea paper products market share has been fragmented by the major players accounting for 17.5% of the share. Major players in the South Korea paper products market are Asia Paper Manufacturing. Co., Ltd, Hansol Paper Co., Ltd., Korea Export Packaging Ind.Co., Ltd, Moorim Paper CO., LTD., Sambo Corrugated-Board Co., Ltd., Paper Corea Inc., Dongwon Systems, Youlchon ChemicalLtd, Daeyang Paper Industry Co., Ltd., ACE Pack among others.
0 notes
Last Seen Blogs

n-cityxc
N-ah C-ah T-ah WOO❕

goodieghosty
♡♡♡

sillysnowden11
Wind Goddess

cecihsprouse
Danna~ ♡

qufovolop
Без названия