#worldometer
Text
Maharashtra-kerla Corona Updates: केरल-महाराष्ट्र में कोरोना का ग्राफ एक बार फिर से बढ़ा, नए मरीजों की औसत संख्या 3000 के पार
Maharashtra-kerla Corona Updates: केरल-महाराष्ट्र में कोरोना का ग्राफ एक बार फिर से बढ़ा, नए मरीजों की औसत संख्या 3000 के पार
Corona
Highlights
महाराष्ट्र में कोरोना के 2,962 नए मरीज मिले
केरल में कोरोना के 3,322 नए मामले सामने आए
केरल में 2 मरीजों की मौत की भी खबर सामने आई
Maharashtra-kerla Corona Updates: महाराष्ट्र में रविवार को कोरोना वायरस संक्रमण के 2,962 नए मामले सामने आने के बाद संक्रमितों की कुल संख्या बढ़कर 79,85,296 हो गई। स्वास्थ्य विभाग के बुलेटिन में कहा गया है कि नए मामलों में से 761 मुंबई से सामने आए…

View On WordPress
#2 dead due to corona#corona update in india#Corona Updates#Cororna#covid in kerla#Covid in Maharashtra#covid in states#covid india#india corona cases#National Hindi News#worldometer india#केरल में दो की मौत#कोरोना के नए मामले#कोरोना संक्रमण#कोरोना से मौत#महाराष्ट्र और केरल में कोरोना#संक्रमित मरीज
0 notes
Photo
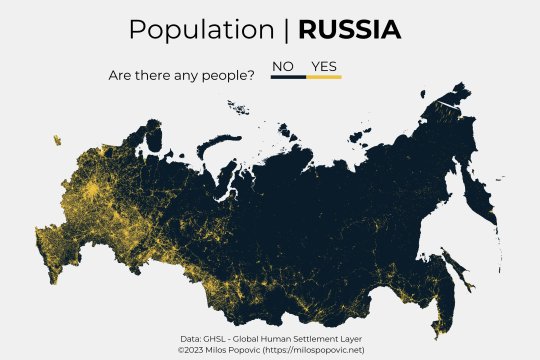
According to Worldometer, Russia has a population density of 9 people per square kilometer, making it one of the least densely populated countries in the world.
by milos_agathon
198 notes
·
View notes
Note
Hello.
If it's not too much trouble, can you name the specific sites that show abortion is the number 1 killer of babies?
Normally, I would Google it, but I'm worried I'll either find another set of statistics that don't show this or I won't find anything recent. Maybe if I looked through my liked blogs, I'd find the site, but... we're talking nearly 4,000+ liked blogs 😅
No worries I understand that’s a lot to sift through lol
And honestly, even using google it will be challenging to find a place that lists it as the number one killer because, as messed up as it is, nowhere that officially calculates leading causes of death even includes abortion in the statistics. They don’t count it as a cause of death for infants at all and that’s because if they did it would surpass every other cause at an alarming rate.
This is why to determine that we have to look at the numbers ourselves. Most places says SIDS or birth defects are the leading cause of death in infants (after birth, of course).
According to the CDC, there 3400 cases of SIDS per year in the US.
And for birth defects and congenital abnormalities they estimate about 3,963 deaths per year.
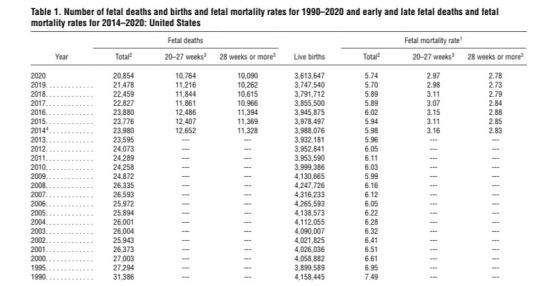
Here is a chart for the leading causes of fetal death in 2020 from the CDC
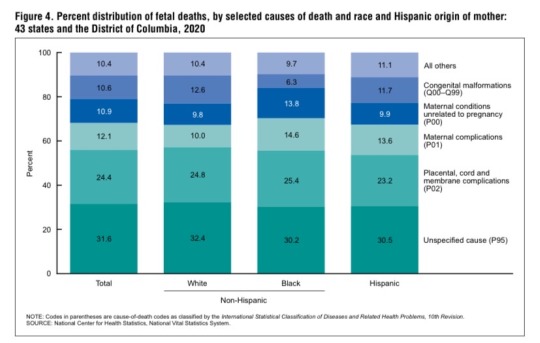
And we can see from this chart that in 2020 there where about 20,854 fetal deaths.
In contrast, if we look at the CDC for how many abortions were performed in the US in 2020, we see the number is 620,327. And anyone who can tell which number is bigger can see what the real leading cause of death for infants is.
But not only is abortion the leading cause of death in infants, it is the leading cause of death worldwide.
This snapshot from worldometer on Dec. 31 of 2021 shows that there were over 42 million abortions performed.

If we look at the current worldometer stat we can see there have already been almost 28,000,000 abortions performed throughout the world this year.

Here some articles that discuss abortion being the leading cause of death although they are not research sites.
Hope this was helpful!
91 notes
·
View notes
Text
Abortion has topped several infectious diseases as the world's leading cause of death for at least the fifth year in a row, even though multiple abortion restrictions have gone into place at the state level following the U.S. Supreme Court's reversal of Roe v. Wade.
Statistics compiled by Worldometer, a database that tracks quantitative data on health, the global population and other metrics in real-time, show that more than 44.6 million abortions were performed worldwide in 2023. The last available snapshot of Worldometer from 2023, captured by the Internet Archive Wayback Machine by Dec. 31, shows that the number of abortions performed last year exceeds...
3 notes
·
View notes
Text
Stats
5.4 million people living in Palestine in 2023.
The median age in Palestine is 19.6.
47.3% of Palestine is under 18.
Israel has killed over 12k people in Gaza (the second largest city in Palestine) since October 7.
Regardless of what side you think is "right", there is no justification for the deaths of so many people when Israel has received at least 3 billion dollars in 2023 and is requesting an additional 14k, all from America. The Israeli forces could easily afford to train and equip a special forces team to go in and handle only Hamas with minimal casualties if that was what they were after.
How we can help-
Boycott (Do not purchase, support, or use) Bolded ones are the most commonly used
HP (printers etc)
Siemens (Chevron gas)
AXA (insurance)
Puma (sports brand)
SodaStream (carbonated water machine)
Ahava (minerals)
Sabra (hummus)
Starbucks** (coffee)
Dominos (pizza)
Pizza Hut (pizza)
Papa Johns (pizza)
McDonalds (fast food)
Burger King (fast food)
Wix (website builder)
Carrefore (wholesale)
Re/Max (real estate)
CAT (construction)
Elbit Systems (international defense systems)
Hyundai (cars)
Volvo (cars)
CAF (real estate)
Barclays (bank- move your money to a different one, or even better a credit union)
TKH Security (home security)
HIK Vision (AI)
Pressure (write letters, send emails, make calls)
YOUR GOVERNMENT REPRESENTATIVES (any government official who is not in support of a ceasefire. the president, your governor, mayor, house reps, senate, congress, etc)
White House Phone Number- 202-456-1414
Amazon (retailer)
AirBnb (rent a house)
Booking.com (travel reservations)
Expedia (travel reservations)
Disney (media- also being boycotted)
Google (search engine- also being boycotted)
It's so overwhelming what's going on, but let's all collectively do all we can.
sources- Worldometer, CNN, Axois, The BNC, The BDS
**Not officially recommended by the BDS but has been happening and making an impact
#free palestine#palestine#ceasefire#boycott israel#boycott starbucks#boycott disney#boycott mcdonalds#defund israel#call the president#call your reps#call your senators#how we can help
4 notes
·
View notes
Text
Trying to Fix the Ilvermorny Controversy

Okay, so I don't remember it clearly, but I recall there being controversy about the NA representation in the creation of Ilvermorny and how it continues the cycle of colonialism. Please (politely) correct me if I'm missing or misunderstanding any information about it!
Do you think the controversy would've been alleviated if:
James, Webster, and Chadwick were Native American. James being an NA No-Maj would be beneficial, not just because he makes an interracial, intermagic couple with Isolt, but also because his influence would help Ilvermorny have more of a Native American flair in terms of styles of teaching and architecture. The couple adopting Chadwick and Webster (who in this perspective are NA orphans) only further cements this relationship, as does the birth of Martha and Rionach.
Sticking to specific cultures and maybe having more than one school. Conflating a bunch of different NA tribes with magical creatures and houses could seem insensitive. Since Ilvermorny is located in Massachusetts, perhaps focus on tribes from the Northeastern Woodlands--granted, that's still A LOT of tribes, but perhaps take the Wampanoag tribe and Iroquois Confederacy as starting points of inspiration. As such, the thunderbird (which is found in the Pacific Northwestern US) probably wouldn't be one of the houses. The Wampus cat is found in Cherokee belief systems (in the Southeast US), so it probably wouldn't be included either--of course, this is in no regards to migration patterns. You could just go with normal animals like Hogwarts' Ravenclaw, Slytherin, and Hufflepuff (maybe using an eagle instead of a Thunderbird and a lynx or cougar instead of the Wampus), or use creatures from Northeast NA cultures (such as replacing the and Wampus and Thunderbird with the Djieien and the Badogiak). An alternate take, if you're intent on doing one school, is explaining how the magical Native American communities interacted with each other for many centuries, resulting in them having a unified culture/tribe outside of the various No-Maj Native American tribes.
Ilvermorny isn't the only school, or it's a MASSIVE school. Texas alone is three times the size of the UK, but Ilvermorny covers ALL of North America? No way on EARTH. The North American population is over 604 million people, according to "world population review" (in contrast to the Uk's 68 million according to "worldometer"), and even if only 10% of them were wizards/witches and 1/5 of them were 11-17, you'd probably need several schools; JK said Hogwarts only has 1,000 students, so each school would have to be HUGE. The only alternative is it being a huge school as big as (or bigger than) Indira Gandhi National Open University, which is the largest university in the world in terms of enrollment, with over 7 million students. Or we could do this the super easy way: NA's current population is over 8.77 times the current population of the UK, so perhaps multiply that by the 1,000 students that attend Hogwarts to get the number of Ilvermorny students: over 8,700 students (as of the time I'm writing this, it's 8,772 students). But that makes the magic population ages 11-17 seem SUPER small; suddenly a school with students in the tens of thousands doesn't sound too small. If you divide Hogwarts' population by the UK population and then use that equation to find the number of wizards/witches attending Ilvermorny, it'd be under 7,400 students. That could also work.
Just have Ilvermorny take students from the United States (and related territories) or the American Anglosphere as a whole--which is basically the same thing, but also includes Canada.
Please let me know if any of this makes sense, if I missed anything, or if I got information wrong about Ilvermorny and/or NA cultures.
36 notes
·
View notes
Text
Brazil faces new COVID-19 wave amid sabotage of child vaccinations

As part of a new global surge driven by the spread of the more infectious and vaccine-resistant Omicron subvariant BQ.1, Brazil is facing its fifth wave of the COVID-19 pandemic, the third this year alone. On Saturday, the country recorded an average of 15,000 cases, a 302 percent increase from two weeks ago, and 37 deaths. Although the average number of deaths had a minus 4 percent variation from two weeks ago, there is a clear reversal of this trend, with three of the five Brazilian regions already showing an increase in the average number of deaths.
In total, Brazil has recorded almost 35 million cases and 689,000 deaths from COVID-19, the second highest number in the world, trailing only the US.
These figures, however, are major underestimates. Since the beginning of the pandemic, the government of the fascistic President Jair Bolsonaro, together with the entire Brazilian political establishment, has made every possible effort to hide the actual scale of the pandemic in Brazil in order to continue guaranteeing private profits.
In June 2020, at the height of the first wave and amid the Brazilian ruling elite’s efforts to reopen the economy after limited lockdowns, the Bolsonaro government tried to censorcumulative case and death figures from the health ministry’s official COVID-19 website, a measure reversed by the Supreme Court. A month later, it ended funding the most extensive epidemiological study on the pandemic in Brazil.
Few parameters express so clearly the lack of monitoring of the pandemic in Brazil as testing. According to Worldometer, the country ranks 148 in testing per million people, behind war-torn countries like Libya and Iraq. At the same time, tens of millions of expired tests have been thrown away repeatedly.
Continue reading.
#brazil#politics#coronavirus#covid 19#brazilian politics#vaccination#mod nise da silveira#image description in alt
14 notes
·
View notes
Text
101 Things You Should Know About the UK Tory Government
Thing 86
Boris Johnson has claimed that if we had not come out of the EU, thereby making ourselves free to:
“..do our own regulation… we wouldn’t have been able to do that vaccine rollout so fast. And you know, it is literally true that Brexit helped save lives." (HuffPost:01/02/230
This claim is totally without merit. According to figures issued by Worldometer today (01/02/23) Britain’s Covid death rate per million head of population is HIGHER than many EU countries.
Country Covid Deaths per Million of Population
United Kingdom 2891
France 2504
Germany 1975
Italy 3100
Spain 2535
Netherlands 1336
Belgium 483
Portugal 2566
Ireland 1686
In the list above, only Italy has a higher Covid death rate than the UK so claims that Brexit saved British lives is just untrue. In fact, the evidence would suggest the exact opposite.
2 notes
·
View notes
Text
Sok vagy kevés emberéletet vesztettünk covidban?
A koronavírus járvány kezdete óta széles körben ismert és elfogadott vélemény, hogy nemzetközi összehasonlításban a halálos áldozatok száma kiemelkedően magas volt Magyarországon. A cikkben a magyar Covid-halálozási adatokat összeurópai (30 országra kiterjedő) összehasonlításban vizsgáljuk. A két év során elvesztett emberéletek száma megfelel annak, amit hazánk Európán belüli, viszonylagos fejletlensége és az 1945-1990 közötti szocialista tervgazdaság negatív öröksége alapján akár előre is megjósolhattunk volna.
Keserű tapasztalat, hogy az összes korlátozó intézkedés ellenére az egymást követő SARS-CoV-2 vírus-mutánsok úgy mentek át a határokon, mint kés a vajon. Ám a vírus-hullámok mégsem ugyanolyan módon és mértékben okoztak megbetegedéseket, illetve követeltek emberéletet az egyes országokban. A Covid esetében a halálos áldozatok számát kétféle módon szokták mérni. Az egyik módszer azt rögzíti, hogy 1 millió lakosra vetítve a két lezárt naptári év (2020, 2021) során hány ember halt meg SARS-CoV-2 fertőzés nyomán fellépő szövődményes betegségekben összesen (kumuláltan). Ezt a mutatót használja többek között a naponta frissülő Worldometers adatbázis, ahol jelenleg a 4. helyen állunk ebben a mutatóban. A másik módszer szerint a két év során bekövetkezett összes halálozás havi adatait a megelőző négy év (2016-2019) átlagos havi adataival vetik össze (többlet-halálozás). Ezeket az adatokat az Eurostat veszi számba.
Az 1. ábrán azt mutatjuk be, hogy a két módszer alapján kialakuló kétféle rangsor a kutatásunkban vizsgált 30 ország esetében nem nagyon különbözik egymástól, vagyis a két adatsor erősen korrelál.

1. ábra
Nézzük először a szélső értékeket! Bulgária mind a kumulált halálozás, mind a többlet-halálozás rangsorában az 1. helyen van – vagyis mind a két mutató szerint itt haltak meg a legtöbben. Izland és Norvégia pedig mind a két rangsorban 29. és 30. helyre került, vagyis itt szedte a Covid a legkevesebb áldozatot. Bulgáriában 2021. december 31-ig, 1 millió lakosra 4488 Covid halott esett, Norvégiában csak 239. Húszszoros különbség! A járvány előtti időszakkal összehasonlítva a 2020 és 2021-es időszak 24 havi adatát, a többlethalálozás mértéke Bulgáriában átlagosan 26% volt, míg a megfelelő norvég adat mindössze 1%-os, az izlandi 3%-os. Leegyszerűsítve azt mondhatjuk, hogy a koronavírus-járvány e két utóbbi országban semekkora többlet-halálozást nem okozott. Magyarország esetében viszont a két rangsor meglehetősen eltérő eredményt mutat: a kumulált halálozás tekintetében az európai országok közül a magyar adat a 2. legrosszabb (1 millió lakosra 4067 Covid-halál esett), a többlet-halálozás sorrendjében viszont a 10. helyre kerültünk, ami sokkal kedvezőbb eredmény.
Ha ezek után alaposabban is megnézzük az 1. ábrát, akkor észrevehetjük a diagram pontjainak eltérő a színezését. A posztszocialista országokat ugyanis pirossal jelöltük, míg az összes többit kékkel. Ha erre is figyelünk, akkor rögtön észrevesszük, hogy akármelyik mérési módszert alkalmazzuk, az egykori szocialista országok (amelyekről persze azt is tudjuk, hogy ezek Európa kevésbé fejlett országai) lényegesen rosszabbul vizsgáztak a két fajta „Covid-teszt”-en, mint a fejlettebb, magasabb 1 főre jutó GDP-vel rendelkező országok. E szabály alól egyedül két balti ország tekinthető kivételnek: Észtország és Lettország.
Az ábrán az is látszik, hogy a többlet-halálozások tekintetében a 14%-os magyar érték valójában kedvezőbb eredmény, mint amit hét másik, hozzánk sok szempontból közelálló posztszocialista ország elért. A legrosszabb adatot (Bulgária) már említettük, de a többlet-halálozás százalékos értéke Szlovákiában és Csehországban is magasabb volt, mint Magyarországon (23% és 20%). A többlet-halálozás tekintetében Ausztria eredménye is csak egy kicsit jobb, mint a magyar adat (11%, illetve 14%)!
A következő lépés során azt vizsgáltuk meg, hogy a 30 európai ország adatai alapján a logikusan szóba jöhető további magyarázó változók közül (pl. egészségügyre fordított kiadások, krónikus betegek aránya, orvosok száma, a kormány iránti bizalom indexe) befolyásolták-e az egyes országok helyét a többlet-halálozási rangsorban. Ebből a célból 29 indikátort egyenként teszteltünk, hogy megtudjuk van-e kapcsolatuk (és ha igen, milyen erősségű) a többlethalálozási adatokkal. Statisztikai értelemben jelentős eredményeket csak három modell adott: az, amely a szocialista múlt mellett az egészségügyi ágazatban dolgozó ápolók (1000 lakosra vetített) számát, a krónikus betegek arányát, illetve a depresszióban szenvedők arányát vette figyelembe. Ez a három változó együttesen a 30 ország Covid többlet-halálozási adatainak szórását kb. 60-70%-ban magyarázza. Ezen belül fontos eredmény, hogy a Covidos betegek életben maradásának esélye az általunk vizsgált 30 országban inkább az ápolás minőségén múlt, és nem pedig az orvosok számán.
Ezek a tényezők persze részben össze is függenek. Az európai mintában – mint már említettük – az egykori szocialista országok sokkal kevésbé fejlettek, mint azok, amelyekben a piacgazdaság hosszú, megszakítás nélküli múltra tekint vissza. Norvégiában – például – az 1 főre jutó GDP piaci áron számolt értéke 5-ször (!) nagyobb, mint a magyar adat és 10-szer nagyobb, mint a bolgár. Kézenfekvő, hogy a gazdagabb országok inkább megengedhetik maguknak azt a luxust, hogy sok nővért foglalkoztassanak. Ezek az empirikus eredmények alátámasztják azt a feltételezést is, hogy az egyes országok nagyon is különböző halálozási adatai elsősorban azzal állnak összefüggésben, hogy a világjárvány kitörésekor ezek az országok gazdasági értelemben mennyire voltak fejlettek és milyen volt a populáció egészségi állapota. A kiinduló helyzet számított leginkább, és nem az, hogy mit csináltak a mintába bevont 30 ország kormányai akkor, amikor már dúlt a járvány.
Ha pedig azt próbáljuk közérthetően megfogalmazni, hogy miként lehetséges, hogy a magyar többlet-halálozási statisztika sokkal kedvezőbb képet mutat, mint a kumulált halálozási adat, akkor erre a válasz tulajdonképpen egyszerű. Magyarországon már a járvány kitörése, azaz a 2020-as naptári év előtt is olyannyira magas volt az évente életüket vesztők száma, hogy ezen a helyzeten – relatív értelemben – a Covid már nem tudott olyan sokat rontani. Konkrét számokat nézve: 2019-ben az 1000 főre vetített halálozás Magyarországon 13,3 fő volt, míg például Németországban 11,3, Franciaországban pedig mindössze 9,1. A környező országokkal való összevetésben is hasonlóan rossz a kép: Ausztriában a fenti halálozási mutató 2019-es értéke 9,4 volt és Szlovákiában is csak 9,9. Bár a járvány idején sok – nyugati mércével nem is túl idős – honfitársunk hunyt el Covidban, a fenti statisztikák azt bizonyítják, hogy sokan közülük akkor is meghaltak volna, ha nincs járvány.
Mint láttuk, a többi európai országhoz képest a magyar többlet-halálozási adatok tehát nem annyira rosszak, mint ahogyan azt a közvélekedés tartja. Ezt támasztja alá a 2. ábra is, amely időben hasonlítja össze a többlet-halálozást Magyarországon és Ausztriában. A 2020-as év első 9 hónapjában – az első hullám idején – az osztrák többlet-halálozás magasabb volt, mint nálunk, míg a második hullám tetőpontján a magyar adat csak kis mértékben haladta meg az Ausztriában is magas értéket. A harmadik hullám idején viszont – 2021. március-áprilisában – a magyar-osztrák összehasonlítás számunkra jóval kedvezőtlenebbnek bizonyult. Ezek az eredmények kapcsolatban állhatnak a két ország által az adott időszakban alkalmazott járványellenes korlátozásokkal, de lehetséges más magyarázat is.
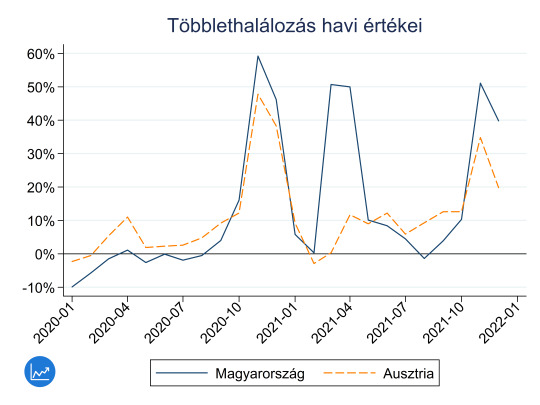
2. ábra
A Defacto szerint a Covid-pandémia egyik tanulsága, hogy széles körű erőfeszítéseket kellene tenni a magyar társadalom általános egészségi állapotának javítására. Sohasem késő!
Mihályi Péter és Kovács Emese (Corvinus Egyetem)
Ha szeretne a Defacto elemzések megjelenéséről email-tájékoztatót kapni, kattintson ide!
7 notes
·
View notes
Text
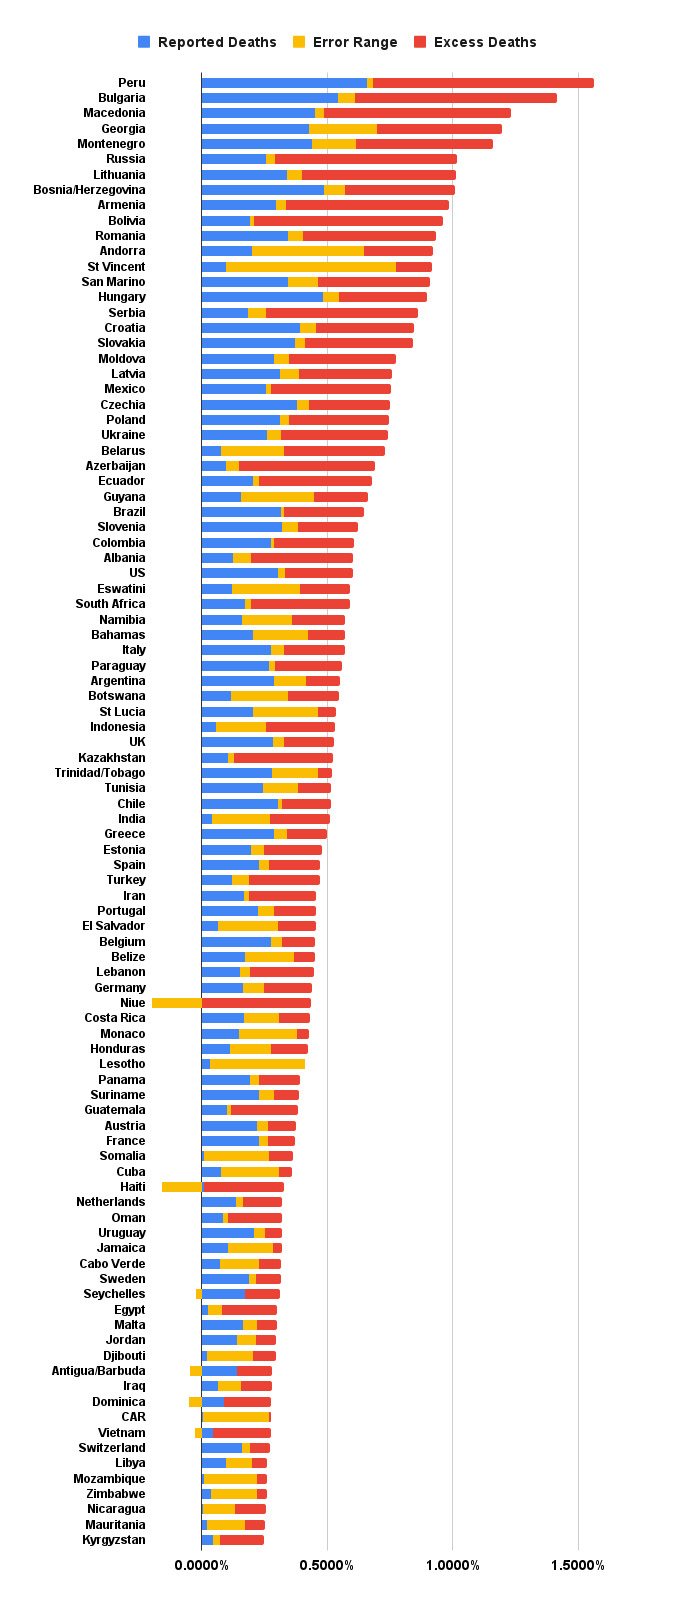

alright here's an updated version with revised population numbers, negative values have been used in basic math properly, and countries with small population but large negative uncertainty (niue, grenada, st kitts/nevis, palau, cook islands) have been truncated in the charts while preserving their actual values in the underlying spreadsheet
if the country names are illegible due to image quality, i could split it into four groups again. but, the point of doing this was, now it's much quicker to do that, and i don't have to individually tune a few dozen lines. (whether you should add or subtract is conditional on whether one or both of the equation terms are negative, which i probably should have like, remembered off the top of my head before making the mistake)
if i wanted to be REALLY accurate, i would have to figure out how to do actual error bars... for some countries, the border between yellow and red portions should be somewhere other than zero, but lines are the correct width overall (except the truncated ones)
i did have a population number for ethiopia that was 6m too high, it moved up about 5 places in the list because of this. not sure why worldometer and WHO disagree on that and nothing else. but that's "the 2020 number was lower," so if anything, there's a high birth rate...? that's like 5%, i don't know if 1.05x is even particularly unusual, compared to other countries' population growth
6 notes
·
View notes
Text
SCANN.IN-PARKING PROBLEMS
“EVERYBODY’S GUIDE TO THE PARKING PROBLEMS”
Do you drive? Have you ever felt helpless with some parked car which blocked your
vehicle, pathway, gate or your workplace? Have you ever had a fight or argument
with someone because of parking issues? So, this article will help you to understand
some ways by which you can easily solve this issue and can have hassle-free
parking in the metropolitan city.
As per the reports, the current population of India is 140 crore based on
Worldometer Elaboration of the latest United Nations data. 8% of Indian households,
that is 1 in 12 households, own a car as of now. From going to offices, grocery
shops, supermarkets, hospitals and so on, our dependence on transportation has
become inevitable. Transportation is used for time saving and convenience for sure,
but when it is blocked by someone else's vehicle in the parking lot it results in
wasting our precious time.
In 2020, a total of 24,27,883 cars were sold in India. A record 3.8 million passenger
cars and commercial vehicles were sold in India in 2021.In a report submitted by the
Society of Indian Automobile Manufacturers (SIAM), until now, the total passenger
vehicle sales rose to 251,052 units in May 2022 from 88,045 units in May 2021.
There are about 10.2 lakh private cars on Mumbai's roads, as the Indian state of
Maharashtra had the highest number of registered motor vehicles.
With the increasing percentage of vehicle ownership in recent times, parking has
become a conflicting and confusing situation for a lot of people. As people park their
car, due to less space, people tend to block cars while parking their own cars. In this
situation, contacting the owner becomes the biggest worry. The person will find the
vehicle owner nearby, honking aggressively, get the vehicle towed or deflate its tires,
or wait for the owner of the vehicle to comeback. In this busy world, no one has that
much time to wait and leaving your vehicle there does not seem a good option.
To tackle such situations, we have discovered SCANN.IN, which helps car owners to
contact each other without revealing their phone number and personal details.
SCANN.IN maintains your privacy and security.
How will Scann.in help you?
You just need to register at www.scann.in. You will get the Scann.in QR Code sticker
for your vehicle for just Rs199 (inclusive all taxes and delivery charges). Then you
have to stick that QR code sticker on your vehicle.
In such situations, when someone's car is blocked by your vehicle, they can contact
you by scanning that QR Code from Scann.in sticker, and the best part of this is that
your identity will stay confidential, as the number flashes to both owners, while
contacting each other will be our virtual number.
So, what are you waiting for? Register yourself today with Scann.in and get your
Scann.in QR code sticker now and encourage your loved ones so that no one will
get stuck in such a situation.
"SCAN KARO CALL KARO"
#business#developers & startups#smallbusiness#digital innovation#digitalindia#scanndotin#scannkarocallkaro#scann
1 note
·
View note
Last Seen Blogs

fitpromedellinstore
Sin título

relentless-fucking-guy
But me? I am all alone

kelzsims
Sims 4 CC Finds

science-from-a-bog
The Scientific Endeavors of a Bog Witch

miaofeng
Miaofeng